.svg)


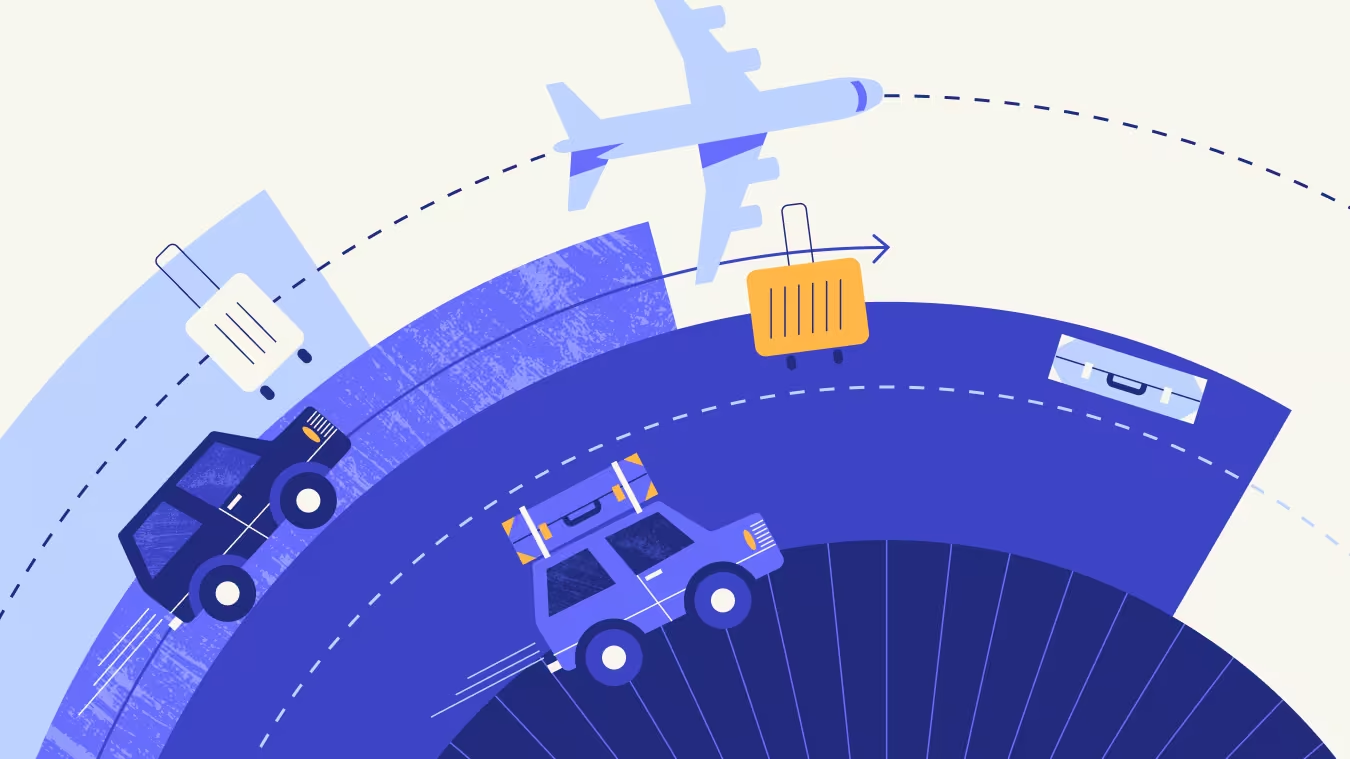
Summer events and concerts are more than just entertainment – they drive community engagement and have a significant economic impact on local businesses.
We took a closer look at the effect of major summer events, like Lollapalooza in Chicago and Governors Ball in New York, on foot traffic to local venues.
Lollapalooza: Energizing Chicago
The first Lollapalooza – a four-day music festival – took place in 1991. Chicago’s Grant Park became the event’s permanent home (at least in the United States) in 2005, drawing thousands of revelers and music fans to the park each year.
This year, the festival once again demonstrated its powerful impact on the city. On August 1st, 2024, visits to Grant Park surged by 1,313.2% relative to the YTD daily average, as crowds converged on the park to see Chappell Roan’s much-anticipated performance. And during the first three days of the event, the event drew significantly more foot traffic than in 2023 – with visits up 18.9% to 35.9% compared to the first three days of last year’s festival (August 3rd to 5th, 2023).
Change In Visitor Profile
Lollapalooza led to a dramatic spike in visits to Grant Park – and it also attracted a different type of visitor compared to the rest of the year.
Analyzing Grant Park’s captured market with Spatial.ai’s PersonaLive dataset reveals that Lollapalooza attendees are more likely to belong to the “Young Professionals” and “Ultra Wealthy Families” segment groups than the typical Grant Park visitor.
By contrast, the “Near-Urban Diverse Families” segment group, comprising middle-class diverse families living in or near cities, made up only 6.5% of visitors during the festival, compared to 12.0% during the rest of the year.
Additionally, visitors during Lollapalooza came from areas with higher HHIs than both the nationwide baseline of $76.1K and the average for park visitors throughout the year. Understanding the demographic profile of visitors to the park during Lollapalooza can help planners and city officials tailor future events to these segment groups – or look for ways to make the festival accessible to a wider range of music lovers.
Businesses Get Boosts
Lollapalooza’s impact on Chicago extended beyond the boundaries of Grant Park, with nearby hotels seeing remarkable surges in foot traffic. The Congress Plaza Hotel on South Michigan Avenue witnessed a staggering 249.1% rise in visits during the week of July 29, 2024, compared to the YTD visit average. And Travelodge on East Harrison Street saw an impressive 181.8% increase. These spikes reflect the festival’s draw not just for locals but for out-of-town visitors who fill hotels across the city.
The North Michigan Avenue retail corridor also enjoyed a significant increase in foot traffic during the festival, with visits on Thursday, August 1st 56.0% higher than the YTD Thursday visit average. On Friday, August 2nd, visits to the corridor were 55.7% higher than the Friday visit average. These numbers highlight Lollapalooza’s role in driving economic activity across Chicago, as festival-goers venture beyond the park to explore the city’s vibrant retail and hospitality offerings.
Queens Keeps it Cool
City parks often serve as community hubs, and Flushing Meadows Corona Park in Queens, NY, has been a major gathering point for New Yorkers. The park hosted one of New York’s most beloved summer concerts – Governors Ball – which moved from Governors Island to Flushing Meadows in 2023.
During the festival (June 9th -11th, 2024), musicians like Post Malone and The Killers drew massive crowds to the park, with visits soaring to the highest levels seen all year. On June 9th, the opening day of the festival, foot traffic in the park was up 214.8% compared to the YTD daily average, and at its height, on June 8th, the festival drew 392.7% more visits than the YTD average.
The park also hosted other big events this summer – a July 21st set by DMC helped boost visits to 185.1% above the YTD average. And the Hong Kong Dragon Boat Festival on August 3rd and 4th led to major visit boosts of 221.4% and 51.6%, respectively.
These events not only draw large crowds, but also highlight the park’s role as a space where cultural and civic life can find expression, flourish, and contribute to the health of local communities.
The Reach and Resonance of Events
Analyzing changes in Flushing Meadows Corona Park’s trade area size offers insight into how far people are willing to travel for these events. During Governors Ball, for example, the park’s trade area ballooned to 254.5 square miles, showing the festival's wide appeal. On July 20th, by contrast, when the park hosted several local bands and DJs, the trade area was a much more modest 57.0 square miles.
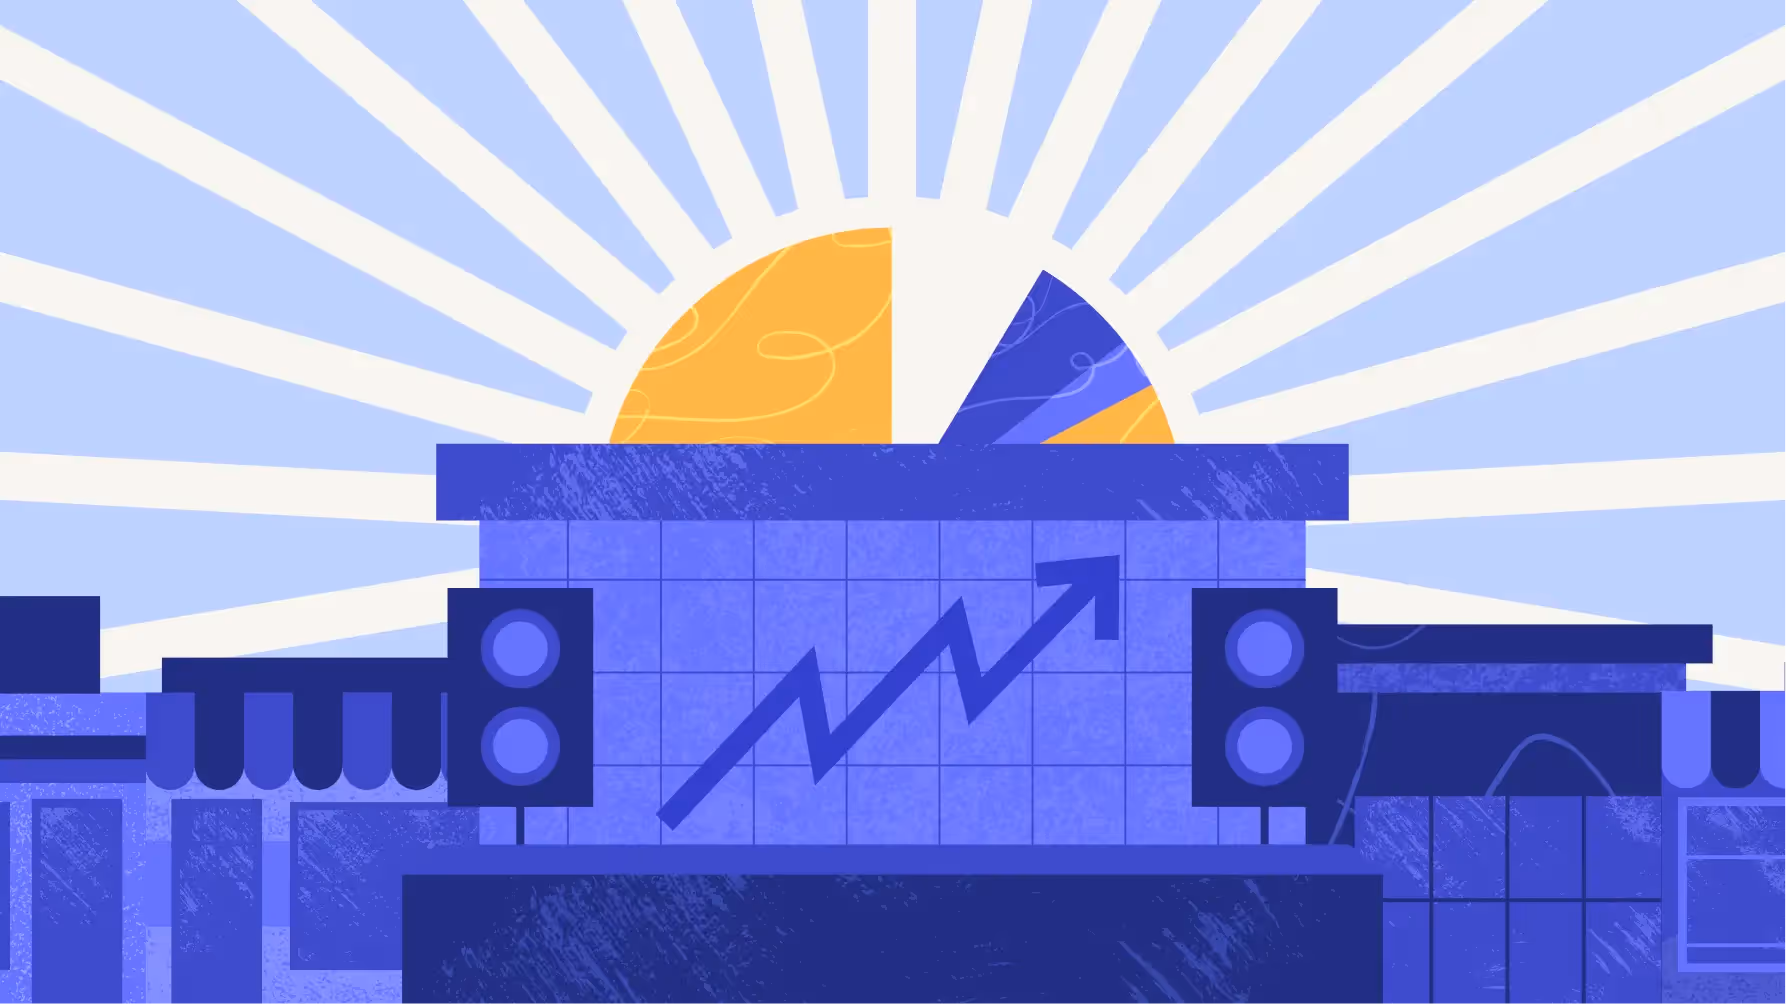
Ready, Set, Summer
Summer events drive community engagement, economic activity, and civic pride. Cities that invest in their parks and event hubs, fostering lively and inclusive spaces, can create lasting value for both residents and visitors, enriching the cultural and social life of urban areas.
For more data-driven civic stories, visit Placer.ai.


.avif)