


.svg)


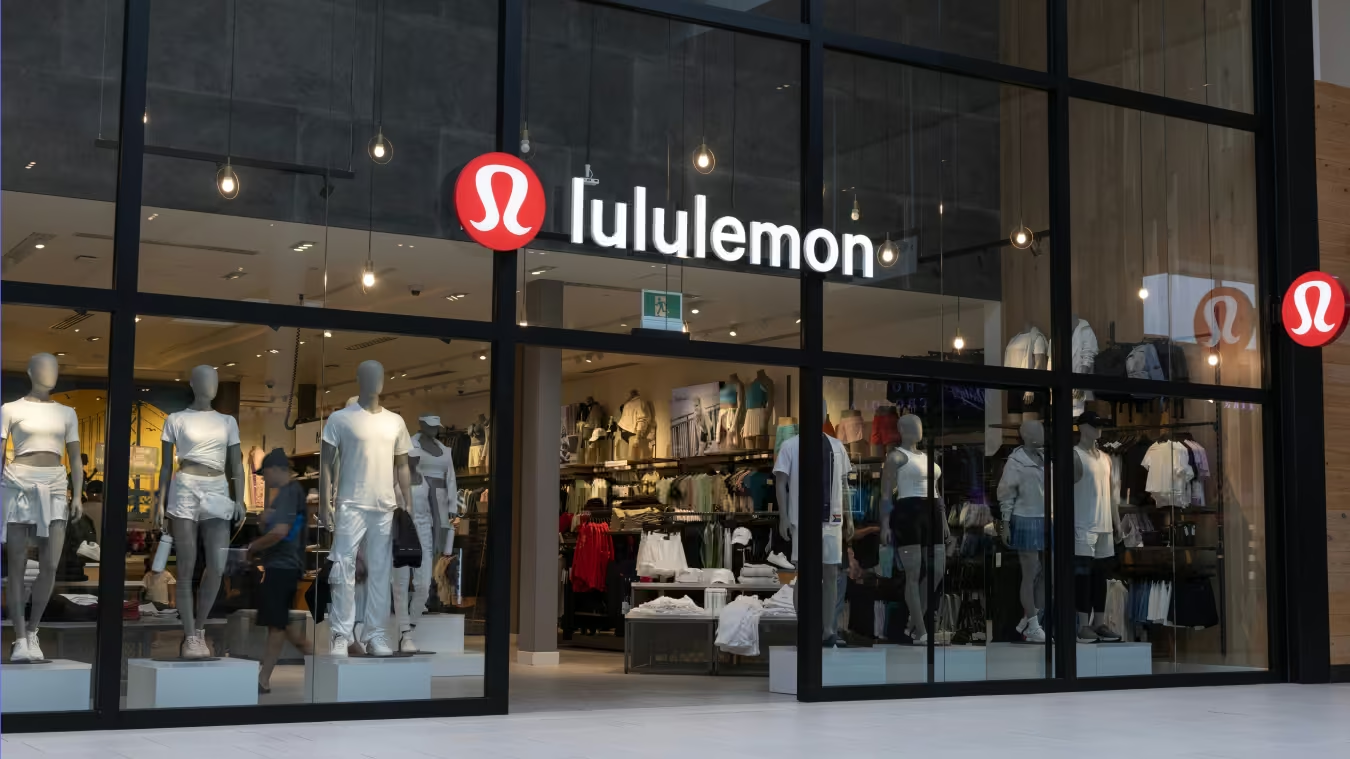
How is lululemon performing in a challenging retail environment, and what does Black Friday data suggest about the holiday shopping season already under way? We dove into the data to find out.
Year-over-Year Visits Pick Up in October
Visits to lululemon were up 4.2% year over year (YoY) in Q3 2025 – a promising sign ahead of the holidays. And though monthly same-store visits trended slightly negative YoY, same-store traffic grew in October – a positive sign ahead of a critical holiday season.
Holiday Season Provides lululemon With A Reliable Boost
Looking back at previous holiday seasons provides further room for optimism for lululemon. The retailer reliably sees late-year traffic spikes – on Black Friday and especially at the end of December, when its End-of-Year sale and Boxing Day discounts pull in last-minute and bargain-seeking shoppers.
Strong Start to the Holiday Season
Black Friday 2025 data shows that luluemon is already off to a strong start, with visits surpassing even last year's strong performance – the chain experienced a 350.8% increase in visits compared to its January to September 2025 daily visit average.
Looking ahead, this early momentum positions lululemon to reclaim share during what many retailers expect to be a tighter holiday season. Given macroeconomic headwinds and shifting consumer sentiment, early wins like this may be critical – strong traffic now could translate into outsized holiday-season revenue, reinforce customer loyalty, and help offset any softening in post-Black-Friday demand.
Looks Like a lululemon Lift
Lululemon is driving increased foot traffic despite visit softness earlier in the year and persistent consumer headwinds. With the all-important holiday season fast-approaching, will the chain continue to drive visit growth?
For more data-driven retail insights follow Placer.ai/anchor.
Placer.ai leverages a panel of tens of millions of devices and utilizes machine learning to make estimations for visits to locations across the US. The data is trusted by thousands of industry leaders who leverage Placer.ai for insights into foot traffic, demographic breakdowns, retail sale predictions, migration trends, site selection, and more.

Home-cooked meals may anchor the holidays, yet dining out remains a key part of the seasonal rhythm. Examining how visits trended last year helps illuminate which segments could gain the most traction this December and where holiday dining demand may concentrate.
Fine Dining Leads the Holiday Charge
While the holiday season is a major period for retail, some dining segments also experience a notable lift. Visits to the coffee category outperformed their 2024 weekly average in November, likely boosted by the appeal of leading chains' holiday menu and the popularity of Starbucks' Red Cup Day. The category saw another surge the week before Christmas, as shoppers sought out caffeine to power through last-minute errands.
Full-service restaurants tend to see visitation build towards the end of the holiday season – visits were 7.1% higher than average the week of December 16th, 2024, and remained elevated during the week of Christmas, even as other dining categories experienced slight dips. This likely reflects the shift from workday and errand-driven routines to family gatherings, out-of-town guests, and special-occasion meals. Meanwhile, categories like QSR, fast casual, and coffee tend to soften as commuting, shopping, and other everyday behaviors pause for the holiday.
Meanwhile, fast-casual and quick-service segments trended lower during holidays than they did during the rest of the year – though the week before Christmas bucked the trend, likely lifted by shoppers stopping for quick meals amid last-minute errands.
Upscale Dining Leads Full-Service Growth
Within full-service dining, upscale and fine-dining concepts were the clear standouts of the season. The segment saw steady gains throughout December, culminating in a 33.7% jump the week of December 16th and remaining elevated into Christmas week – a pattern likely supported by companies and large groups booking higher-end restaurants for end-of-year celebrations.
Breakfast-first chains, by contrast, showed softer performance for most of the period and only saw meaningful lifts during family-focused holiday weeks, when out-of-town visitors and holiday traditions drove more morning and brunch outings.
Casual dining and eatertainment concepts also experienced holiday-related bumps, but in distinct ways. Casual dining saw a brief boost the week of November 11th, likely tied to Veterans Day promotions, and then a more meaningful lift the week before Christmas as consumers grabbed convenient meals while running last-minute errands. Eatertainment venues, on the other hand, peaked during Christmas week, benefiting from families seeking activity-based outings once holiday gatherings were underway. While neither category matched the sustained strength of upscale dining, each captured demand consistent with the role they play in the holiday dining cycle.
Lead-up To The Holidays
Looking ahead to this year’s holiday season, the year-over-year dining patterns point to a dining landscape led once again by upscale and fine dining. This segment is the only one showing consistent momentum heading into November, with steady gains that suggest another strong December for premium full-service concepts.
The rest of the full-service category is entering the season on more uneven footing. Breakfast-first chains, eatertainment venues, and casual dining brands are all tracking close to or below last year’s levels, with several weeks of declines and only brief periods of improvement. While the weeks of November 10th and 17th offer early signs of stabilization for some segments, the broader picture remains mixed.
Still, holiday dining behaviors typically shift sharply as Thanksgiving, Christmas travel, and family gatherings come into focus. If past patterns hold, all four segments may see meaningful late-season lifts – but upscale dining is the category best positioned to outperform as the holidays accelerate.
Ready, Set, Dine!
Upscale and fine dining, coffee, and breakfast-first chains demonstrated clear seasonal lifts last year. As December approaches, will these patterns re-emerge, or will consumer caution lead to wider pull-backs among the dining segment?
For the most up-to-date dining data, check out Placer.ai’s free tools.
Placer.ai leverages a panel of tens of millions of devices and utilizes machine learning to make estimations for visits to locations across the US. The data is trusted by thousands of industry leaders who leverage Placer.ai for insights into foot traffic, demographic breakdowns, retail sale predictions, migration trends, site selection, and more.

Darden Restaurants Inc. (NYSE: DRI) owns and operates some of the country’s most recognizable dining brands. The group carried solid traffic and sales momentum into Q3 2025, led by LongHorn and Olive Garden, positioning it for a successful holiday season.
We analyzed recent visit trends to see which concepts are driving Darden’s growth – and which are likely to drive big gains during the holiday season.
Accelerating Traffic Gains
After a softer start to 2025, Darden’s visit growth strengthened as the year progressed. Portfolio-wide traffic increased 2.3% year over year (YoY) in Q2 and 3.0% in Q3, supported in part by an expanding footprint. Most analyzed months also posted YoY gains, with October closing the period on a strong note at a 4.5% traffic increase. And the company’s steady visit growth has helped boost sales, reflected in recent results with Q3 FY25 sales growing by 6.2%, with blended same-restaurant sales up 0.7%.
Same-Store Gains Across Darden’s Biggest Brands
Visit patterns across Darden’s three largest brands show that the company’s growth isn’t just coming from new unit expansion – it’s also being fueled by healthy same-restaurant performance.
Olive Garden posted steady same-restaurant gains throughout the period, ranging from 1.0% to 4.8%, while LongHorn delivered 0.9% and 6.0% YoY increases. As Darden’s two largest concepts, these brands remain the company’s key growth drivers, with Olive Garden’s value positioning and LongHorn’s affordability-focused messaging helping sustain elevated visit levels. Cheddar’s Scratch Kitchen also contributed meaningfully, recording visit increases each month.
Taken together, the results underscore a resilient portfolio. Even as parts of the casual dining sector face pressure, Darden continues to grow visits across its flagship concepts.
Smaller Upscale Brands and Core Concepts Poised for Holiday Success
In addition to its core brands, Darden operates a robust portfolio of smaller upscale concepts – several of which serve as major holiday-season traffic drivers. And early visit data suggests that these banners are poised for another strong seasonal performance, alongside the company’s flagship banners.
In 2024, Seasons 52 – Darden’s polished, seasonally-inspired brand – enjoyed a sizable visit boost during the weeks before and of Christmas as guests sought elevated, special-occasion experiences. Ruth’s Chris Steak House experienced a similar surge, reflecting strong holiday demand for premium steakhouse experiences. And although Yard House focuses more on beer and bar-forward fare, its ability to attract higher-income visitors helped deliver a modest seasonal bump as well. Meanwhile, Olive Garden and LongHorn Steakhouse also drew increased traffic as value-oriented diners leaned on familiar, crowd-pleasing offerings during the holiday period.
Fast-forward to 2025, and early foot-traffic trends suggest another strong holiday season for these banners. Visits across the last weeks of October through mid-November were broadly positive – and if current momentum carries forward, Darden’s elevated and casual dining concepts appear well-positioned to match or even surpass last year’s holiday strength.
Dining Demand Dynamics
Even in an economic climate marked by consumer caution, Darden is enjoying elevated visits. And this momentum seems poised to carry through both casual and upscale banners as the company approaches a high-traffic holiday season.
For the most up-to-date dining data, check out Placer.ai’s free tools.
Placer.ai leverages a panel of tens of millions of devices and utilizes machine learning to make estimations for visits to locations across the US. The data is trusted by thousands of industry leaders who leverage Placer.ai for insights into foot traffic, demographic breakdowns, retail sale predictions, migration trends, site selection, and more.

Visits to DICK’S Sporting Goods remained below 2024 levels through most of 2025, but the year-over-year (YoY) gap has narrowed – improving from -6.0% in Q1 to -2.6% in Q3. This YoY visit gap is partly due to store closures: Over the past year, DICK’s has closed several locations, leading to a drop in its total unit count. And monthly data points to renewed momentum for Q4 – October visits climbed 2.2% YoY, marking the company’s strongest performance of the year and a promising sign for the holiday season.
DICK’s solid positioning ahead of the holidays is also supported by recent sales results. For the quarter ending August 2nd, 2025, comparable sales rose 5.0% YoY, driven primarily by a 4.1% increase in average ticket size and supported by a 0.9% uptick in transactions – with e-commerce once again outpacing overall company performance.
The retailer is also deepening its digital engagement through its Game Changer youth sports app, which last quarter reached 7.4 million unique active users. At the same time, DICK’S recent acquisition of Foot Locker opens new opportunities to drive in-person shopping growth, while its expanding House of Sport concept strengthens the brand’s experiential footprint.
As the all-important holiday season approaches, will DICK’S continue to grow its foot traffic? Or will inflation fatigue keep shoppers at home?
Follow Placer.ai's data driven retail analyses to find out what lies ahead for DICK’S.

Consumer sentiment has fallen to historic lows as financial strain and inflation fatigue take their toll. Yet some retail categories continue to see steady visit growth, and dollar stores are among the standouts.
We dove into the visit data for two major players in the space – Dollar Tree and Dollar General – to see how they are faring in 2025.
Strong Quarterly Trends
Dollar Tree and Dollar General are entering the final quarter of the year on the tails of consistent, meaningful visit growth, with visits to both chains elevated every quarter from Q1 2024 onward. These results are consistent with both chains’ reporting, with Dollar Tree’s Q2 2025 net sales up 12.3% YoY, and comp sales rising 6.5%. Dollar General delivered similarly steady growth, with Q2 2025 net sales up 5.1% while same-store sales grew 2.8%.
Monthly Visits Show October Uptick
Monthly visits, like quarterly trends, were elevated, with a notable uptick in October. Dollar Tree’s YoY visits climbed from -0.1% in September to 2.8% in October, while Dollar General’s rose from 4.4% to 6.0% over the same period, likely driven by Halloween shopping and early seasonal momentum ahead of the holidays.
Both brands continue to focus on expanding their fleets, signalling that both Dollar Tree and Dollar General are confident that their value propositions will continue to resonate with shoppers.
Value Drives Visits
Dollar Tree and Dollar General continue to grow, propelled by consumers’ ongoing prioritization of value and affordability. As the holiday season approaches, both retailers seem well-positioned to capture increased traffic and spending from cost-conscious shoppers.
For the most up-to-date retail insights, check out Placer.ai’s free tools.
Placer.ai leverages a panel of tens of millions of devices and utilizes machine learning to make estimations for visits to locations across the US. The data is trusted by thousands of industry leaders who leverage Placer.ai for insights into foot traffic, demographic breakdowns, retail sale predictions, migration trends, site selection, and more.

Retailers nationwide are entering a holiday season defined by tight budgets. Still, demand persists, and consumers are juggling inflation fatigue with a willingness to splurge selectively. Department stores – historically strong holiday performers – are navigating uneven results, with some brands showing surprising strength, while others face continued headwinds.
2024 Trends Persist
Department store visits in Q3 2025 remained mostly below last year’s level, although performance varied by brand – Bloomingdale’s (5.4%), Nordstrom (2.0%) and Dillard’s (0.3%) posting YoY visit growth while other major department store chains saw visit declines.
An October Turnaround
While Q3 2025 saw broad visit declines, October offered meaningful room for optimism ahead of what is sure to be a closely-watched holiday shopping season.
Visits improved across the board, with all but three analyzed chains experiencing YoY visit growth. While successful early holiday promotions likely played a role, much of the momentum reflects retailers’ refreshed campaigns and in-store strategies – a sign that their efforts to reenergize foot traffic are paying off.
Bloomingdale’s has leaned into its luxury positioning with high-impact experiential campaigns like its “Just Imagine” activation and new personalization initiatives, while Nordstrom has strengthened its omnichannel experience while tapping into AI-powered capabilities to predict demand. And both brands effectively balance an appeal to affluent customer segments less acutely affected by inflation with the broad reach necessary to support frequent visitation.
Key Shopping Days Still Move the Needle
Despite recent challenges, mid-tier department stores are the ones that shine most during the holidays – and as the holiday season approaches, last year’s trends offer insight into what to expect in 2025.
In 2024, JCPenney and Belk posted the largest visit spikes during key holiday shopping days. Black Friday gains were especially pronounced, though Super Saturday also delivered substantial lifts. Macy’s visit boosts came in third – likely reflecting its enduring holiday association, from flagship displays and Santa tours to national promotions that keep the brand top-of-mind.
These peaks highlight just how important the holiday season is for mid-tier department stores, while also revealing opportunities for the rest of the year: Targeted promotions, limited-time offers, and event-driven campaigns can still draw major in-store surges, even outside traditional holiday periods. And should typical trends hold, 2025’s fast-approaching holiday season will provide a welcome boost across the board for all brands.
Holiday Success Within Reach for Mid-Tier Department Stores
While October’s momentum offers room for optimism, the broader foot traffic declines seen in Q3 underscore the challenges department stores face amid a bifurcated retail landscape increasingly split between luxury and off-price competitors. Still, holiday season success remains within reach – particularly for brands like Bloomingdale’s and Nordstrom willing to rework existing strategies and adapt to reach ever more discerning shoppers.
For the latest data-driven department store trends, check out Placer.ai’s free tools.
Placer.ai leverages a panel of tens of millions of devices and utilizes machine learning to make estimations for visits to locations across the US. The data is trusted by thousands of industry leaders who leverage Placer.ai for insights into foot traffic, demographic breakdowns, retail sale predictions, migration trends, site selection, and more.

