Venue Analytics for Attractions, Entertainment & Live Events
Use venue analytics and event attendance data to reach more of your target audience, benchmark against competing venues, and choose the right markets to grow.


Where Do We Go From Here?

Gain hands on experience with the data

Meet our advisors to learn more about Placer


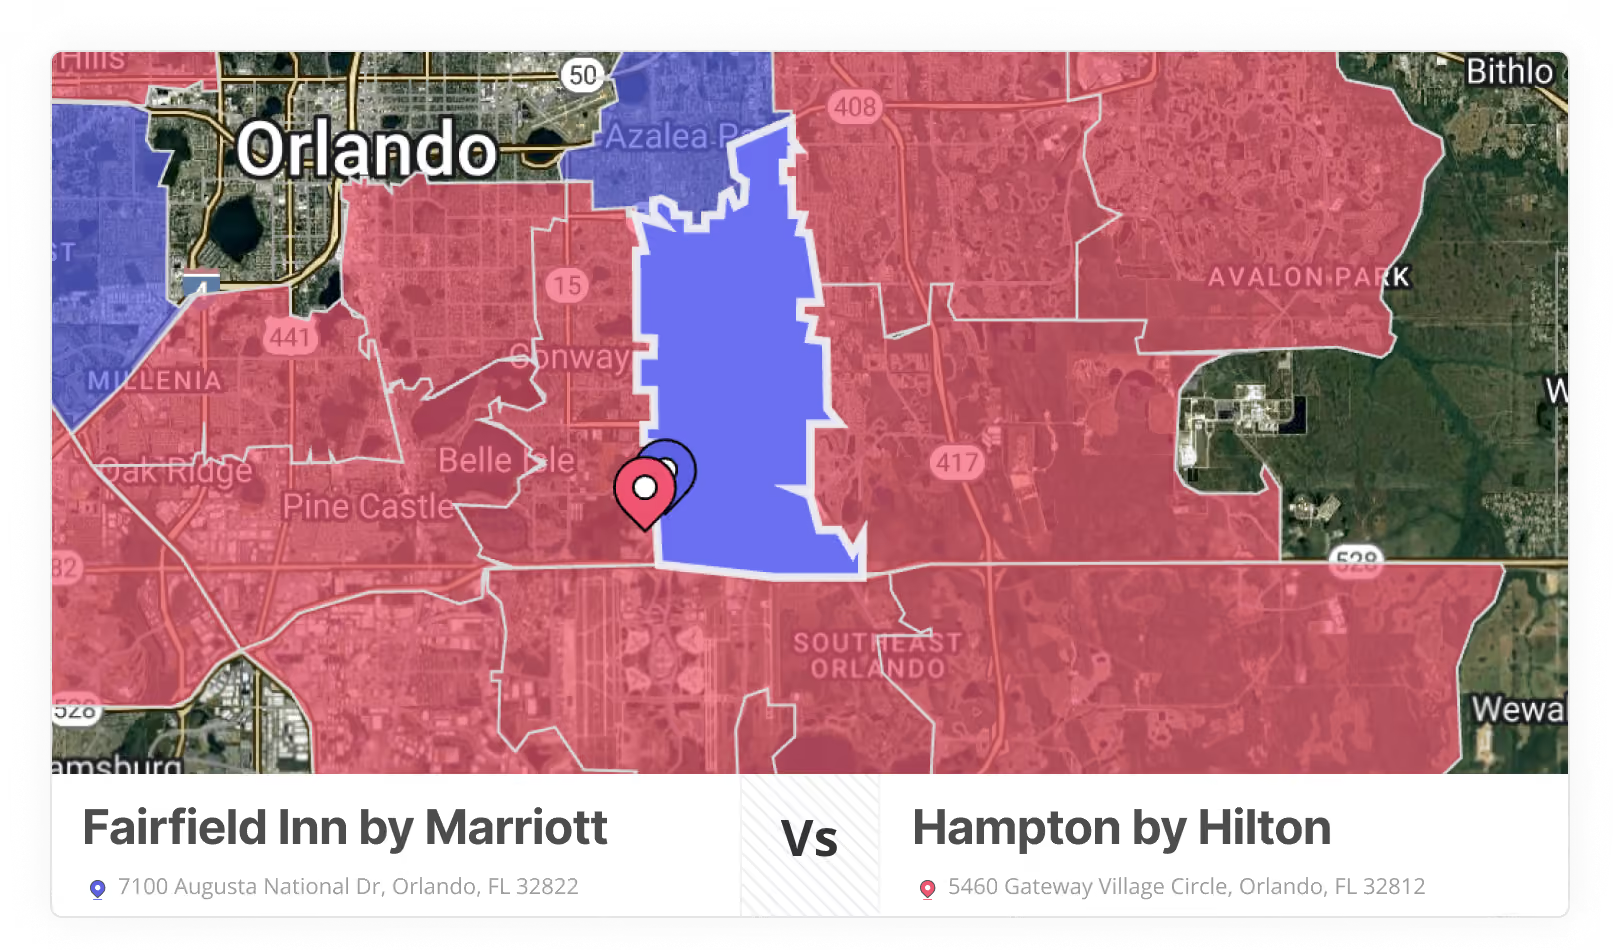
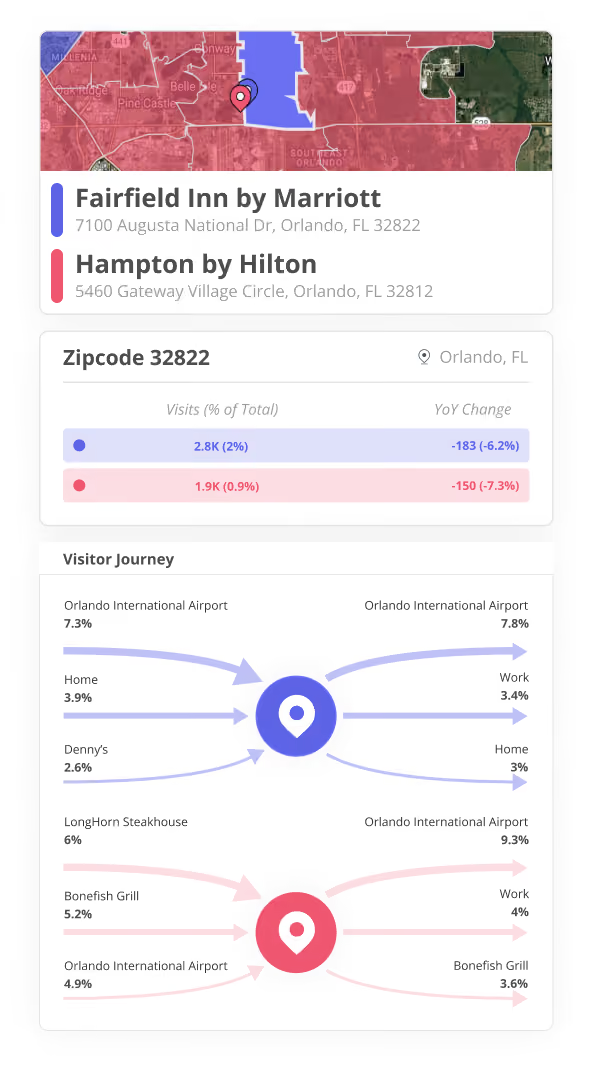
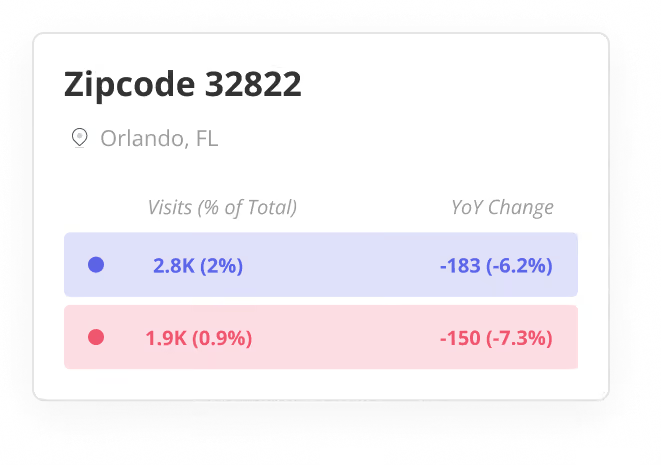
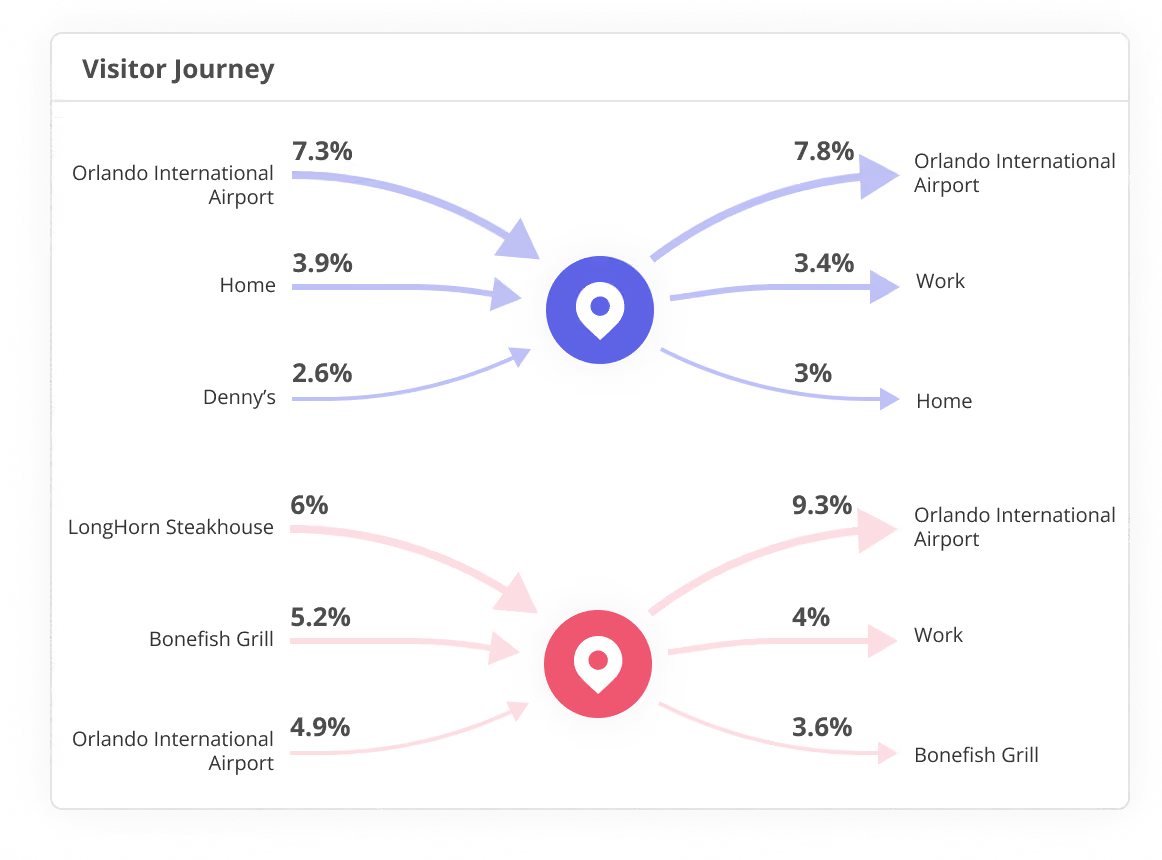
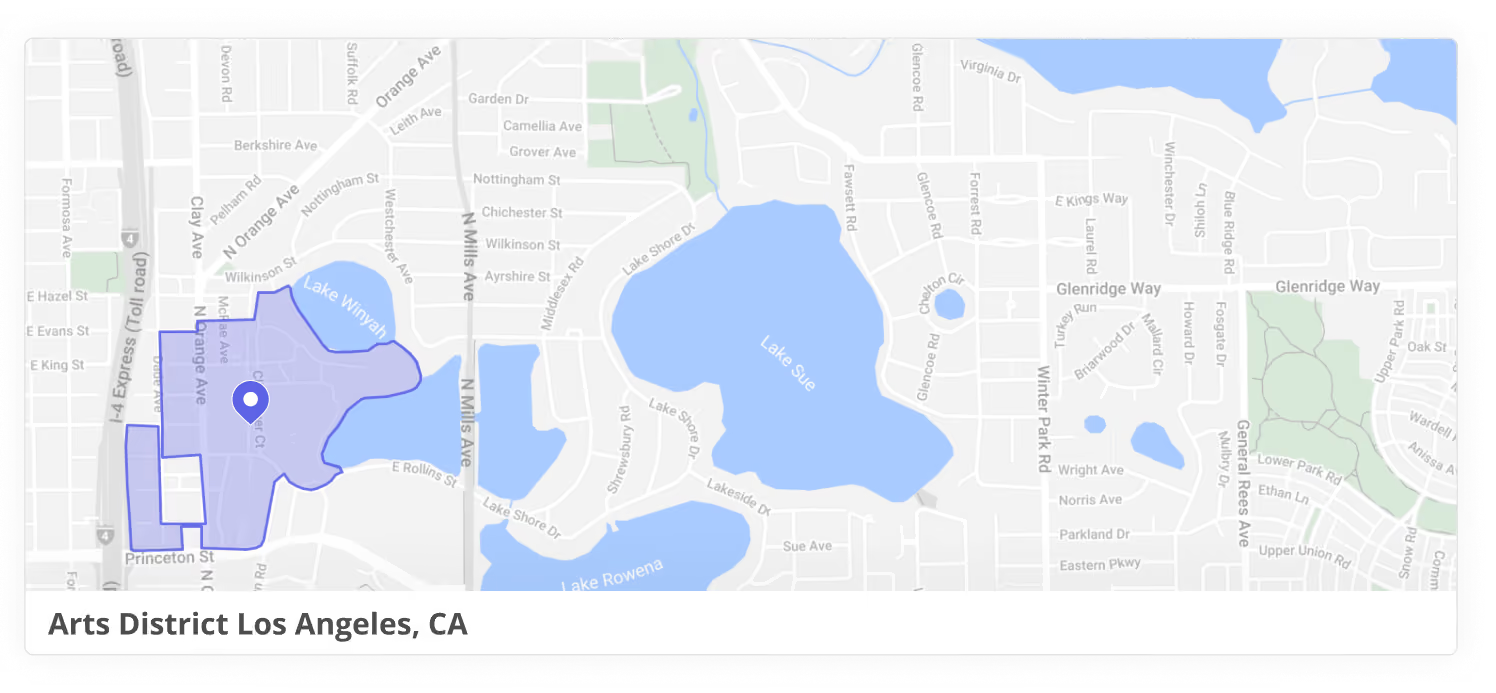
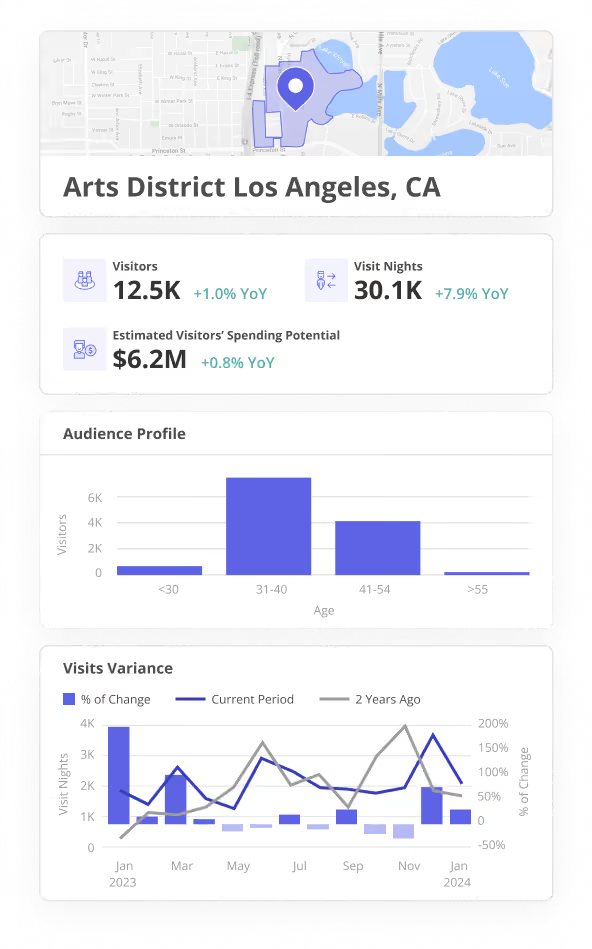
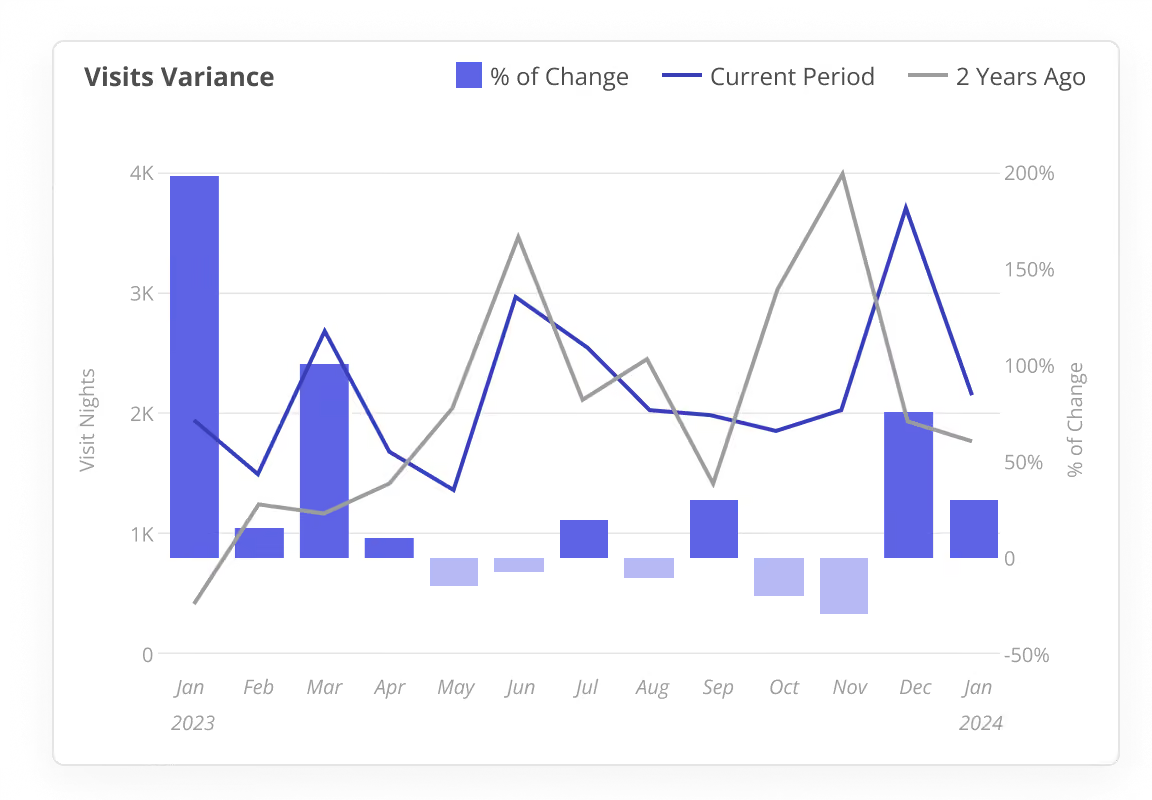
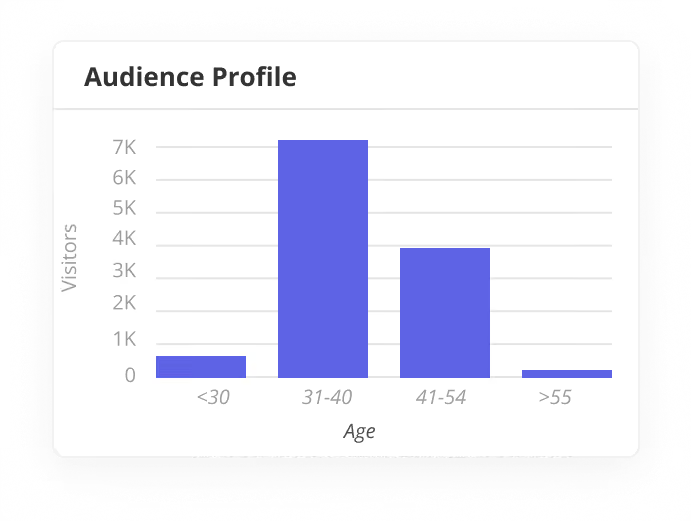







We leverage a panel of tens of millions of devices and reliable statistical analysis to ensure the highest level of accuracy.

We utilize industry-leading techniques to ensure user privacy while maximizing accuracy and reliability.

Our data refreshes daily, so you're always working with a current picture of foot traffic and audience behavior, not stale snapshots.

Export our aggregated data for use in 3rd party applications using our API, allowing you to enrich, filter, or combine with proprietary data.

Thousands of customers across multiple different industries place their trust in our insights.

Beyond the platform, our team of analysts and industry experts can help you translate data into strategy and get answers to your toughest questions.


"Without Placer, there is no way I could have data this granular and accurate, or that helps me prove sponsor alignment. With Placer we now know exactly what our numbers are and can credibly talk through what we do.״


"Since signing up for Placer, our marketing efforts have done a complete 360, generating the best sales we’ve ever seen."


"From the physical layout to programming and media IP used, the majority of the multi-million dollar family entertainment project was guided by Placer data insights. The quality of Placer data is simply unparalleled."

How Placer.ai helps with attendance tracking, sponsorship sales, and market expansion.

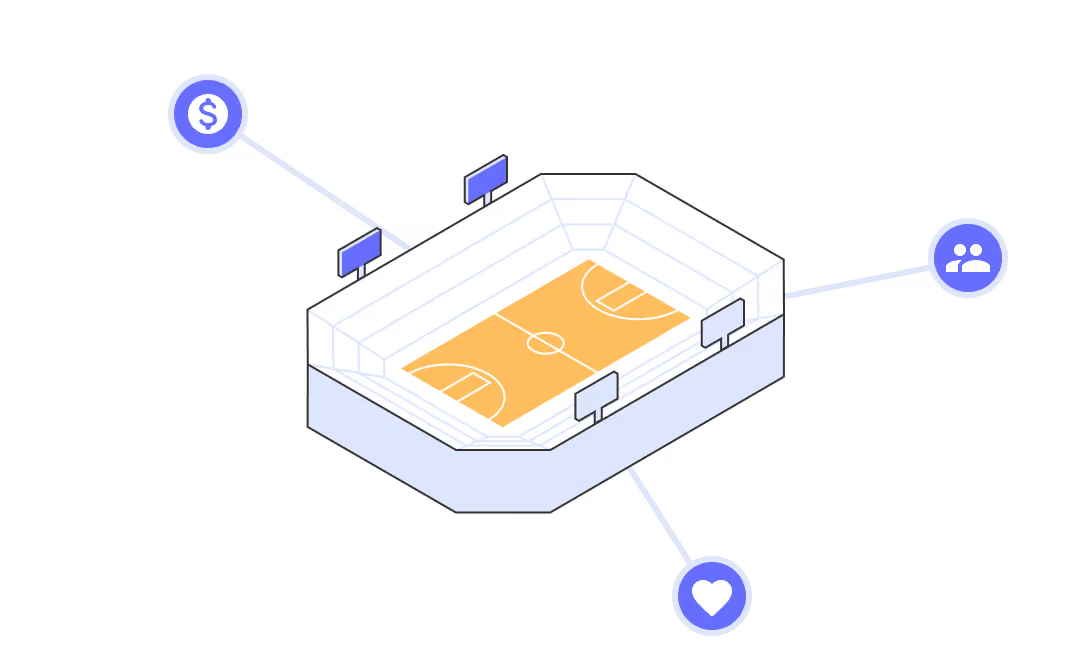
Theme parks, museums, theaters, family entertainment centers, and live event operators use Placer.ai's venue analytics to understand visitors, benchmark competing venues, choose markets for new venues, win sponsorships, measure event ROI, and set staffing and pricing.
Venues use Placer.ai fan analytics and visitor insights to show sponsors how their audience's preferences and interests align with the sponsor's brand, supporting stronger sponsorship and partnership deals and year-round revenue.
Yes. Placer.ai reports event attendance data and visitor demographics for the exact event window, so operators can measure the return on special events and promotions and refine marketing for the next one.
An entertainment attraction choosing between two markets used Placer.ai to compare seasonality and overall growth, then selected the stronger market at about 10% of the cost of traditional surveys. The project modeled 800K expected guests a year with an average visit of 2.5 hours.
Operators analyze visit counts, length of stay, and peak times to understand visit patterns, then adjust staffing and pricing to match demand and improve the guest experience.
Entertainment and attraction teams can request a demo to review specific venues, events, and visitor markets. Paid plans are customized subscriptions scoped to each organization, and every customer gets a dedicated Customer Success Manager at no extra fee. Details on how Placer.ai sources and protects its data are on the Our Data page.