
Thanks for Visiting!

Register for free to get the full story.

Sign Up
Already have a Placer.ai account? Log In
Article

Target’s October Circle Week: A Data-Driven Snapshot

Find out how this years' October Target Circle Week resonated with consumers.

By 
Lila Margalit
October 23, 2024
Target’s October Circle Week: A Data-Driven Snapshot
SHARE
Explore our free tools to get timely insights into key industries
Check out the latest trends for
Key Takeaways
  • Following a lackluster September, year-over-year (YoY) visits to Target rose 1.8% during the week of October 7th 2024. And a direct comparison of this year’s October Circle Week (Oct. 6th-12th) to last year’s sales event (Oct. 1st-7th) shows visits up 0.7% YoY.
  • Target’s performance during this year’s October Circle Week varied between regions – with some major markets, including Texas (4.2%) and Florida (3.8%), seeing substantial YoY visit boosts. In the Midwest and Northeast, on the other hand, the event drew somewhat fewer visitors than last year. 
  • Target’s October Circle Week follows a predictable pattern, with visits peaking on the Sunday of the launch, settling down during the work week, and then picking up again on Friday and Saturday.

Holiday shopping creep is upon us once again. Though Black Friday is still several weeks away, a shorter holiday shopping window (just 27 days between Thanksgiving and Christmas) has many retailers more eager than ever to get the ball rolling. And with Amazon’s October Prime Big Deal Days the focus of much consumer excitement, major brick-and-mortar players like Walmart, Target, and Best Buy have launched important fall sales events of their own.

Among these pre-holiday promotions, Target’s October Circle Week stands out as a favorite, offering millions of shoppers deep discounts across a wide range of categories, from household essentials to early holiday gifts. What can location analytics tell us about how this year’s Circle Week (October 6th-12th) resonated with consumers? We dove into the data to find out. 

Right on Target

Looking first at weekly year-over-year (YoY) visits to Target shows the power of this major sales event to get shoppers moving. Following a successful back-to-school shopping season, visits began to taper off in September. But during the week of October 7th, which included most of Circle Week, visits began to trend back upwards – perhaps signaling consumer responsiveness to early holiday discounts.

Visits for August 5 '24 - October 7 '24 compared to 2023 shows a 1.8% increase in traffic for circle week at Target

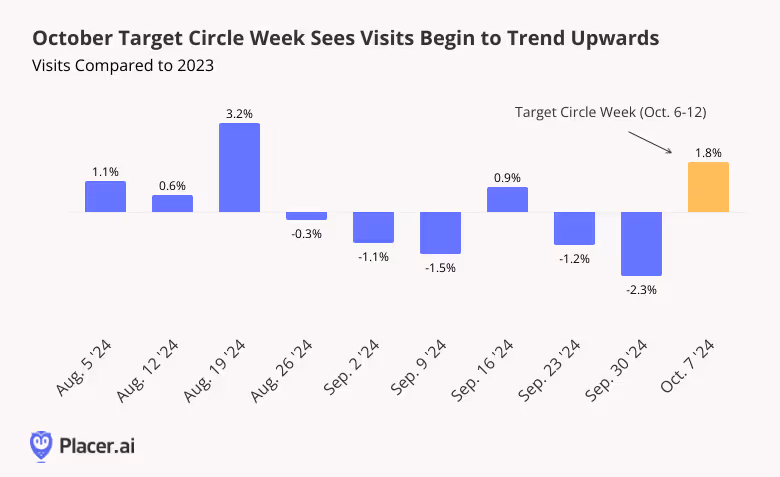
A more direct comparison between this year’s fall Target Circle Week and the one held in October 2023 (October 1st to 7th of last year) shows foot traffic up 0.7% YoY, further highlighting consumer resilience in 2024. Though the increase is a modest one, it is no small feat in a retail environment still characterized by high prices and cautious consumer sentiment.

A Nuanced Regional Story 

Drilling down deeper into the data for different regions of the country paints a somewhat more nuanced picture. While in some areas of the country – particularly the Midwest and Northeast – Target Circle Week drew fewer visits this year than last (in most cases a decline of less than 3.0%), in others foot traffic increased substantially. In major southern markets like Texas and Florida, visits rose 4.2% and 3.8%, respectively. South Carolina, which has emerged as a major domestic migration hotspot in recent years, saw traffic jump an impressive 12.6%. And in California, Target’s biggest market, visits increased 1.0% YoY.

Visits to Target on 2024 Fall Circle Week (Oct. 6-12), Compared to 2023 Fall Circle Week (Oct. 1-7) shows Target Sees Biggest YoY Circle Week Visit Boosts in South and West

A Weekend Affair

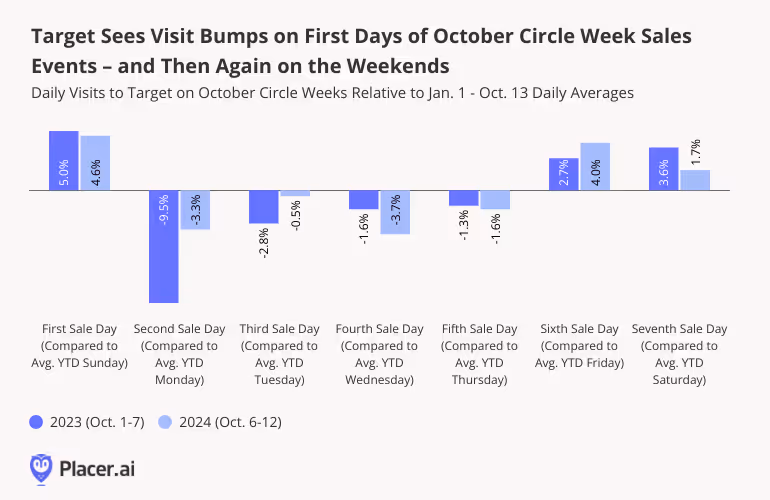
But consumer behavior during Target Circle Week doesn’t just vary across regions – it also changes throughout the week-long sale period. 

In both 2023 and 2024, Target’s October Circle Week started with a bang, as eager customers flocked to the chain to get first dibs on special sale items. Visits on launch day increased 5.0% in 2023 and 4.6% in 2024, compared to a January 1st to October 13th daily visit average. Activity then tapered off during the work week, with Monday - Thursday visits hovering just below daily visit averages for those days of the week. But on Friday and Saturday, foot traffic picked up again as shoppers utilized their time off to hit the sales.

Target Sees Visit Bumps on First Days of October Circle Week Sales Events – and Then Again on the Weekends  Daily Visits to Target on October Circle Weeks Relative to Jan. 1 - Oct. 13 Daily Averages


Holidays Ahead

Early October holiday sales are quickly becoming de rigueur – and an important bellwether of overall Q4 performance. Target’s successful Circle Week this fall signals consumer resilience in the face of headwinds – though engagement levels varied throughout the country. How will the all-important Q4 continue to play out for brick-and-mortar retailers this year? 

Follow Placer.ai’s data-driven retail analyses to find out. 

This blog includes data from Placer.ai Data Version 2.1, which introduces a new dynamic model that stabilizes daily fluctuations in the panel, improving accuracy and alignment with external ground truth sources.

Learn how downtown regions across US cities are measuring up with our free tools.
Check out the latest trends for

Related Topics

Stay Anchored: Subscribe to Insider & Unlock more  Insights
Subscribe
SHARE
Get 3 brand & industry
breakdowns every week
Subscribe to the newsletter
Oops! Something went wrong while submitting the form.
Recent Publications
INSIDER
Report
5 Markets to Watch in 2026
Find out why Salt Lake City, Reno, Indianapolis, Raleigh, and Tampa are Placer.ai's markets to watch in 2026.
Placer Research
December 5, 2025
Article
Placer.ai November 2025 Office Index: Post-Pandemic Record Occupancy
Driven by stricter RTO mandates and a stabilizing "new normal," November 2025 marked the strongest November office occupancy rates we have seen since 2019.
Shira Petrack
December 11, 2025
3 minutes
Executive Insights
Dutch Bros vs. Dave’s Hot Chicken: The Veteran and the Rookie in America’s Restaurant Expansion Race
Explore how Dutch Bros and Dave’s Hot Chicken showcase two stages of restaurant growth, from explosive expansion to disciplined scaling and strategic maturity.
Kyle Inserra
December 10, 2025
3 minutes
The Anchor Logo
INSIDER
Stay Anchored: Subscribe to Insider & Unlock more Foot Traffic Insights
Gain insider insights with our in-depth analytics crafted by industry experts
— giving you the knowledge and edge to stay ahead.
Subscribe