


.svg)


From high prices to changing workplace attire (yes, soft pants are most definitely still a thing) – the fashion industry faced plenty of headwinds in 2023. But some segments, like off-price and thrift stores, reaped the benefits of trading down by consumers. And the category as a whole enjoyed a robust holiday season, helping to drive record holiday sales.
So with 2024 getting underway, we dove into the data to explore the evolving relationship between three major segments that comprise the fashion industry: non-off-price apparel chains, off-price retailers (such as T.J. Maxx, Marshalls, Ross Dress for Less, and Burlington), and thrift shops.* Which segment drew the most foot traffic in 2023? And how have the demographic profiles of visitors to the three sub-categories shifted in recent years?
*Analysis includes major thrift shop chains, including Goodwill, the Salvation Army, Buffalo Exchange, Plato’s Closet, and others.
Off-Price and Thrift Stores Gain Market Share
Last year saw an acceleration of the redistribution of foot traffic between non-off-price apparel retailers, off-price apparel chains, and thrift shops – a trend which began even before COVID. Back in 2017, non-off-price apparel stores accounted for just over 50% of visits to these three segments – but in the years since, the sub-category’s visit share dwindled to 38.9%. Over the same period, off–price-apparel chains grew their visit share by 8.1 percentage points, from 39.3% to 47.4%, and the share of visits to thrift shops increased by 3.2%.
.avif)
Apparel Affluence Gap Persists
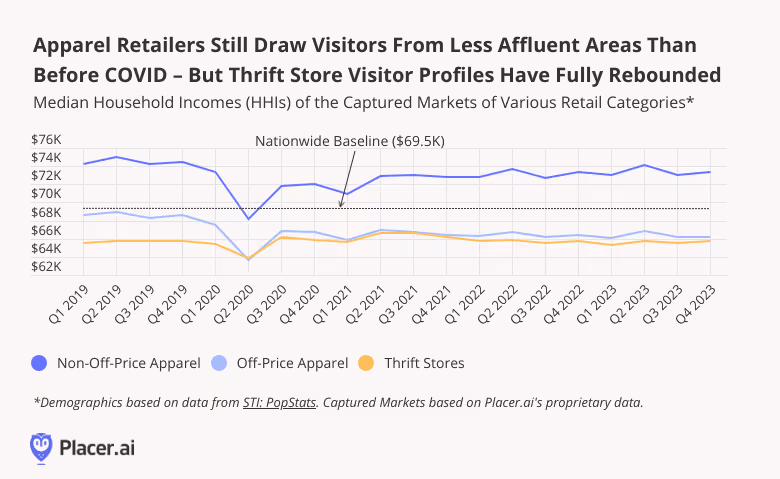
Unsurprisingly, non-off-price apparel chains have traditionally attracted more affluent consumers than either off-price retailers or thrift stores. And throughout the analyzed period, the captured market of non-off-price apparel retailers continued to feature a median household income (HHI) that was significantly higher than the nationwide baseline, while the captured markets of off-price chains and thrift stores featured median HHIs below the nationwide median.
But the three segments were impacted differently by shifts in consumer behavior in the wake of the pandemic. In early 2020, all three sub-categories experienced significant dips in the affluence of their captured markets. But while thrift shops saw an immediate HHI rebound, non-off-price apparel chains – and even more so off-price retailers – have yet to see the affluence of their visitor bases return to 2019 levels.
Thrifting is (Disproportionately) for Singles
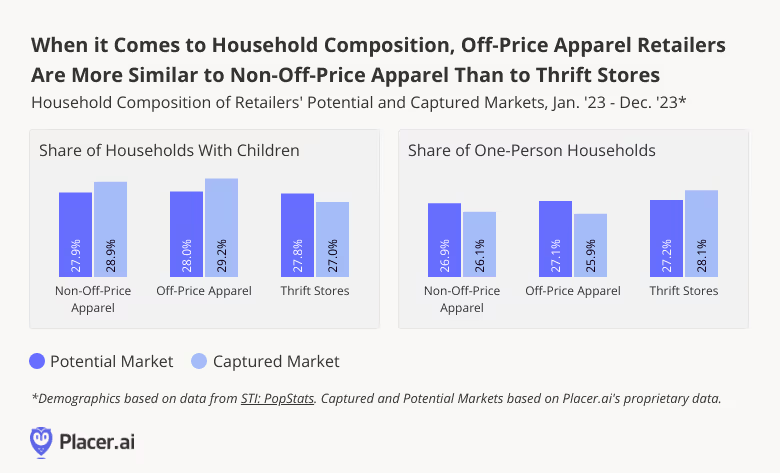
Foot traffic data also reveals an interesting divide in the household composition of visitors to the three segments: While the income profiles of off-price apparel shoppers are more akin to those of thrifters, their household composition is closer to that of visitors to non-off-price apparel stores.
The potential markets of all three categories, for example, featured similar shares of one-person households in 2023. But their captured markets were quite different – with singles over-represented for thrift stores, and under-represented for off-price and non-off-price apparel stores. This indicates that thrifters hail disproportionately from Census Block Groups (CBGs) that feature higher-than-average shares of one-person households. And visitors to off-price and non-off-price retailers come from the CBGs within the trade areas of these chains that feature smaller-than-expected concentrations of one-person households. Given the special appeal thrift shops carry for demographics like college students, it may come as no surprise that singles are among their best customers.
For families with children, on the other hand, more traditional apparel retailers hold sway: Visitors to off-price and non-off-price apparel stores were more likely to come from areas with higher concentrations of families with children in 2023, while thrifters were more likely to come from areas with smaller ones.
Key Takeaways
Economic headwinds and evolving consumer preferences have left their mark on the shifting relationship between different sub-categories within the fashion industry. But what does 2024 have in store for the sector? Will cooling inflation and rebounding consumer confidence lead to an increase in visit share for non-off-price favorites? And will more parental households make the pivot to thrift stores?
Follow Placer.ai’s data-driven retail analyses to find out.


.avif)


