.svg)


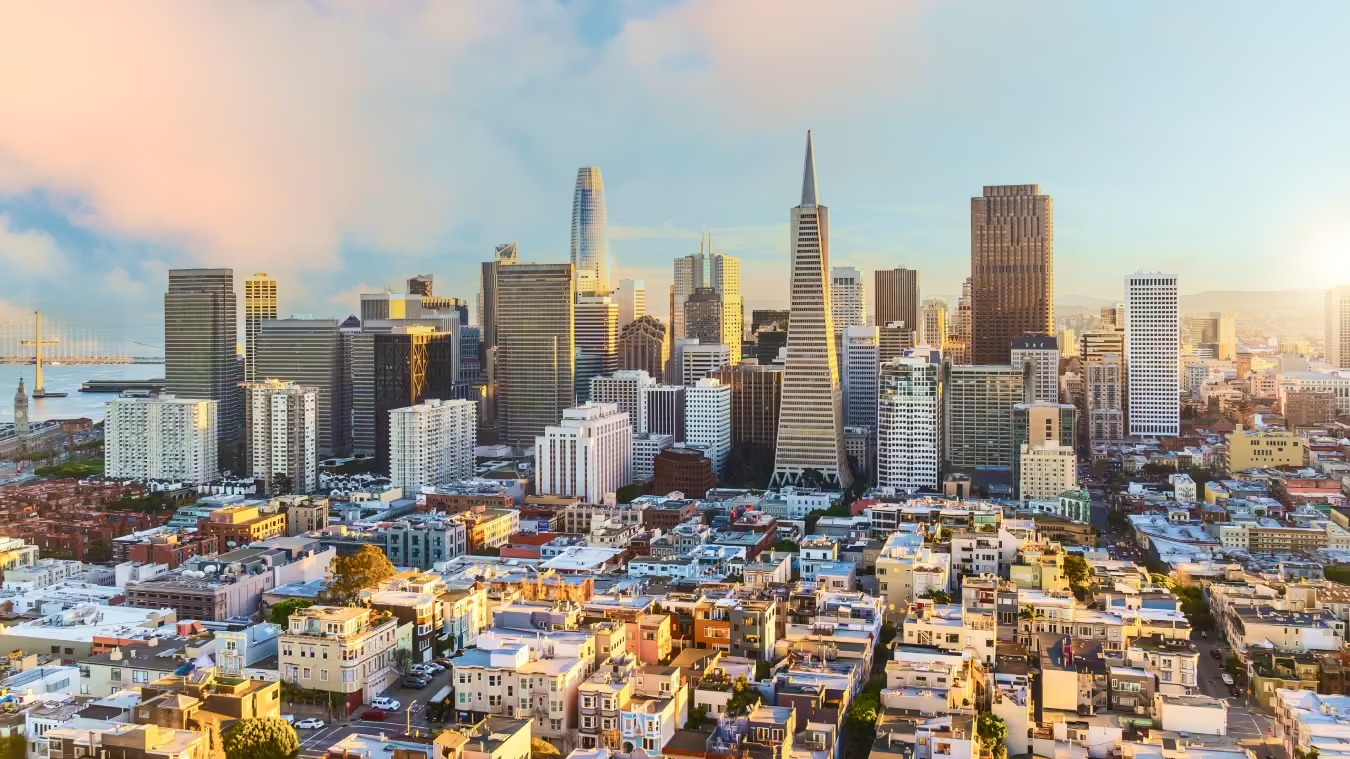


Super Bowl LX kicked off on Sunday, February 8th at Levi’s Stadium in Santa Clara, but celebrations across the Bay Area – from fan festivals and concerts to immersive cultural activations – began well before game day.
An AI-powered analysis of two marquee Super Bowl week events – the Ferry Building Projection Show and Chris Stapleton’s concert at the Bill Graham Civic Auditorium – highlights the role pre-game attractions played in extending the championship into a multi-day driver of regional foot traffic.
Ferry Building Projection Show
Between February 5th and 7th – the three nights leading up to the Super Bowl – San Francisco’s iconic Ferry Building became the canvas for a large-scale projection show celebrating 60 years of Super Bowl history. Comparing evening visits during the installation to the nightly average since January 1st, 2025 highlights the magnitude of the crowds drawn downtown for the spectacle.
The Ferry Building is no stranger to major surges in visitation tied to visual events. On July 4th, 2025, visits to the area were 217.5% above the daily average as fireworks lit up the Bay, while New Year’s Eve drove an even larger spike of 336.9%. Other recent activations – including a drone light show on October 8th and the multi-day “Let’s Glow SF” installation from December 5th to 14th – also generated noticeable visit increases.
But, the pre-Super Bowl Projection Show stood apart. Evening visits to the Ferry Building spiked by 141.6% on the first night of the installation and by 265.7% on the second. On the eve of the Super Bowl, February 7th, visits surged 479.1% above the nightly average, surpassing every other evening visit peak observed over the previous twelve months. This shows that the event was not only visually compelling, but also exceptionally effective at drawing crowds into the city core during Super Bowl week.
While the Ferry Building Projection Show was a major draw in its own right, many attendees treated it as just one stop on a broader evening itinerary.
Location intelligence shows that 18.2% of visitors to the projection show also made an evening visit to Moscone Center, home of the Super Bowl LX Experience between February 3rd and 7th. Other popular destinations included Pier 39, Ghirardelli Square, and the Fillmore Shopping District – all well-established tourist and retail corridors.
Regional indoor shopping centers also benefited from an influx of visitors. Serramonte Center and Stonestown Galleria ranked among the more common evening stops for projection show attendees, a pattern that could suggest travelers sought warm, indoor environments for dining and shopping after spending time along the waterfront.
Taken together, the data indicates that Super Bowl-themed activations drove visit spikes while generating spillover benefits for a diverse mix of retail, dining, and entertainment destinations across the Bay Area.
Chris Stapleton at the Bill Graham Civic Auditorium
Among Super Bowl week’s most anticipated and in-demand ticketed events was Chris Stapleton’s concert at the Bill Graham Civic Auditorium on February 7th.
With limited ticket availability and a premium price-tag, the concert drew a notably affluent audience. On the day of the show, households classified as “Ultra Wealthy Families” accounted for 45.5% of the venue’s captured market, compared to 23.5% across the prior twelve months. Similarly, households earning more than $175K represented 46.5% of the venue’s captured market on concert day, well above the 34.9% average observed over the previous year. These shifts demonstrate the robust demand for exclusive Super Bowl week experiences among higher-income music fans.
But affluence alone only tells part of the story. Using location intelligence to examine visitor journeys offers clearer insight into the concert’s audience – whether it skewed local or was bolstered by visiting Super Bowl guests.
Trade area analysis reveals that 36.6% of visitors to the Bill Graham Civic Auditorium on the day of the show traveled between 10 and 30 miles – a higher share than usual for the venue, indicating stronger representation from the extended Bay Area.
At the same time, the event also drew a meaningful influx of long-distance travelers. Visitors coming from more than 250 miles away accounted for 12.9% of concertgoers on February 7th, up from 8.0% over the previous twelve months. This increase suggests that many Super Bowl tourists incorporated the high-profile live show into their itineraries, reinforcing the role of major concerts as drivers of valuable traffic during destination sporting events.
Leveraging Headline Events for Broader Urban Impact
For civic leaders, major activations like these highlight how strategic programming can amplify the regional impact of tentpole sporting events – generating surges in visitation and meaningful spillover to retail corridors, entertainment districts, and shopping centers.
For more data-driven civic insights, visit placer.ai/anchor.
Placer.ai leverages a panel of tens of millions of devices and utilizes machine learning to make estimations for visits to locations across the US. The data is trusted by thousands of industry leaders who leverage Placer.ai for insights into foot traffic, demographic breakdowns, retail sale predictions, migration trends, site selection, and more.


.avif)
.avif)