
Thanks for Visiting!

Register for free to get the full story.

Sign Up
Already have a Placer.ai account? Log In
Article

Who Attends NCAA Final Four Events?

Who attended the NCAA Final Four Weekend? We dive into the foot traffic to find out.

By 
Ezra Carmel
April 16, 2024
Who Attends NCAA Final Four Events?
SHARE
Explore our free tools to get timely insights into key industries
Check out the latest trends for
No items found.
Key Takeaways
  • Every event on Final Four weekend attracted a different mix of out-of-town guests and locals.
  • The men’s championship had the largest share of high-income visitors, while free or nearly free events drove visits from lower-income fans. 
  • Singles constituted a greater share of visitors at women’s Final Four events than at men’s, reflecting the growing young fanbase of the women’s sport. 

Final Four weekend capped off the NCAA “March Madness” basketball tournaments with a full schedule of fan experiences on both the men’s and women’s sides of the ball. 

The Women’s Final Four took place between April 4th and 7th, 2024 in Cleveland, Ohio with on-court action at Rocket Mortgage FieldHouse. “Tourney Town” – an interactive basketball exhibition – ran concurrently at the Huntington Convention Center.  

The Men’s Final Four commenced on April 5th at State Farm Stadium in Glendale, Arizona, culminating with the championship game on April 8th. The multi-day exhibition “Final Four Fan Fest” took place at the Phoenix Convention Center. 

We dove into the location analytics and audience segmentation for visitors to several Final Four events to better understand the fans in attendance throughout the tournament weekend.

Locals and Tourists Have Event Preferences

The men and women’s Final Four weekend attracted spectators from near and far, with each event attracting a unique mix of out of town tourists and locals. 

Both men and women’s championship games attracted a relatively large share of out-of-town guests, likely due to the excitement surrounding a national title game. Analysis of visitors by home location revealed that the men and women’s championship games had the smallest share of visitors from less than 100 miles away – 29.8% and 33.3% respectively. In other words, these two events had the largest share of visitors that lived more than 100 miles from the venues. 

The men’s open practice appeared to be more popular with long-distance travelers than the women’s, perhaps because all four men’s teams participated – as opposed to just two at the women’s open practice. The men’s practice was also followed by an all-star game which likely increased its appeal for visitors traveling from afar in the hopes of spotting their favorite players. The data revealed that more than half of the spectators traveled over 250 miles to watch the men’s practice, as opposed to under a quarter of spectators for the women’s practice. 

Meanwhile, the women’s experiential exhibition at Huntington Convention Center drew more out-of-towners than the men’s exhibition at Phoenix Convention Center – only 23.3% of visitors to the women’s exhibition came from under 30 miles away, compared to almost half (48.3%) of the men’s exhibition visitors. The larger share of out-of-town visitors to the women’s exhibition may be because the event was close to the arena, making it a more convenient stop for non-local fans. On the other hand, the distance between the men’s exhibition in downtown Phoenix and the stadium in Glendale meant that the off-court experience was more out-of-the-way for tourists who had traveled specifically for the on-court action.

2024 Final four events - cumulative percentage of visitors by home location showing a mix of locals and out-of-town visitors

Wealthy Fans Dominate the Men’s Game

Analysis of Final Four visitors by income level provides further insight into the differences between each event’s fan base. According to the STI: Popstats dataset, the women’s events generally drew visitors from areas with a lower median household income (HHI) compared to the men’s events, although the gaps between the men and women’s visitor bases varied from event to event. Some of the difference in trade area HHI may be due to regional variance and the mix of locals and tourists at each event.

The visitor bases of the men and women’s championship games exhibited the widest disparity, with the men’s championship spectator base coming from areas with a median HHI of $99.9K, compared to $74.6K for the women’s championship’s trade area. The difference may be due to the relatively higher face value of tickets to the men’s championship game – even though the star-power of Iowa’s Caitlin Clark drove up the price of women’s tickets on the secondary market. In contrast, both the men’s and women’s practices and exhibitions were free or nearly free events and drove traffic from relatively lower-income areas – even though visitors to the men’s practice still came from more affluent areas than the trade area of the women’s championship match.

Visitors to the men and women’s convention center exhibition displayed the smallest income differences, with respective trade area median HHI of $80.0K and $76.6K. The data also reveals that visitors to the women’s exhibition came from a trade area with a median HHI that was higher than the median HHI for both the championship game and the open practice, perhaps because the exhibition drew a relatively large share of tourists who could afford to be in town for a slightly longer stay.

Final four men's championship game attracted high-income visitors

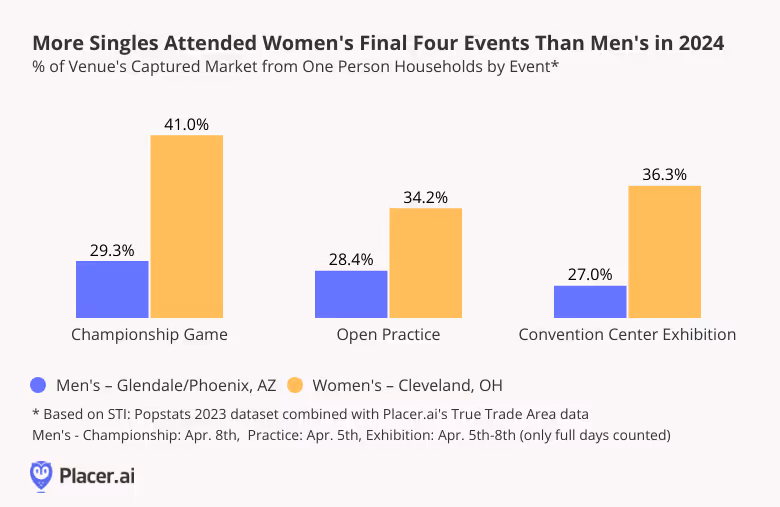
Single Fans En Masse at Women’s Events

Further demographic analysis indicates that a greater share of singles – who tend to be on the younger side – attended the women’s Final Four events than the men’s. During the women’s championship, 41.0% of households in the trade area of the Rocket Mortgage FieldHouse were made up of one-person households. This segment also made up 34.2% and 36.3% of the households in the trade areas of the venues for the women’s practice and exhibition, respectively. On the men’s side, singles comprised just 29.3% of the championship’s trade area, 28.4% of the practice’s, and 27.0% of the exhibition’s.

This reflects the growing popularity of women’s college basketball players on social media which is bringing more viewership to the sport.

More singles attended women's final four events than men's in 2024

Want more data-driven visitor insights for sporting events? Visit Placer.ai.

This blog includes data from Placer.ai Data Version 2.0, which implements improvements to our extrapolation capabilities, adds short visit monitoring, and enhances visit detection.

Learn how downtown regions across US cities are measuring up with our free tools.
Check out the latest trends for
No items found.

Related Topics

Stay Anchored: Subscribe to Insider & Unlock more  Insights
Subscribe
SHARE
Get 3 brand & industry
breakdowns every week
Subscribe to the newsletter
Oops! Something went wrong while submitting the form.
Recent Publications
INSIDER
Report
Retail Trends to Watch in 2026
Explore how value, luxury, and authenticity will define 2026 retail — and how brands are winning across digital, dining, and suburban markets.
Placer Research
November 14, 2025
Article
Will Upscale Dining Lead the Holiday Season Again?
Holiday dining patterns highlight upscale and fine-dining restaurants as the strongest seasonal performers, with coffee, casual dining, and eatertainment showing targeted lifts. Emerging YoY trends point to premium full-service concepts leading demand again this December.
Bracha Arnold & Lila Margalit
December 4, 2025
4 minutes
Article
Did Fewer Franchise Films Limit Thanksgiving’s Movie Theater Lift?
Thanksgiving brought a healthy rise in movie theater traffic while still trailing 2024’s exceptional highs. The gap points to a growing reality in the theatrical space: In 2025, audiences show up strongest when franchises – and preferably, multiple franchises at once – lead the way.
Shira Petrack
December 3, 2025
3 minutes
INSIDER
Stay Anchored: Subscribe to Insider & Unlock more Foot Traffic Insights
Gain insider insights with our in-depth analytics crafted by industry experts
— giving you the knowledge and edge to stay ahead.
Subscribe
Is lululemon Poised for a Holiday Rebound?
Placer.ai November 2025 Mall Index: Early Strength Offsets a Softer Black Friday
Four Black Friday Signals for the 2025 Holiday Season 
Will Upscale Dining Lead the Holiday Season Again?
Did Fewer Franchise Films Limit Thanksgiving’s Movie Theater Lift?
Darden Heads Into Holiday Season With Strong Visit Trends
How Did Grocery Stores Perform This Turkey Wednesday?
Short Visits Surge as Kroger Bets on Store-Based Fulfillment
How Do Holiday Shopping Patterns Differ for Off-Price and Traditional Apparel?
Dollar Tree and Dollar General Thrive Amid Inflation Fatigue
DICK's Sporting Goods Riding Positive Visit Trend into the Holidays
October 2025 Placer.ai Office Index: Continued Momentum
Red Cup Day 2025 Outperforms Last Year With Bigger Crowds Than Bearista
Gap and Urban Outfitters See Visit Increases in Q3
Back to the Future of Retail: Why Technology Is Bringing Us Full Circle
Department Stores Ahead of the Holidays 
Superstores and Warehouse Clubs Find Early Holiday Momentum
Lowe’s and The Home Depot See the Future of Home Improvement in the Next Generation
TJX, Burlington, and Ross Gear Up for a Blockbuster Holiday Season
Is Turkey Wednesday the Only Big Day for Grocers?
Placer.ai October 2025 Mall Index: Shoppers Return to Malls
How Starbucks Proved That Free Isn’t Everything
Denny’s Goes Private: What’s Next for America’s Diner
Three Retailers to Watch Ahead of the Holidays
Serving Those Who Served: How Restaurants Honor Veterans Day
High-Street Retail Poised for Another Holiday Rush
Offline Growth Drives Engagement for Warby Parker
Grocery Outlet Bargain Market & WinCo Still Thriving Amidst Inflation Fatigue
Does CAVA Still Have Growth Potential?
Catching Up With 2021’s Dining IPOs
Wendy’s Bets on Fewer, Bigger Deals in Q3 2025
Yum! & RBI: QSR in Q3 2025
Shake Shack & Wingstop: Navigating Q3 Waters
Sips Of Success: Coffee in Q3 2025
Texas Roadhouse and Chili’s: Strong Q3 Traffic and a Secret Sauce of High-Income Diners
October Promotions Aimed to Capture Demand From Value-Seeking Consumers In-Store and Online
Retail Outlook: A Tale of Two Consumers Heading into Holiday 2025
McDonald’s and Chipotle Face Headwinds in Q3 2025
Manufacturing Foot Traffic Signals Continued Caution
September 2025 Placer.ai Office Index: A Fall Resurgence
Placer.ai September 2025 Mall Index: Summer Slowdown Extends Into Fall
Summer Surge for Sturgis as Motorcycles Vroom En Masse
K-Beauty & Personalization Drive Beauty Traffic 
All the Things I Think I Think About Retail Over the Last Quarter: Amazon, Walmart & Why the Box May Soon Be on the Other Porch
The Geography of BevAlc Retail Growth
The Comeback Blueprint for Kirkland’s and Bed Bath & Beyond
Distinct Playbooks Driving Growth in Premium Home Retail
Do QSR Value Promotions Still Resonate With Consumers?
Who’s Losing Grocery Share to Dollar General – and What Consumer Habit Is Driving Its Growth?
Exploring Barnes & Noble’s Recent Acquisitions 
3 Factors Driving Dillard’s Department Store Success
Expansion Into New Categories Signals Shift for Gap Inc. 
Beauty and Fitness Foot Traffic: From Post-Pandemic Correction to New Normal
Hobby Lobby and Michaels Defy Discretionary Spending Headwinds
Black Rock Coffee's Post-IPO Growth Potential  
How Asian Grocers Are Redefining the Grocery Experience
Affluent Shoppers Sustain Luxury, But Growth Potential May Be Limited
Costco Early Openings Reshape Store Traffic Patterns
Q2 2025 Restaurant Recap: A Cautious Consumer Shapes Dining Trends 
Is Costco’s Momentum Built to Last?
The US Open: A Comparison of Visitors to Fan Week and the Main Draw
Republic Square’s Summer Programming Proves to be a Hit
Darden Restaurants’ Portfolio Powers Through Consumer Headwinds
Are Cracks in Consumer Resilience Beginning to Show? 
Placer.ai Manufacturing Index: Traffic Dips in August
Will Delayed Car Purchases Fuel a Surge in Aftermarket Maintenance?
August 2025 Placer.ai Office Index: An End-of-Summer Slump? 
What Are the Fast-Growing QSR Categories in 2025?
Placer.ai August 2025 Mall Index: Is Consumer Caution Weighing on Mall Performance? 
Subscriptions Drive Eatertainment Visits for Topgolf, Dave & Buster’s, and Chuck E. Cheese 
Has Starbucks' Pumpkin Spice Latte Retained Its Appeal in 2025? 
Thrift Store Visit Growth Outpaces Apparel as Tariffs Loom
America’s Parks Are Calling: Later, Longer, Busier
How Economic Realities Are Redefining Vegas Tourism
Nordstrom Anniversary Sale: An Event that Continues to Find Success Amid Reinvention
Manufacturing Visits Drop Post-Tariff Implementation
Semi-Annual Sale Drives Visit Surge For Bath & Body Works 
Ulta's Post-Target Future Looks Strong
Where Can Dollar General & Dollar Tree Still Expand? 
Five Below & Ollie's Traffic Signals Growth for Value Retail
Gap Inc. Q2 2025: Old Navy Leads Foot Traffic Gains as Middle-Income Shoppers Return
Best Buy H1 2025 Traffic Data Suggests a Recovery Is Underway
How Athletic Retailers are Weathering the Storm in Q2 2025. 
Expansions Drive Visit Gains for Wholesale Clubs
Discretionary Slowdown Impacts Kohl's & Macy's Mid-Market Brands
Value-Driven Shoppers Still Fueling Off-Price Growth at Burlington, Ross, & Citi Trends
Home Depot & Lowe's: Navigating Challenges & Finding Growth in 2025
Lollapalooza Supercharges Summer Tourism in Chicago
What Walmart and Target's Q2 2025 Traffic Reveals About Future Performance
TJX Q2 2025 Visit Data Points to Strong Performance
The Summer Slowdown: Why Consumers Are Pumping the Brakes on Travel
Placer.ai Office Index: July 2025
Placer.ai Mall Index: July 2025
Retail’s Balancing Act: What the First Half of 2025 Reveals About Evolving Consumer Priorities
Din Tai Fung: Sky High Average-Unit-Volume is a Recipe for Success
Bracing for Impact: July's Manufacturing Surge Reveals Tariff Anxiety
How EAT, TXRH & BLMN Are Navigating the Q2 2025 Dining Market
Life Time & Planet Fitness Q2 2025 Visit Recap
Growth vs. Optimization: A Q2 2025 Analysis of First Watch, Denny's, & Dine Brands
Scaling Fast-Casual: CAVA's Depth vs. Sweetgreen's Breadth in Q2 2025