


.svg)


.avif)
An Urban Bellwether
From Michigan Avenue to Main Street, retail corridors have long served as a barometer of urban vitality – and their post-pandemic trajectory has become one of the most closely watched storylines in retail real estate. We dove into the data to see how these districts are faring in 2026, and what AI-powered location analytics reveal about when, and why, people are showing up.
The Corridor Recovery Takes a Breather
After several years of gradual improvement, the post-pandemic retail corridor recovery stalled in early 2026. Visits remained 12.6% below 2019 levels in Q1 and 12.5% below in Q2, reversing some of the gains made during 2025, when the Q2 gap had narrowed to just 9.5%. The slowdown coincided with a broader cooling in consumer demand, with shoppers growing more selective and trimming discretionary purchases.
Friday and Saturday Nights Are Back
So what's behind the widening recovery gap, and where are the bright spots?
Comparing Q2 2026 visits with Q2 2019 by daypart shows that the largest remaining recovery deficit is concentrated during weekday mornings and afternoons, with Monday through Friday visits between 8 AM and 4 PM still running 20% to 30% below pre-pandemic levels. That pattern closely mirrors office attendance trends, which remained roughly 30% below pre-pandemic levels this spring. With fewer commuters flowing through downtowns, the coffee runs, lunch breaks, and midday errands that once sustained corridor traffic have yet to fully return.
The pattern, however, is markedly different on weekends. Visit gaps on Saturday and Sunday mornings were significantly smaller and narrowed throughout the day before disappearing entirely by evening. Friday visits between 8 PM and 12 AM exceeded Q2 2019 levels by 2.0%, while Saturday evening visits came in 0.7% above the pre-pandemic benchmark.
In other words, while remote work continues to reshape weekday routines and consumers scale back daytime shopping, retail corridors remain compelling destinations for entertainment, socializing, and dining. The trend aligns with broader consumer spending patterns showing that even budget-conscious households continue to prioritize experiences over goods. It also reflects what's happening on the ground in downtowns nationwide, where restaurants are driving retail leasing activity and cities are increasingly investing in programming that attracts visitors after hours.
Evening Momentum Continues YoY
Year-over-year data also shows that even though the recovery has stalled, evenings continue to gain momentum. Although overall retail corridor visits fell 3.3% in Q2 2026, nighttime visitation increased across the week. Weekend mornings also proved relatively resilient, while midday shopping hours (12 PM to 4 PM) posted the steepest declines.
At the same time, average dwell time rose from 118.0 minutes in Q2 2025 to 123.0 minutes in Q2 2026. So while fewer people may be visiting retail corridors overall, those who do visit appear to be staying longer than they did last year – a sign that corridors are increasingly serving as destinations in their own right.
The Night Shift
Retail corridors may still be waiting on the office worker, but they are increasingly winning the off-the-clock hours. As daytime shopping softens, evenings have become the corridors' engine of growth – especially on Fridays and Saturdays – powered by diners, barhoppers, and experience-seekers who keep showing up even as they tighten their belts elsewhere. For retailers, restaurants, property owners, and civic stakeholders, the evening and weekend windows look like the clearest growth opportunities of 2026.
Will nighttime visitation continue gaining momentum in the second half of the year? Or will office recovery finally spark a weekday daytime comeback? Visit placer.ai/anchor to find out.

The U.S. matches of the FIFA World Cup kicked off at Los Angeles Stadium (aka SoFi Stadium) in Inglewood, CA, on June 12, 2026 with the highly-anticipated USA vs. Paraguay matchup and a star-studded opening ceremony.
Across the Los Angeles area, watch parties and fan activations drew supporters eager to take part in the matchday atmosphere. Among them was the City of Inglewood's “The Wood Cup”, a street festival just a short walk from the stadium itself, which Inglewood Mayor James Butts called “a free alternative to attending the very expensive World Cup soccer match in person”.
With just a few city blocks separating the two events, we examined how their audiences of U.S-based fans differed and how this multi-layered engagement translated into broader economic benefits for the surrounding community.
The Opening Match Drew an Affluent Audience
Audience segmentation reveals that visitors to The World Cup U.S. opener skewed more affluent than visitors to The Wood Cup festival – a finding that aligns with the premium cost of attending a globally significant sporting event. According to Spatial.ai’s PersonaLive dataset, Ultra Wealthy Families represented the largest audience segment at the stadium, accounting for nearly 30% of visitors – a share on par with recent Super Bowls. As the tournament progresses to later-stage matches with even greater demand, this trend could become even more pronounced.
Meanwhile, The Wood Cup street festival attracted a more diverse and less wealthy visitor base. Near-Urban Diverse Families made up the largest share of attendees by a wide margin, while City Hopefuls – lower-income urban households – also accounted for a significant portion of festival visitors.
The Nearby Street Festival Was Dominated by Locals
Diving deeper into visitor travel patterns provides further insight into the stadium versus street festival audiences. Location intelligence shows that many stadium visitors came from throughout Southern California and beyond, while the street festival appears to have functioned as a primarily local gathering. The stadium saw a significantly larger share of visitors traveling more than 10 miles, with more than a third traveling over 250 miles, underscoring the event's broader regional draw and national appeal. On the other hand, nearly 70% of street festival attendees traveled less than 10 miles, highlighting the neighborhood orientation of the event.
This contrast reinforces the role of fan activations alongside major sporting events. While the stadium attracted affluent visitors who traveled significant distances, the street festival engaged a highly local audience unlikely to attend the match itself – playing an important role in broadening participation and capitalizing on World Cup excitement across the host city.
Matchday Festivities Delivered a Major Boost to Nearby Dining
One of the clearest ways that broad participation in a major sporting event benefits host communities is by driving traffic to nearby businesses from travelers and locals alike.
On the day of the 2026 World Cup U.S. opener, several restaurants near Los Angeles Stadium and The Wood Cup festival experienced visit boosts far exceeding typical levels. The Pollo Campero location on W. Century Boulevard experienced the largest foot traffic increase among the restaurants analyzed, with visits spiking 264.0% compared to the average Friday – a surge that may have been aided by the chain's World Cup-themed "Pollito Campeón" campaign. Other nearby establishments also posted significant gains, including Sizzler (+185.9%), Carl's Jr. (+128.9%), and El Pollo Loco (+105.3%).
These foot traffic gains illustrate the ripple effects of major sporting events and adjacent fan activations beyond the stadium and festival grounds.
A Blueprint for Host City Engagement
The World Cup’s opening match in the U.S. transformed Los Angeles into a hub of activity both inside and outside the stadium, creating pathways for fans of all types to participate in the event and driving significant traffic to nearby businesses. With additional fan zones planned across multiple host cities – and demand rising as the stakes increase – The World Cup’s impact could continue to grow.
For more data-driven event insights, visit Placer.ai/anchor.
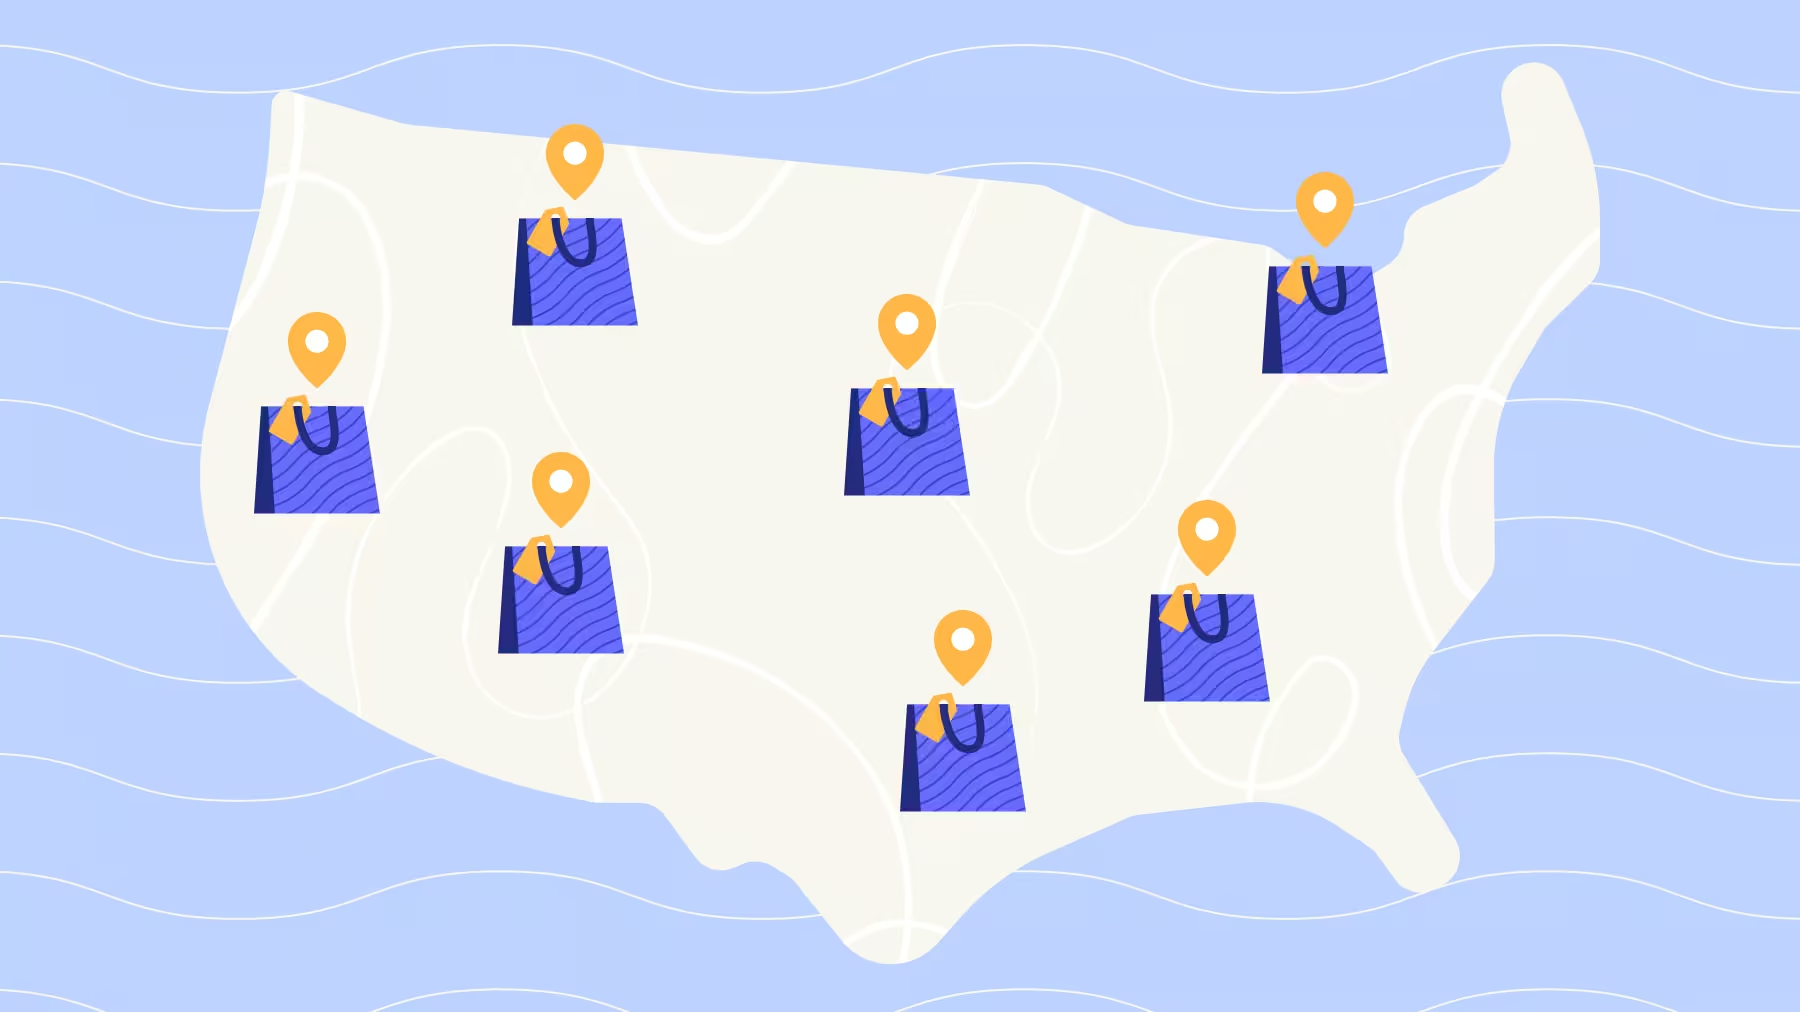
On a national level, retail foot traffic held notably steady in May 2026. However, even relatively small fluctuations at the state level tell a story of two external pressures – a sharp run-up at the pump and a destructive mid-May storm outbreak – shaping consumer behavior.
Traffic Reflects a Cautious Consumer
The chart below shows year-over-year (YoY) visits to overall retail by state in May 2026. And while performance varied somewhat by state,all changes remained within the narrow range of ±2 percentage points. Nationwide, overall retail sat relatively flat at 0.3% YoY – stability that suggests that consumers are closely managing their budgets amid a challenging economic backdrop.
Still, even modest year-over-year swings in foot traffic highlight the influence of two state-level pressures: ongoing gas price increases and adverse weather conditions.
Retail Traffic and the Path of Fuel Inflation
Gas prices continued to climb sharply in May 2026, and the map above suggests a relationship between YoY price hikes at the pump and retail visitation patterns. Regions that experienced the largest YoY increases in gas prices, such as the Midwest and Ohio – where prices climbed by over 45% and 50%, respectively – were often those that saw retail foot traffic soften. This could at least partly reflect consumers adjusting their spending to offset higher fuel costs.
Meanwhile, the regions with the lowest average gas price, the Gulf Coast and Lower Atlantic, or the West Coast – which experienced the smallest YoY price increase of (only) about 30% – for the most part posted positive YoY retail foot traffic. This trend held even as average gas prices along the West Coast reached over $5.5 per gallon – the highest in the country – suggesting that changes in gas prices had a greater impact on consumer traffic patterns than the absolute price level itself.
Severe Weather Weighed on Consumer Mobility
But fuel costs were only part of the retail foot traffic story in May 2026. Across the Midwest and parts of the Mid-Atlantic, a multi-day severe weather outbreak brought tornadoes, large hail, and flash flooding to the region. The same weather system also contributed to wildfire activity across southwestern Kansas and parts of Colorado, Oklahoma, and the Texas Panhandle.
As the map above shows, the band of declining retail visits running through the Midwest, Ohio Valley, and Mid-Atlantic – closely tracking the path of these storms. This alignment suggests that severe weather amplified existing economic headwinds and gas price sensitivity, limiting consumer movement in affected markets.
May In a Nutshell
May's retail traffic patterns suggest overall consumer caution with regional nuance influenced by varying degrees of gas price pressures and local weather events.
What will retail foot traffic look like in the weeks ahead? Visit Placer.ai/anchor to find out.
Like so many tourism hot spots, the pandemic brought visitation to Las Vegas to a near halt. Since then, the city has invested heavily in several new entertainment and sports venues – redefining Las Vegas for the post-pandemic era.
Yet standing in the way of Las Vegas’ next tourism boom is a growing challenge: affordability. For many travelers, a Vegas getaway has become increasingly out of reach, starting with the rising cost of staying on the iconic Strip. But the Strip itself may also hold the solution. AI-powered location intelligence suggests that activations designed to bring visitors directly to the corridor can boost foot traffic and attract mainstream audiences, reinforcing the Strip’s role as a central tourism engine.
A New Normal, Post-Pandemic
After a brief foot traffic recovery in 2021 and 2022, visits to the Strip have remained below pre-pandemic levels. But since last year, the traffic decline appears to have tapered off– signaling a fresh baseline upon which visitation can build in the months and years ahead.
Events Still Drive Major Traffic Boosts
While the Strip's overall foot traffic has stabilized, major pop culture moments continue to drive meaningful spikes in visitation. Across a range of major events in 2026, out-of-market traffic jumped significantly above the same-day-of-week average.
The recent BTS ARIRANG World Tour was a tourism powerhouse, as the city rolled out weeks-long activations that drove traffic beyond the performance venue and onto the Strip itself. Similarly, the EDC World Party Parade, Bruno Mars Day, and the NASCAR Cup Series Hauler Parade all served as prime examples of broader venue-based events with an on-Strip element that ignited foot traffic – a formula that could be key to Las Vegas’s next chapter of tourism growth.
Leveraging Mainstream Audiences
Diving into the demographics of Strip visitors highlights why boosting these event-based audiences could be critical.
Since the pre-pandemic period, the Strip's everyday visitor base has become notably more affluent – likely in part due to rising costs at hotels and resorts. In January through May of 2019, the median household income (HHI) of Strip visitors was $93.2K, compared to $101.1K during the same window in 2026.
However, on nearly all of the event days analyzed – with the exception of Bruno Mars Day – the Strip’s median HHI declined, in several cases pulling back toward 2019 levels. The EDC World Party Parade drew a median HHI of $94.7K, and on BTS concert days, the median HHI on the Strip ranged from $95.9K to $97.4K.
This shows that events driving traffic to the Strip are attracting audiences that more closely reflect the broad, mass-market appeal on which Las Vegas built its identity. By attracting a broader cross-section of visitors, widely accessible on-Strip events could help rekindle both the scale and diversity of visitation that characterized the city before the pandemic.
Turning Events Into Long-Term Momentum
Las Vegas has invested heavily in new sports and entertainment venues. But as the city enters its next era of tourism, maximizing the role of the Strip could be key to driving visitation, engagement, and economic activity.
For more data-driven civic storylines, visit Placer.ai/anchor.
Retail Corridors Face Macroeconomic Headwinds
Retail corridors – with their orientation towards apparel flagships, aspirational brands, and dining – have not been immune to the macroeconomic pressures weighing on discretionary retail. Declining consumer sentiment and tariff uncertainty appear to have impacted visits, which decreased year-over-year (YoY) most months since September 2025. And after a relatively resilient January and February, three of the steepest YoY visit gaps of the past year came in March, April, and May 2026, as rising fuel prices added another layer of financial pressure to household budgets.
A Rapid Shift in Consumer Behavior
Zooming in on monthly visit duration provides further evidence that economic headwinds – and pressure at the pump in particular – are having a meaningful impact on retail corridor traffic as the year progresses.
In January and February 2026, visits of less than 30 minutes decined compared to 2025 while visits of 30 minutes or more increased. This could reflect ongoing cost-of-living concerns – with consumers shopping more deliberately, checking prices, and taking longer to decide. In addition, consumers continue to prioritize elevated retail experiences and third-places, which can be cost-effective forms of recreation while encouraging longer dwell times. These factors likely helped fuel growth in extended visits while supporting overall traffic resilience for the first two months of the year.
But since March 2026, economic uncertainty has been compounded by rising fuel prices – perhaps making driving downtown less appealing to some. As a likely consequence, visits under 30 minutes dipped further, and visits of over 30 minutes flattened or declined outright, indicating that retail corridors are seeing an overall contraction of the discretionary-oriented activity they typically depend on.
To be sure, extended visits are still the norm. The average visit to retail corridors remained above two hours throughout the first five months of 2026, as they remain ideal destinations for discovery and leisure time. That strength, alongside incremental improvements in the longest visit buckets could signal an overall visit resurgence in the months ahead.
What It Means for Downtown Retail
Retail corridor visitation trends show that consumer behavior can shift quickly in response to macroeconomic conditions. While early 2026 showed signs of more intentional, third-place style visits, the current fuel price spike appears to be putting a damper on mid-to-extended length trips. For retailers and civic stakeholders, resilience may depend on enhancing the consumer experience, in-store and along the corridor, giving consumers a reason to visit – and stay a while.
For more data-driven retail insights, visit placer.ai/anchor.
%20(1).avif)
The broader restaurant industry continues to navigate a challenging economic environment, and rising gas prices have made value perception an even more important factor for consumers in determining where – and how – they choose to eat. With fuel costs remaining elevated throughout May 2026, we turned to the latest Placer.ai Dining Index data to assess how different dining segments performed and whether these emerging trends continued to gain momentum.
QSR Faces Growing Pressure as Fast Casual and Full Service Hold Steady
Dining traffic in May 2026 painted a mixed picture for the restaurant industry. Visits to full-service chains rose year-over-year (YoY) after two consecutive months of declines, likely benefiting from both Mother's Day and a favorable calendar shift. May 2026 included five Sundays compared to four in May 2025 – a subtle but meaningful tailwind for sit-down dining. The rebound suggests that even amid a challenging economic backdrop, consumers remain willing to spend on special occasions.
At the same time, pressure continued to build in the more value-oriented dining segments. QSR visit declines widened YoY, while fast-casual traffic growth slowed. Together, these trends provide additional evidence that persistent inflation and tighter household budgets are weighing on consumer behavior – particularly among the typically value-conscious audiences of QSR and fast casual chains.
Consumers Pump the Brakes on Drive-Thru
Some of the weakness in QSR traffic – and even the slowdown in fast casual growth – may be tied to shifting consumer preferences around drive-thru usage and other convenience-based ordering channels
Location intelligence reveals that sub-10-minute visits to the two limited-service segments have underperformed compared to overall visits for several months. And in May 2026, short visits to QSR chains fell sharply YoY, while short visits to fast casual chains also decreased – their first such decline of 2026. The drop in visits under 10 minutes to both segments – a duration typically associated with drive-thru, but also pickup, and delivery orders – suggests that diners are not only looking to reduce fuel consumption but are increasingly prioritizing the experience of dining out over the convenience of picking up food to go.
With summer travel season around the corner and some modest relief at the pump beginning to emerge, drive-thru traffic, for its part, could shift into a higher gear in the weeks and months ahead.
The Road Ahead for Restaurants
May's dining data highlights a growing divide within the restaurant industry. While consumers continue to make room for special-occasion dining, value-oriented segments face mounting challenges as economic pressures persist. And with short-duration visits declining across both QSR and fast casual chains, elevated fuel costs may be reshaping how consumers approach their favorite chains.
For the latest dining insights, visit Placer.ai/anchor.
Digging Into Dining
The dining industry showcased its agility over the past couple of years as it rapidly adapted to shifts in consumer preference brought on by COVID and rising prices. And with a new year around the corner, the pace of change shows no signs of slowing down.
This white paper harnesses location analytics, including visitation patterns, demographic data, and psychographic insights, to explore the trends that will shape the dining space in 2024. Which dining segments are likely to pull ahead of the pack? How are chains responding to changes in visitor behavior? And where are brands driving dining foot traffic by taking advantage of a new advertising possibility? Read on to find out how dining leaders can tap into emerging trends to stay ahead of the competition in 2024.
Stepping Up To The Plate
Comparing quarterly visits in 2023 and 2022 highlights the impact of the ongoing economic headwinds on the dining industry. The year started off strong, with year-over-year (YoY) dining visits up overall in Q1 2023 – perhaps aided by the comparison to an Omicron-impacted muted Q1 2022. And while overall dining growth stalled in Q2 2023, several segments – including QSR, Fast Casual, and Coffee – continued posting YoY visit increases, likely bolstered by consumers trading down from pricier full-service concepts.
Foot traffic slowed significantly in Q3 2023 as inflation and tighter consumer budgets constrained discretionary spending. Overall dining visits fell 2.4% YoY, and full-service restaurants – with their relatively high price point compared to other dining segments – seemed to be particularly impacted by the wider economic outlook. But the data also revealed some bright spots: Fast Casual still succeeded in maintaining positive YoY visit numbers and Coffee saw its Q3 visit grow an impressive 5.4% YoY. As the return to office continues, a pre-work coffee run or lunchtime foray to a fast-casual chain may continue propelling the two segments forward.
Shifting Demographics and Shifting Dining Behavior
Restaurant visitation patterns have evolved over the past few years. Although an 8 PM seating was once the most coveted slot at fine-dining restaurants, recent visitation data suggests that sitting down to dinner earlier is rising in popularity.
But among the QSR segment, the opposite trend is emerging, with late-night visits rising. Analyzing hourly foot traffic to several major QSR chains reveals that the share of visits between 9 PM and 12 AM increased significantly between Q3 2019 and Q3 2023. Even Taco Bell – already known for its popularity among the late-night crowd – saw a substantial increase in late-night visits YoY – from 15.4% to 20.3%.
Younger Customers Staying Out Later
Who is driving the late night visit surge? One reason restaurants have been expanding their opening hours is to capture more Gen-Z diners, who tend to seek out nighttime dining options. But location intelligence reveals that younger millennials are also taking advantage of the later QSR closing times.
An analysis of the captured market for trade areas of top locations within one of Taco Bell’s major markets – the Chicago-Naperville-Elgin, IL-IN-WI Metropolitan area – reveals a year-over-four-year (Yo4Y) increase in “Singles & Starters.” The “Singles & Starters” segment is defined by Experian: Mosaic as young singles and starter families living in cities who are typically between 25 and 30 years old. As consumers continue to prioritize experiential entertainment and going out with friends, late-night dining may continue to see increased interest from young city-dwellers.
Smoothies Drive Weekend Visits
Millennials and Gen-Z consumers aren’t only heading to their favorite fast food joint for a late-night bite – these audience segments are also helping drive visits on the weekends. Smoothie King is one chain feeling the benefits of young, health-conscious consumers.
The chain, which opened in New Orleans, LA, in 1973 as a health food store, has since grown to over 1,100 locations nationwide and is currently expanding, focusing on the Dallas-Fort Worth CBSA. The area’s Smoothie King venues have seen strong visitation patterns, particularly on the weekends – weekend visits were up 3.4% YoY in Q3 2023. The smoothie brand’s trade areas in the greater Dallas region is also seeing a YoY increase in weekend visits from “Young Professionals” – defined by the Spatial.ai PersonaLive dataset as “well-educated young professionals starting their careers in white-collar or technical jobs.”
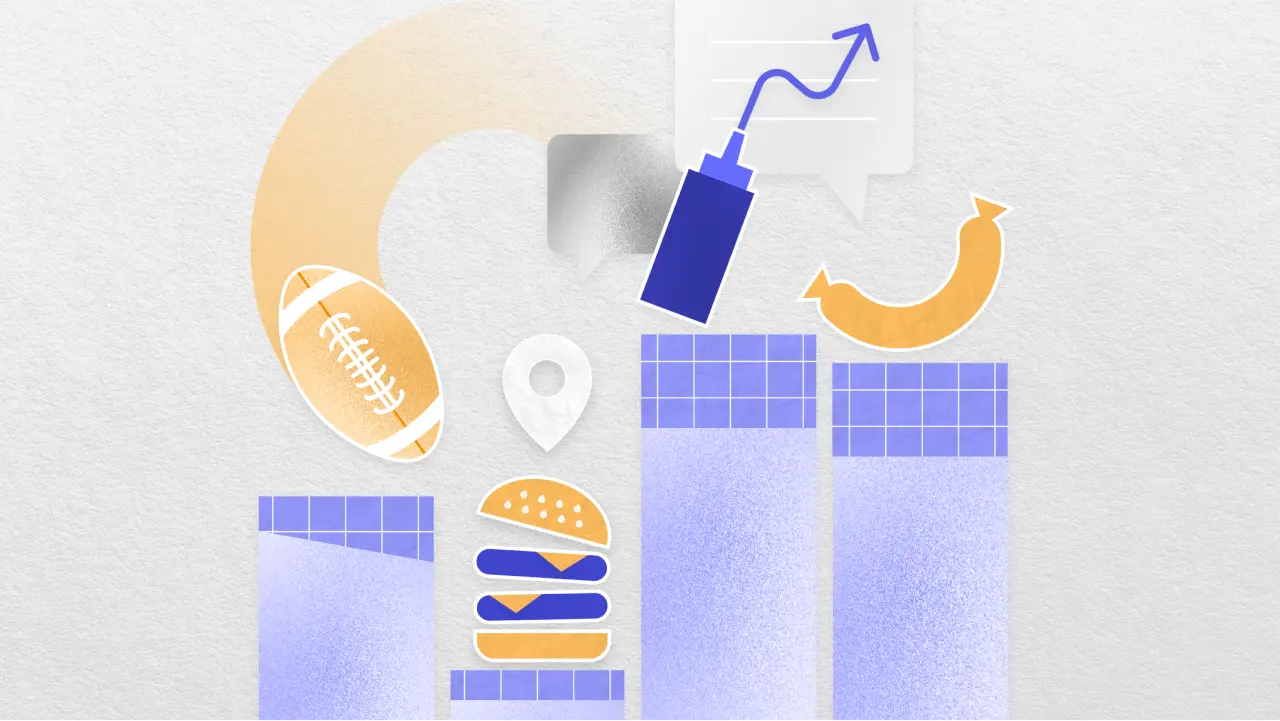
Sports and Dining - Match Made in Heaven
While some dining chains are appealing to the late-night or weekend crowd, others are driving visits by appealing to sports lovers. How have recent rule changes around student athletes changed the restaurant game, and how can college football teams drive business in their hometowns?
Scoring Big: Leveraging Fan Insights to Fuel Successful Partnerships
College sports have long been a major moneymaker, with top-tier teams raking in billions of dollars annually. And as of 2021, college athletes can enjoy a piece of the significant fan following of college sports thanks to the change in the NCAA’s Name, Image, and Likeness (NIL) rules, which now allows student athletes to sign endorsement deals.
Since then, multiple restaurants have jumped on the opportunity to partner with student athletes, some of whom have millions of followers on Instagram and TikTok. Chains like Chipotle, Sweetgreen, Slim Chickens, and Hooters have all signed college athletes to various brand deals.
How can brands ensure they partner with athletes their customers will want to engage with? Analyzing a chain’s audience by looking at the interests of residents in a given chain’s trade area can reveal which type of athlete will be the most attractive to each brand’s customer base. For example, data from Spatial.ai: Followgraph provides insight into the social media activity of consumers in a given trade area and can highlight desirable partnerships.
Examining the trade areas of Chipotle, Sweetgreen, Slim Chickens, and Hooters, for instance, reveals that Sweetgreen’s visitors tended to have the largest share of Women’s Soccer followers. Conversely, Sweetgreen’s trade area had lower-than-average shares of College Football Fans or College Basketball Fans, while residents of the trade areas of the other three chains showed greater-than-average interest in these sports. Leveraging location intelligence can help companies choose brand deals that their customers resonate with and find the ideal athletes to represent the chain.
College Gameday - Wins for Dining
Finding the right college athlete partnership is one way for dining brands to appeal to college sports enthusiasts. But dining chains and venues located near major college stadiums also benefit from the popularity of their local team by enjoying a major game day visit boost.
One of the country’s most popular college football teams, the Ohio State Buckeyes, can draw millions of TV viewers, and its stadium has a capacity of 102,780 – one of the largest stadiums in the country. And while tailgating is a popular activity for Buckeyes fans, nearby restaurants are some of the biggest beneficiaries of the college football craze. Panera experienced a 235.3% increase on game days as compared to a typical day, Domino’s Pizza visits grew by 283.3%, and Tommy’s Pizza, a local pie shop, saw its visits jump by a whopping 600.9%.
Game Day Visitor Spikes
This influx in diners also causes a major shift in game day visitor demographics, as revealed by changes in visitors at dining venues located near stadiums of two of the nation’s best college football teams – the Ohio State Buckeyes and Ole Miss Rebels. Based on Spatial.ai: Personalive data for the captured market of these dining venues, game day visitors tended to come from “Ultra Wealthy Families” when compared to visitors during a typical non-game day in September or October.
The analysis indicates that popular sporting events create a unique opportunity for restaurants near college stadiums to attract high-income customers game day after game day, year after year.
Subwars: Room for Everyone
While some spend game day tailgating or visiting a college restaurant, others hold a viewing party – with a six-foot submarine. And the sub’s popularity extends beyond Superbowl Sundays. Sandwich chains including Jersey Mike’s, Firehouse Subs, Jimmy John’s, and Subway (recently purchased by the same company that owns Jimmy John’s) have seen sustained YoY increases in visits and visits per venue in the first three quarters of 2023.
Some of the growth to these chains may be related to their affordability, a draw at all times but especially during a period marked by consumer uncertainty and rising food costs. And subway leaders seem to be seizing the moment and striking while the iron is hot – Jersey Mike’s opened 350 stores in 2023 and still saw its YoY visits per venue grow by 6.6%. And Subway reported ten consecutive quarters of positive sales, a promising sign for its new owner.
Sandwich Chains Attract a Wide Consumer Base
The love for a healthy, affordable sandwich extends across all income levels, with all four chains seeing a range in their visitors' median household income (HHI). Out of the four chains analyzed, Jersey Mike’s – which has long prioritized a suburban, middle-income customer – had the highest trade area median household income of the four chains at $77.3K/year. Subway, known for its affordability, had the lowest, with $62.9K/year. The variance in median HHI combined with the strong foot traffic growth shows that when it comes to sandwiches, there’s something for everyone.
So What’s The Dining Space Cooking Up?
Persistent inflation and declining consumer sentiment may pose serious challenges for the dining space, but emerging trends are helping boost some restaurants. Customers seeking out a late-night bite drive visits to QSR chains, and health-conscious diners are boosting foot traffic to smoothie bars and sandwich shops. Meanwhile, sports sponsorships and game-day restaurant visits can provide a boost to dining businesses that take advantage of these opportunities.

