
Thanks for Visiting!

Register for free to get the full story.

Sign Up
Already have a Placer.ai account? Log In
Article

Placer.ai Office Index: April 2024 Recap – Recovery Continues

Find out how the foot traffic to office buildings across the country is doing.

By 
Lila Margalit
May 8, 2024
Placer.ai Office Index: April 2024 Recap – Recovery Continues
SHARE
Explore our free tools to get timely insights into key industries
Check out the latest trends for
No items found.
Key Takeaways
  • In April 2024, visits to the Nationwide Office Index were just 32.2% below what they were in April 2019.
  • Miami, Washington, D.C., Dallas, and Atlanta all experienced their busiest in-office months since COVID. 
  • Recovery leaders Miami and New York saw April 2024 office visits bounce back to 86.0% and 83.1%, respectively, of pre-pandemic levels. 
  • San Francisco’s post-pandemic recovery continued to lag behind other metro areas – but the Golden Gate City once again saw the biggest year-over-year (YoY) visit bump of any analyzed hub.

The Placer.ai Nationwide Office Building Index: The office building index analyzes foot traffic data from some 1,000 office buildings across the country. It only includes commercial office buildings, and commercial office buildings with retail offerings on the first floor (like an office building that might include a national coffee chain on the ground floor). It does NOT include mixed-use buildings that are both residential and commercial.

Recent survey data shows that while most people don’t want to go back to the office five days a week, they also don’t want to be fully remote. Many employees – and companies – prefer a middle-of-the-road approach that balances flexibility with opportunities for in-person engagement, learning, and collaboration. 

But what’s happening on the ground? We checked in with our Nationwide and regional Office Indexes to find out.

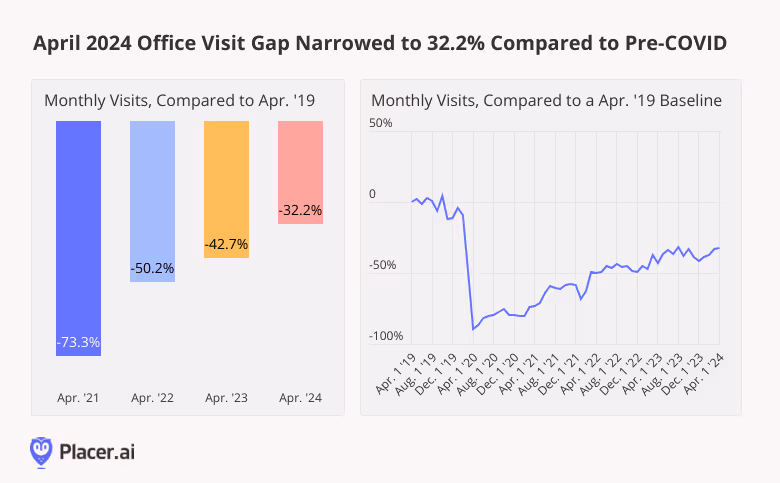
Office Visit Gap Continues to Narrow

Last month saw a continuation of the positive office recovery momentum observed in February and March 2024. April 2024 office visits were just 32.2% below what they were in the equivalent period of 2019 (pre-pandemic), and nearly the highest they’ve been since COVID. Comparing monthly visits to an April 2019 baseline also shows that April 2024 was outperformed only by August 2023 – a rare month featuring 23 business days. (April 2024 had 22 business days – as did April 2019). 

Image with two graphs: monthly visits to office buildings in April 2021, 2022, 2023, and 2024 compared to April 2019, and monthly visits compared to an April 2019 baseline

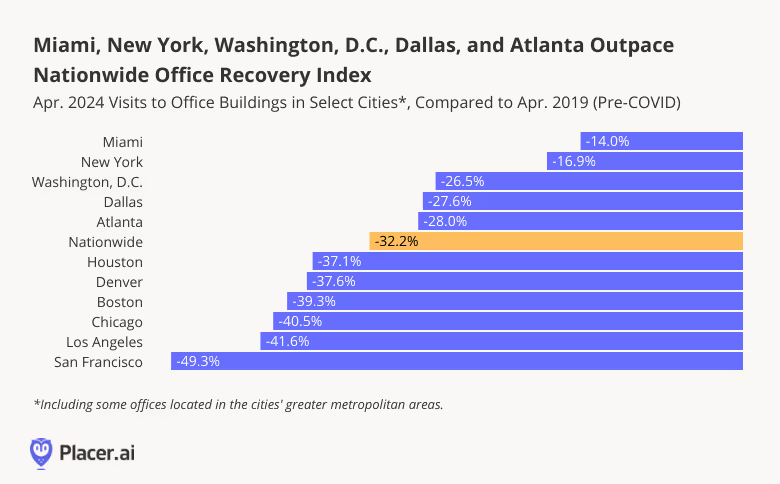
Miami, New York, Washington, D.C., Dallas, and Atlanta Outperform Nationwide Baseline

Drilling down into the data for major regional hubs shows Miami and New York solidifying their office recovery leads with respective pre-COVID visit gaps of just 14.0% and 16.9%. But these weren’t the only cities to shine: Washington, D.C., Dallas, and Atlanta also outperformed the nationwide baseline – and like Miami, experienced their single busiest in-office months since COVID.

April 2024 visits to office buildings in select cities compared to April 2019

San Francisco Wins Again

All the analyzed regional hubs saw significant YoY office visit growth – with the prize once again going to San Francisco, where visits were up 26.0%. Though San Francisco still lags significantly behind other regional hubs compared to pre-COVID, the city’s persistent YoY office visit growth may signal a light at the end of the Golden Gate City’s commercial real estate tunnel.

To be fair, April 2023 had two less business days than April 2024 – a fact that may have served to amplify YoY growth trends across the board. But even accounting for this discrepancy, last month’s strong office recovery was a particularly strong one – showing that RTO remains very much a work in progress.

April 2024 visits to office buildings in select cities compared to April 2023

Looking Ahead 

The benefits and drawbacks of remote work are still being debated. But no matter how you slice it, spending some time in the office each week seems to have its benefits. As companies and employees continue to negotiate the new hybrid status quo, office visit patterns will continue to shift nationwide. 

Follow Placer.ai for more data-driven office insights.

Learn how downtown regions across US cities are measuring up with our free tools.
Check out the latest trends for
No items found.

Related Topics

Stay Anchored: Subscribe to Insider & Unlock more  Insights
Subscribe
SHARE
Get 3 brand & industry
breakdowns every week
Subscribe to the newsletter
Oops! Something went wrong while submitting the form.
Recent Publications
INSIDER
Report
5 Markets to Watch in 2026
Find out why Salt Lake City, Reno, Indianapolis, Raleigh, and Tampa are Placer.ai's markets to watch in 2026.
Placer Research
December 5, 2025
Article
Placer.ai November 2025 Office Index: Post-Pandemic Record Occupancy
Driven by stricter RTO mandates and a stabilizing "new normal," November 2025 marked the strongest November office occupancy rates we have seen since 2019.
Shira Petrack
December 11, 2025
3 minutes
Executive Insights
Dutch Bros vs. Dave’s Hot Chicken: The Veteran and the Rookie in America’s Restaurant Expansion Race
Explore how Dutch Bros and Dave’s Hot Chicken showcase two stages of restaurant growth, from explosive expansion to disciplined scaling and strategic maturity.
Kyle Inserra
December 10, 2025
3 minutes
The Anchor Logo
INSIDER
Stay Anchored: Subscribe to Insider & Unlock more Foot Traffic Insights
Gain insider insights with our in-depth analytics crafted by industry experts
— giving you the knowledge and edge to stay ahead.
Subscribe