
Thanks for Visiting!

Register for free to get the full story.

Sign Up
Already have a Placer.ai account? Log In
Article

Boot Barn and DSW: Stepping Up Their Game

Dive into the data to see how Boot Barn and DSW fared in Q3 2024 – and what they can expect this holiday season.

By 
Maytal Cohen
October 24, 2024
Boot Barn and DSW: Stepping Up Their Game
SHARE
Explore our free tools to get timely insights into key industries
Check out the latest trends for
Key Takeaways
  • In Q3 2024, Boot Barn and DSW experienced year-over-year (YoY) visit growth of 10.8% and 10.5%, respectively.
  • Despite smaller stores, Boot Barn experiences longer visitor dwell times than DSW – perhaps due to the chain’s more varied merchandise and firmer positioning as a weekend destination. Still, visitors to both brands tend to remain in-store, on average, for more than 30 minutes.
  • Boot Barn and DSW experience the holiday season differently: Boot Barn sees its biggest seasonal visit spikes in November and December, while DSW draws its biggest crowds in the spring. But for both chains, Black Friday remains the busiest day of the year.

The holiday shopping season is nearly upon us – and one category that always benefits from holiday sales is apparel. So with Q4 underway, we checked in western wear leader Boot Barn and discount footwear chain DSW (Design Shoe Warehouse, owned by Designer Brands, Inc.) to see how they fared in Q3 2024 – and what awaits them as Black Friday approaches. 

A Step Up in Visits

Boot Barn and DSW – two very different shoe retailers – have been thriving in recent months. Since May 2024, the two chains have seen sustained monthly year-over-year (YoY) visit growth, finishing out Q3 2024 with visit upticks of 10.8% (Boot Barn) and 10.5% (DSW).

Boot Barn and DSW YoY growth from Jan. '24 to Sep. '24 shows significant growth in Q3

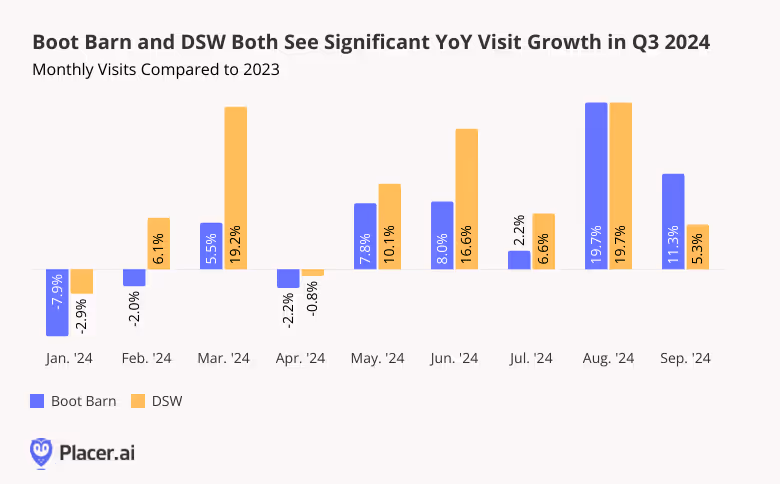
For Boot Barn in particular, Q3’s robust visit growth was at least partially driven by the chain’s aggressive expansion strategy: Between July 2023 and June 2024, Boot Barn opened some 50 new stores – and plans to open dozens more over the coming year. But foot traffic data also shows that the chain has succeeded in growing its footprint without significantly diluting traffic at existing locations. During Q3, the average number of visits to each Boot Barn location dipped just slightly below 2023 levels (2.8%), even as YoY visits to the chain surged by 10.8%. 

DSW, for its part saw significant YoY visit growth throughout Q3, despite a store count that has remained relatively stable. As a store that offers shoppers access to high-quality, name-brand products at affordable prices, DSW lets consumers trade down while splurging at the same time. 

Size Isn’t Everything

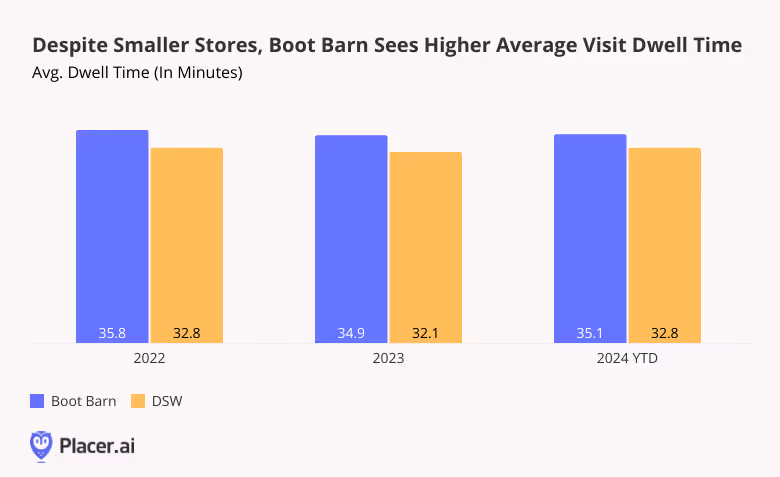
DSW isn’t called a warehouse for nothing. The typical DSW store spans about 25,000 square feet (though the chain has begun experimenting with smaller formats) – compared to just 12,000 - 14,000 for Boot Barn. But despite the smaller size of Boot Barn’s locations, visitors to the western wear chain tend to spend more time in-store than visitors to DSW. Since 2022, average visitor dwell times at Boot Barn have ranged between 34.9 and 35.8 minutes, while dwell times at DSW have hovered between 32.1 and 32.8 minutes. 

Customers at DSW may be more likely to know in advance what they’re looking for, making a bee-line for the discounted footwear they’ve been waiting to get their hands on. Visitors to Boot Barn, on the other hand, may spend more time browsing the brand’s wider selection of merchandise. 

The difference in visitor dwell times may also be partially due to Boot Barn’s firmer positioning as a weekend destination: Over the past twelve months (October 2023 - September 2024), 59.5% of visits to Boot Barn took place between Fridays and Sundays, compared to 56.3% for DSW. 

Still, visitors to both chains tend to remain in-store for more than half an hour – revealing a highly engaged customer base eager to explore the brands’ varied offerings.

Average Dwell time for Boot Barn and DSW in 2022, 2023 and 2024 YTD shows Boot Barn dwell time is higher

Different Seasonal Rhythms

With a strong Q3 2024 under their belts, what can DSW and Boot Barn expect this holiday season? 

Looking at weekly fluctuations in visits to Boot Barn and DSW in 2022 and 2023 – compared to yearly weekly averages – reveals another striking difference between the two chains: Visits to Boot Barn peak in November and December each year, as customers descend upon the chain to purchase western-themed gifts for loved ones. DSW, on the other hand, sees greater visit boosts in spring, perhaps buoyed by shoppers updating their wardrobes in anticipation of warmer weather.

Weekly visits compared to yearly weekly visit average shows Boot Barn Experiences a Major Holiday Visit Surge, While DSW Foot Traffic Peaks in the Spring

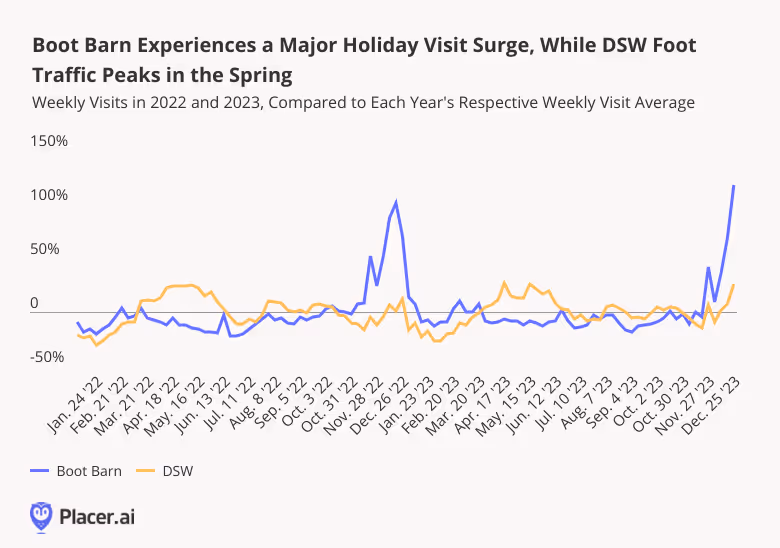
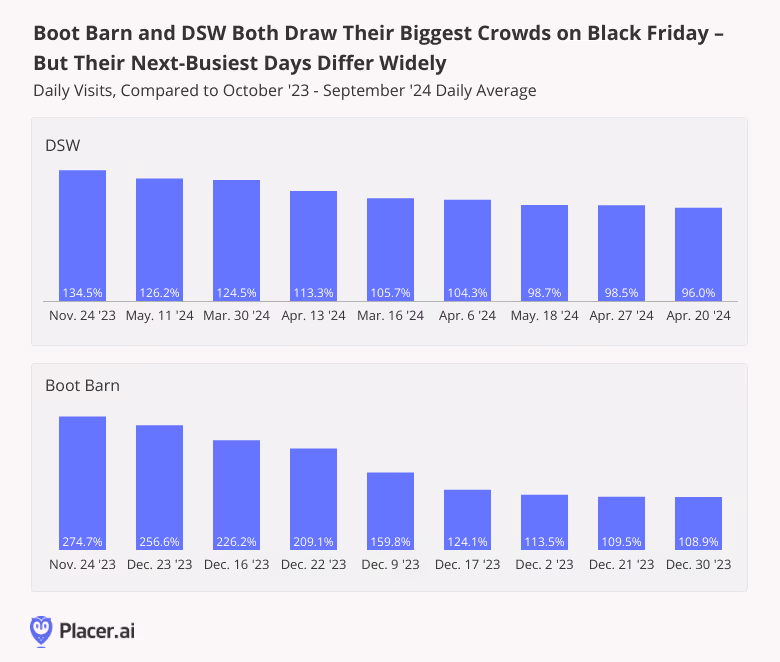
But zooming in on the two chains’ busiest days of the year tells a somewhat different story. Even though DSW experiences a more muted holiday shopping season, the shoe leader – like Boot Barn – draws its biggest crowds of the year on Black Friday. On November 24th, 2023, visits to DSW jumped 134.5% compared to the chain’s daily average for the 12-month period from October 2023 to September 2024 – a smaller spike than that seen by Boot Barn, but significant nonetheless. 

After that, however, the chain’s visitation patterns diverged. For DSW, the next eight busiest days of the year were all Saturdays in Spring – including the Saturday before Mother’s Day (May 11th) and the Saturday before Easter (March 30th). For Boot Barn, on the other hand, December shopping days – including Super Saturday (December 23rd) – drove the biggest foot traffic spikes.

Boot Barn and DSW Both Draw Their Biggest Crowds on Black Friday – But Their Next-Busiest Days Differ Widely

A Slice of Success

With holiday shopping just around the corner, DSW and Boot Barn both appear poised to enjoy a healthy Q4 – each in their own way. Which other footwear and apparel brands are likely to succeed this holiday season? 

Follow Placer.ai's data-driven retail analyses to find out.

This blog includes data from Placer.ai Data Version 2.1, which introduces a new dynamic model that stabilizes daily fluctuations in the panel, improving accuracy and alignment with external ground truth sources.

Learn how downtown regions across US cities are measuring up with our free tools.
Check out the latest trends for

Related Topics

Stay Anchored: Subscribe to Insider & Unlock more  Insights
Subscribe
SHARE
Get 3 brand & industry
breakdowns every week
Subscribe to the newsletter
Oops! Something went wrong while submitting the form.
Recent Publications
INSIDER
Report
Retail Trends to Watch in 2026
Explore how value, luxury, and authenticity will define 2026 retail — and how brands are winning across digital, dining, and suburban markets.
Placer Research
November 14, 2025
Article
Will Upscale Dining Lead the Holiday Season Again?
Holiday dining patterns highlight upscale and fine-dining restaurants as the strongest seasonal performers, with coffee, casual dining, and eatertainment showing targeted lifts. Emerging YoY trends point to premium full-service concepts leading demand again this December.
Bracha Arnold & Lila Margalit
December 4, 2025
4 minutes
Article
Did Fewer Franchise Films Limit Thanksgiving’s Movie Theater Lift?
Thanksgiving brought a healthy rise in movie theater traffic while still trailing 2024’s exceptional highs. The gap points to a growing reality in the theatrical space: In 2025, audiences show up strongest when franchises – and preferably, multiple franchises at once – lead the way.
Shira Petrack
December 3, 2025
3 minutes
INSIDER
Stay Anchored: Subscribe to Insider & Unlock more Foot Traffic Insights
Gain insider insights with our in-depth analytics crafted by industry experts
— giving you the knowledge and edge to stay ahead.
Subscribe
Is lululemon Poised for a Holiday Rebound?
Placer.ai November 2025 Mall Index: Early Strength Offsets a Softer Black Friday
Four Black Friday Signals for the 2025 Holiday Season 
Will Upscale Dining Lead the Holiday Season Again?
Did Fewer Franchise Films Limit Thanksgiving’s Movie Theater Lift?
Darden Heads Into Holiday Season With Strong Visit Trends
How Did Grocery Stores Perform This Turkey Wednesday?
Short Visits Surge as Kroger Bets on Store-Based Fulfillment
How Do Holiday Shopping Patterns Differ for Off-Price and Traditional Apparel?
Dollar Tree and Dollar General Thrive Amid Inflation Fatigue
DICK's Sporting Goods Riding Positive Visit Trend into the Holidays
October 2025 Placer.ai Office Index: Continued Momentum
Red Cup Day 2025 Outperforms Last Year With Bigger Crowds Than Bearista
Gap and Urban Outfitters See Visit Increases in Q3
Back to the Future of Retail: Why Technology Is Bringing Us Full Circle
Department Stores Ahead of the Holidays 
Superstores and Warehouse Clubs Find Early Holiday Momentum
Lowe’s and The Home Depot See the Future of Home Improvement in the Next Generation
TJX, Burlington, and Ross Gear Up for a Blockbuster Holiday Season
Is Turkey Wednesday the Only Big Day for Grocers?
Placer.ai October 2025 Mall Index: Shoppers Return to Malls
How Starbucks Proved That Free Isn’t Everything
Denny’s Goes Private: What’s Next for America’s Diner
Three Retailers to Watch Ahead of the Holidays
Serving Those Who Served: How Restaurants Honor Veterans Day
High-Street Retail Poised for Another Holiday Rush
Offline Growth Drives Engagement for Warby Parker
Grocery Outlet Bargain Market & WinCo Still Thriving Amidst Inflation Fatigue
Does CAVA Still Have Growth Potential?
Catching Up With 2021’s Dining IPOs
Wendy’s Bets on Fewer, Bigger Deals in Q3 2025
Yum! & RBI: QSR in Q3 2025
Shake Shack & Wingstop: Navigating Q3 Waters
Sips Of Success: Coffee in Q3 2025
Texas Roadhouse and Chili’s: Strong Q3 Traffic and a Secret Sauce of High-Income Diners
October Promotions Aimed to Capture Demand From Value-Seeking Consumers In-Store and Online
Retail Outlook: A Tale of Two Consumers Heading into Holiday 2025
McDonald’s and Chipotle Face Headwinds in Q3 2025
Manufacturing Foot Traffic Signals Continued Caution
September 2025 Placer.ai Office Index: A Fall Resurgence
Placer.ai September 2025 Mall Index: Summer Slowdown Extends Into Fall
Summer Surge for Sturgis as Motorcycles Vroom En Masse
K-Beauty & Personalization Drive Beauty Traffic 
All the Things I Think I Think About Retail Over the Last Quarter: Amazon, Walmart & Why the Box May Soon Be on the Other Porch
The Geography of BevAlc Retail Growth
The Comeback Blueprint for Kirkland’s and Bed Bath & Beyond
Distinct Playbooks Driving Growth in Premium Home Retail
Do QSR Value Promotions Still Resonate With Consumers?
Who’s Losing Grocery Share to Dollar General – and What Consumer Habit Is Driving Its Growth?
Exploring Barnes & Noble’s Recent Acquisitions 
3 Factors Driving Dillard’s Department Store Success
Expansion Into New Categories Signals Shift for Gap Inc. 
Beauty and Fitness Foot Traffic: From Post-Pandemic Correction to New Normal
Hobby Lobby and Michaels Defy Discretionary Spending Headwinds
Black Rock Coffee's Post-IPO Growth Potential  
How Asian Grocers Are Redefining the Grocery Experience
Affluent Shoppers Sustain Luxury, But Growth Potential May Be Limited
Costco Early Openings Reshape Store Traffic Patterns
Q2 2025 Restaurant Recap: A Cautious Consumer Shapes Dining Trends 
Is Costco’s Momentum Built to Last?
The US Open: A Comparison of Visitors to Fan Week and the Main Draw
Republic Square’s Summer Programming Proves to be a Hit
Darden Restaurants’ Portfolio Powers Through Consumer Headwinds
Are Cracks in Consumer Resilience Beginning to Show? 
Placer.ai Manufacturing Index: Traffic Dips in August
Will Delayed Car Purchases Fuel a Surge in Aftermarket Maintenance?
August 2025 Placer.ai Office Index: An End-of-Summer Slump? 
What Are the Fast-Growing QSR Categories in 2025?
Placer.ai August 2025 Mall Index: Is Consumer Caution Weighing on Mall Performance? 
Subscriptions Drive Eatertainment Visits for Topgolf, Dave & Buster’s, and Chuck E. Cheese 
Has Starbucks' Pumpkin Spice Latte Retained Its Appeal in 2025? 
Thrift Store Visit Growth Outpaces Apparel as Tariffs Loom
America’s Parks Are Calling: Later, Longer, Busier
How Economic Realities Are Redefining Vegas Tourism
Nordstrom Anniversary Sale: An Event that Continues to Find Success Amid Reinvention
Manufacturing Visits Drop Post-Tariff Implementation
Semi-Annual Sale Drives Visit Surge For Bath & Body Works 
Ulta's Post-Target Future Looks Strong
Where Can Dollar General & Dollar Tree Still Expand? 
Five Below & Ollie's Traffic Signals Growth for Value Retail
Gap Inc. Q2 2025: Old Navy Leads Foot Traffic Gains as Middle-Income Shoppers Return
Best Buy H1 2025 Traffic Data Suggests a Recovery Is Underway
How Athletic Retailers are Weathering the Storm in Q2 2025. 
Expansions Drive Visit Gains for Wholesale Clubs
Discretionary Slowdown Impacts Kohl's & Macy's Mid-Market Brands
Value-Driven Shoppers Still Fueling Off-Price Growth at Burlington, Ross, & Citi Trends
Home Depot & Lowe's: Navigating Challenges & Finding Growth in 2025
Lollapalooza Supercharges Summer Tourism in Chicago
What Walmart and Target's Q2 2025 Traffic Reveals About Future Performance
TJX Q2 2025 Visit Data Points to Strong Performance
The Summer Slowdown: Why Consumers Are Pumping the Brakes on Travel
Placer.ai Office Index: July 2025
Placer.ai Mall Index: July 2025
Retail’s Balancing Act: What the First Half of 2025 Reveals About Evolving Consumer Priorities
Din Tai Fung: Sky High Average-Unit-Volume is a Recipe for Success
Bracing for Impact: July's Manufacturing Surge Reveals Tariff Anxiety
How EAT, TXRH & BLMN Are Navigating the Q2 2025 Dining Market
Life Time & Planet Fitness Q2 2025 Visit Recap
Growth vs. Optimization: A Q2 2025 Analysis of First Watch, Denny's, & Dine Brands
Scaling Fast-Casual: CAVA's Depth vs. Sweetgreen's Breadth in Q2 2025