


.svg)


The World Cup Effect
The 2026 FIFA World Cup is already reshaping foot traffic across the country - filling stadiums, lifting restaurant traffic near host venues, and drawing fans to watch parties and festivals. But one of the tournament's clearest retail beneficiaries may be its most visible sponsor: adidas, supplier of the official Trionda match ball and kit provider to national teams from Mexico to Argentina.
From Slump to Surge
Heading into the spring, adidas stores were fighting an uphill battle - weekly visits ran below 2025 levels for most of April, bottoming out at -20.5% YoY the week of April 13th. Traffic gradually stabilized through May, and then the World Cup arrived.
During the week of June 8th – which included the tournament’s June 11th kickoff and the USMNT’s 4-1 opening win over Paraguay at SoFi Stadium – adidas store visits climbed 14.3% YoY. Momentum then accelerated the following week, the first full week of group-stage play, when the USMNT defeated Australia in Seattle and adidas visits surged 44.7% above the same week last year.
Father’s Day, which fell on June 21st this year, may have contributed to that jump, since the comparison week in 2025 began the day after Father’s Day. But the magnitude of the spike, along with its staying power in subsequent weeks, suggests that tournament-driven excitement was the main driver.
More Than a One-Week Spike
Big temporary visit spikes often fade fast – but this one hasn’t. During the weeks of June 22nd and June 29th, visits remained elevated more than 20% YoY – suggesting that the tournament is driving a sustained shift in demand, not just a burst of opening-week excitement.
The Takeaway
The World Cup's foot traffic ripple effects extend well beyond the stadiums - into dining, retail, and beyond. And while global sponsorships are usually measured in impressions, location intelligence makes them measurable in visits. For adidas, supplying the match ball and outfitting some of the tournament's biggest teams moved fans into stores, week after week. With knockout rounds running through the July 19th final, the three stripes may not be done running up the score.
For more data-driven retail insights, visit placer.ai/anchor.

Experience, Innovation, and Value Define 2025’s Retail Standouts
As the 2025 holiday season approaches, several retail categories are showing surprising resilience – from luxury home goods to consumer electronics and grocery. Despite a challenging economic backdrop, a few standout brands are not only holding steady but gaining meaningful traction through smart expansion, effective online-offline integration, and compelling value offerings.
Framebridge, Best Buy, and ALDI each represent a distinct facet of the retail landscape, but they have one thing in common: strong visitation trends heading into the year’s most critical shopping period.
Framebridge’s 2025 Momentum: Growth, Expansion, and a More Affluent Customer Base
Framebridge has emerged as one of 2025’s standout retail success stories. Over the past 12 months, visits to the brand have climbed 108.8% year over year (YoY) as it rapidly expanded its footprint and deepened its connection with customers.
This momentum stems from Framebridge’s ability to deliver an in-store experience that online competitors simply can’t replicate. Shoppers are invited to see and feel materials firsthand, while design experts offer personalized guidance and creative inspiration to craft meaningful, high-quality pieces. The result is a shopping experience that feels personal, tactile, and memorable – transforming framing from a routine purchase into something experiential and human.
In 2025, Framebridge brought this approach to new audiences with its first stores in California, marking its West Coast debut. And as the chain has expanded, its customer base has grown more affluent: the median household income in Framebridge’s captured market rose from $127.7K in early 2024 to $141.8K by mid-2025, while average household size also increased. Together, these shifts reflect rising resonance among higher-income, family-oriented consumers who value personalization, design, and craftsmanship – leaving the brand well positioned for a strong season of meaningful gift giving.
Best Buy’s Early Holiday Momentum Signals a Strong Season Ahead
Not long ago, many analysts were skeptical about Best Buy’s prospects. The electronics retailer was viewed as vulnerable in a tightening consumer environment, with lingering doubts about its ability to stay relevant amid e-commerce dominance and fast-changing tech trends. But recent data suggests that Best Buy is regaining momentum – and that its strategy to blend digital convenience with in-store expertise is beginning to deliver results.
Between November 2024 and October 2025, foot traffic to Best Buy declined just 1.7% YoY, an impressive result given ongoing store closures and the continued expansion of its online business. At the same time, a steady rise in short in-store visits highlights the success of Best Buy’s online-to-offline integration. And though tariff uncertainty continues to loom, Best Buy’s balanced approach leaves it poised to enjoy a successful Q4 – traditionally Best Buy’s strongest period of the year.
ALDI’s Steady Surge: Why the Value Grocer Is Poised for a Strong 2025 Holiday Season
In the grocery sector, few brands are gaining momentum like ALDI – the no-frills discount grocer that continues to attract shoppers with its focus on simplicity, savings, and quality. Over the past several years, ALDI has sustained consistent visit growth while expanding its store network. And during the same period, the brand’s share of total industry visits has risen from 4.3% in 2022 to 5.7% in 2025 to date, underscoring its growing influence as a leading value-driven grocery chain.
As “Turkey Wednesday” and the pre-Christmas grocery rush approach, ALDI appears set to capture an even greater share of holiday traffic. With strong visitation trends, expanding market reach, and a clear value proposition, the retailer stands out as one of 2025’s most resilient performers.
The Bottom Line
Framebridge, Best Buy, and ALDI demonstrate that experience, convenience, and value remain key drivers of retail performance. By focusing on what draws shoppers into stores, these brands are paving the way for a robust holiday season.
For the most up-to-date retail data, check out Placer.ai’s free tools.
Placer.ai leverages a panel of tens of millions of devices and utilizes machine learning to make estimations for visits to locations across the US. The data is trusted by thousands of industry leaders who leverage Placer.ai for insights into foot traffic, demographic breakdowns, retail sale predictions, migration trends, site selection, and more.
A Slow Summer Lingers into Fall
Following a brief lift in spring – when mall visits nationwide rose year-over-year (YoY) across all formats – the Placer.ai Mall Index showed momentum fading through the summer and softening further into fall.
Indoor malls registered slight year-over-year (YoY) visit upticks in July and August, but saw visits drop 1.9% YoY in September. Meanwhile, open-air centers and outlet malls, which maintained minor visit gaps in the summer, saw these widen to 1.7% and 6.8%, respectively, in September. Some of this decline can be attributed to a calendar shift: September 2025 had one fewer Sunday than the same month in 2024, a change likely to hit outlet malls the hardest. (So far this year, 18.2% of outlet mall visits have occurred on Sundays, compared to just 16.0% for indoor malls and 15.4% for open-air centers). But the September drop also signals that malls’ summer slowdown isn’t over.
Quarterly View Puts Recent Trends in Context
Still, zooming out to quarterly visitation patterns shows that YoY changes in foot traffic have remained relatively modest across mall types since the start of 2025. In Q3 2025, visits to indoor malls were down just 0.1% compared to 2024, while visits to open-air shopping centers and outlet malls dipped just 1.1% and 2.8%, respectively. Given the macroeconomic headwinds that have challenged retail this year – including persistent inflation, tariffs, and higher living costs – these are mild declines.
And with the all-important holiday season approaching, retailers have an opportunity to shift the narrative. Strategic promotions, in-store experiences, and omnichannel integration could help convert cautious consumer sentiment into stronger end-of-year traffic.
Why are Outlet Malls Underperforming?
Even so, despite relative stability in the sector, outlet malls have underperformed other mall types for YoY visits since the start of the year. The format’s steeper YoY declines likely reflect its stronger appeal to value-focused consumers – shoppers who are increasingly turning to large discounters and online bargain platforms.
Analyzing the three mall types’ trade areas with demographics from STI: PopStats shows that outlet malls attract a higher share of lower- to middle-income consumers than other mall formats. Over the past 12 months, 43.8% of households within outlet malls’ captured markets earned less than $75K annually, compared to 40.8% for indoor malls and 37.8% for open-air shopping centers. These shoppers are more likely to be watching their budgets (including for transportation) and choosing more convenient off-price alternatives such as T.J. Maxx, Ross Dress for Less, Burlington, Marshalls, or HomeGoods – all of which saw consistently steady YoY visits throughout the summer and early fall, as shown in the chart below.
Outlet malls also tend to offer fewer of the experiential elements – dining, entertainment, and events – that have helped other mall types regain momentum, leaving them struggling to differentiate and sustain consistent foot traffic. At the same time, shoppers have become more selective, turning to malls for quick, mission-driven visits rather than leisurely outings, a shift that is also reflected in shorter visit durations.
A Tentative Outlook for the Holidays
Although September capped off a sluggish summer, the broader picture offers reason for cautious optimism. Year-to-date performance has remained relatively stable, suggesting that underlying consumer demand remains intact, even if somewhat restrained.
If retailers and mall operators can re-engage shoppers through compelling promotions, festive in-person activations, and other special draws, the upcoming holiday season could still outperform expectations.
For more data-driven shopping center insights visit Placer.ai’s free industry trends tool.
Placer.ai leverages a panel of tens of millions of devices and utilizes machine learning to make estimations for visits to locations across the US. The data is trusted by thousands of industry leaders who leverage Placer.ai for insights into foot traffic, demographic breakdowns, retail sale predictions, migration trends, site selection, and more.

Whether it’s a family picnic, a romantic stroll, or a casual jog, local parks have long been woven into the fabric of American life. In recent years, however, when and how people use these green spaces has shifted in important ways.
Using Placer.ai’s index of 3,000 local parks (i.e., smaller parks within cities, towns, and suburbs and excluding national and state parks), we analyzed visitation patterns over the past year and compared them to pre-COVID baselines. The results reveal not only a steady rise in park traffic, but also meaningful changes in how Americans engage with these public spaces.
Local Park Visits on the Rise – Especially in Spring and Early Summer
Visits to local parks have steadily increased since 2019 as shown in the graph below – reflecting a sustained post-pandemic shift toward outdoor activities.
But the data also shows an interesting seasonal shift. Unsurprisingly, park visits tend to peak in spring and summer (Q2 and Q3), and drop in winter. But whereas in 2019 and 2021, Q3 slightly outperformed Q2, this trend began to reverse in 2022 – and over the past three years, spring and early summer have consistently outpaced the July to September period. Additionally, while Q2 visits have grown year after year, Q3 visits began to decline in 2024 – and July 2025 data suggests the trend may be continuing.
The shift, though subtle, may be tied to extreme summer heat waves in recent years – but it remains to be seen if this pattern will hold long-term.
Longer, Later, and on the Weekends
Beyond sheer numbers, how people use parks is also changing. Since 2019, the share of visits lasting under 30 minutes has dropped, while visits over 30 minutes have increased – pointing to more intentional, extended outings that may include picnics, sports, or social gatherings.
At the same time, the share of weekday and early-day visits have declined, while weekend and evening visits have grown. This suggests that park trips are increasingly seen as dedicated leisure activities – part of people’s weekend plans rather than casual, quick visits.
More Middle-Income Families With Children
Meanwhile, analyzing parks' trade areas indicates a subtle but significant shift in the demographic profiles of park-goers.
In both 2018/9 and 2024/5, park visitors tended to come from relatively affluent areas, with median household incomes (HHIs) above the nationwide average of $79.6K. But the analyzed period saw a modest but significant decline in the median HHI of parks’ trade areas. indicating a broadening of the audience making use of these spaces.
This shift was accompanied by an increase in the participation of families with children – further evidence of the emergence of local parks as communal, family-oriented spaces.
What This Means for Cities
The growth in visitation along with the shifts in timing, duration, and demography carry important implications for local governments and park planners – and understanding these trends can help cities serve their communities and allocate relevant resources more effectively.
For example, with weekend visitation on the rise, cities could plan more park events on Saturdays and Sundays to maximize attendance and community engagement. In addition, more weekend visitors may require expanded parking, public transport options, or bike access to accommodate higher demand.
The growth in later and longer park visits may also suggest a greater need for improved evening amenities, such as better lighting for safety and extended hours for public facilities. Longer visits could also mean higher demand for seating, shaded areas, restrooms, and refreshment vendors. And more families with children could drive demand for enhanced playground equipment, family-friendly programming, and child safety features.
By aligning park services with these evolving patterns, local governments can better serve residents, attract more visitors, and make the most of the growing enthusiasm for outdoor public spaces.
For more up-to-date insights into population movement and civic trends, explore our free migration tool.

The holiday shopping season is nearly upon us – and one category that always benefits from holiday sales is apparel. So with Q4 underway, we checked in western wear leader Boot Barn and discount footwear chain DSW (Design Shoe Warehouse, owned by Designer Brands, Inc.) to see how they fared in Q3 2024 – and what awaits them as Black Friday approaches.
A Step Up in Visits
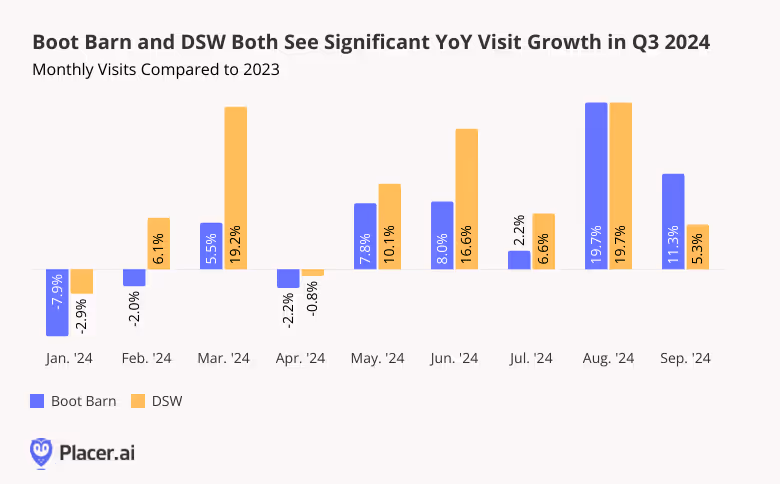
Boot Barn and DSW – two very different shoe retailers – have been thriving in recent months. Since May 2024, the two chains have seen sustained monthly year-over-year (YoY) visit growth, finishing out Q3 2024 with visit upticks of 10.8% (Boot Barn) and 10.5% (DSW).
For Boot Barn in particular, Q3’s robust visit growth was at least partially driven by the chain’s aggressive expansion strategy: Between July 2023 and June 2024, Boot Barn opened some 50 new stores – and plans to open dozens more over the coming year. But foot traffic data also shows that the chain has succeeded in growing its footprint without significantly diluting traffic at existing locations. During Q3, the average number of visits to each Boot Barn location dipped just slightly below 2023 levels (2.8%), even as YoY visits to the chain surged by 10.8%.
DSW, for its part saw significant YoY visit growth throughout Q3, despite a store count that has remained relatively stable. As a store that offers shoppers access to high-quality, name-brand products at affordable prices, DSW lets consumers trade down while splurging at the same time.
Size Isn’t Everything
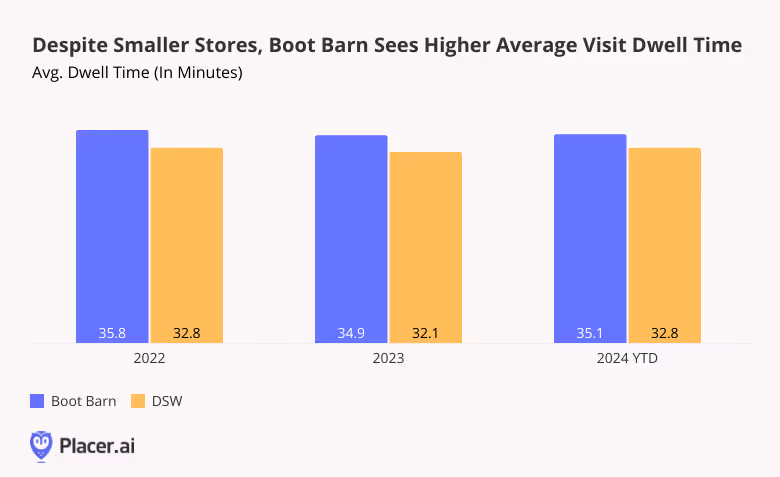
DSW isn’t called a warehouse for nothing. The typical DSW store spans about 25,000 square feet (though the chain has begun experimenting with smaller formats) – compared to just 12,000 - 14,000 for Boot Barn. But despite the smaller size of Boot Barn’s locations, visitors to the western wear chain tend to spend more time in-store than visitors to DSW. Since 2022, average visitor dwell times at Boot Barn have ranged between 34.9 and 35.8 minutes, while dwell times at DSW have hovered between 32.1 and 32.8 minutes.
Customers at DSW may be more likely to know in advance what they’re looking for, making a bee-line for the discounted footwear they’ve been waiting to get their hands on. Visitors to Boot Barn, on the other hand, may spend more time browsing the brand’s wider selection of merchandise.
The difference in visitor dwell times may also be partially due to Boot Barn’s firmer positioning as a weekend destination: Over the past twelve months (October 2023 - September 2024), 59.5% of visits to Boot Barn took place between Fridays and Sundays, compared to 56.3% for DSW.
Still, visitors to both chains tend to remain in-store for more than half an hour – revealing a highly engaged customer base eager to explore the brands’ varied offerings.
Different Seasonal Rhythms
With a strong Q3 2024 under their belts, what can DSW and Boot Barn expect this holiday season?
Looking at weekly fluctuations in visits to Boot Barn and DSW in 2022 and 2023 – compared to yearly weekly averages – reveals another striking difference between the two chains: Visits to Boot Barn peak in November and December each year, as customers descend upon the chain to purchase western-themed gifts for loved ones. DSW, on the other hand, sees greater visit boosts in spring, perhaps buoyed by shoppers updating their wardrobes in anticipation of warmer weather.
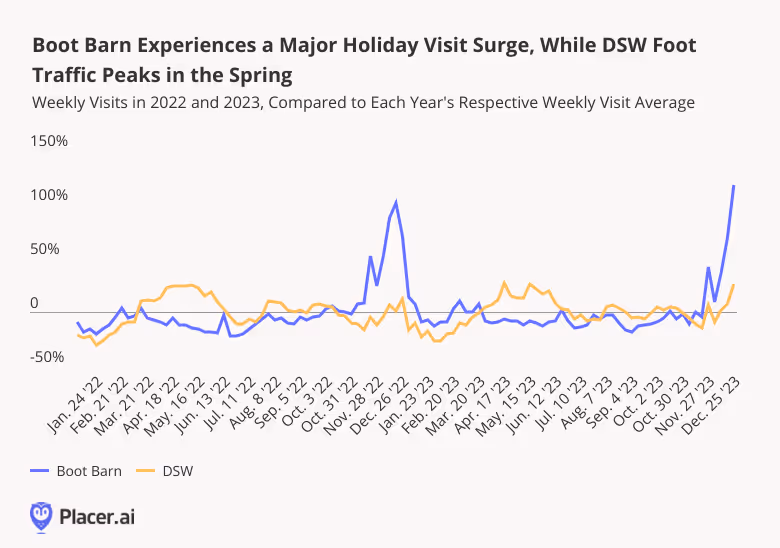
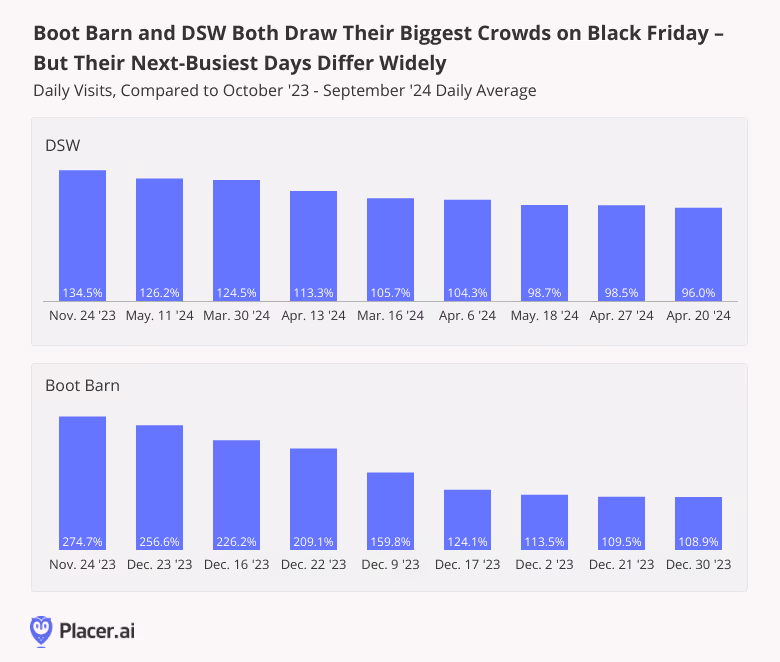
But zooming in on the two chains’ busiest days of the year tells a somewhat different story. Even though DSW experiences a more muted holiday shopping season, the shoe leader – like Boot Barn – draws its biggest crowds of the year on Black Friday. On November 24th, 2023, visits to DSW jumped 134.5% compared to the chain’s daily average for the 12-month period from October 2023 to September 2024 – a smaller spike than that seen by Boot Barn, but significant nonetheless.
After that, however, the chain’s visitation patterns diverged. For DSW, the next eight busiest days of the year were all Saturdays in Spring – including the Saturday before Mother’s Day (May 11th) and the Saturday before Easter (March 30th). For Boot Barn, on the other hand, December shopping days – including Super Saturday (December 23rd) – drove the biggest foot traffic spikes.
A Slice of Success
With holiday shopping just around the corner, DSW and Boot Barn both appear poised to enjoy a healthy Q4 – each in their own way. Which other footwear and apparel brands are likely to succeed this holiday season?
Follow Placer.ai's data-driven retail analyses to find out.
This blog includes data from Placer.ai Data Version 2.1, which introduces a new dynamic model that stabilizes daily fluctuations in the panel, improving accuracy and alignment with external ground truth sources.

Steady Wins the Race
2024 has been a tough year for quick-service restaurants (QSRs), with rising costs, inflation, and changing consumer preferences putting pressure on the industry. And as if these challenges weren’t enough, incursions into the convenient meal space by c-stores, fast-casual restaurants, and even grocery chains have forced QSRs to contend with increased competition.
But visit data shows that despite these headwinds, fast food leaders like McDonald’s and Wendy’s are holding their ground. During the first three quarters of 2024, both McDonald’s and Wendy’s experienced visit levels generally on par with those seen last year, with minimal year-over-year (YoY) variation. Despite a minor dip for McDonald's in Q2, when visits dropped by 2.2% compared to 2023, the overall difference in visit levels for both chains was less than 1% across the remaining quarters.
This stability highlights the ability of both brands to retain a steady flow of traffic despite competitive pressures and economic challenges.

A Limited Menu Boost
One strategy QSRs have successfully deployed to entice hungry customers has been the introduction of discounted limited-time offers (LTOs). And following summer LTOs that garnered plenty of excitement, McDonald’s and Wendy’s are back in the limited-time game. On October 8th, 2024, Wendy's launched its Krabby Patty Kollab, celebrating the 25th anniversary of SpongeBob SquarePants with two limited-time items. Meanwhile, McDonald’s introduced the Chicken Big Mac on October 10th, expanding its menu with an item that had already gained global recognition.
While both launches positively impacted visitation, Wendy's limited-time menu had a more pronounced effect. Wendy’s saw a dramatic surge in visits in the wake of the Kollab, with an increase of 26.4% on the Tuesday of the Krabby Patty launch, compared to a year-to-date (YTD) Tuesday average. The following Wednesday and Thursday also saw increases of 20.7% and 23.9%, respectively, compared to the YTD daily average for those days of the week.
And though the response to McDonald’s menu addition was somewhat more restrained, the limited-time chicken offering also generated a visit increase: On the Thursday of the launch, McDonald’s saw visits jump by 7.9% compared to the chain’s YTD Thursday visit average – showing the power of limited-time items to generate excitement and urgency among consumers.

The Breakfast Effect
In addition to new menu items, McDonald’s has placed a strong emphasis on its breakfast offerings – a strategic focus that has grown more pronounced throughout 2024. By expanding its breakfast menu, offering healthier alternatives, and promoting limited-time deals, McDonald’s has successfully driven morning traffic. The introduction of CosMc's, a new McCafé spinoff, further boosts the company’s breakfast and coffee offerings, appealing to a broader audience seeking affordable beverages and quick meals.
And McDonald’s breakfast strategy appears to be paying off. In 2024, 24.8% of McDonald’s daily visits occurred between 5:00 AM and 11:00 AM – compared to just 8.5% for Wendy’s. Wendy’s, for its part, had a stronger foothold in the lunchtime segment, with the 11:00 AM - 2:00 PM time slot accounting for 27.5% of visits, compared to 21.2% for McDonald’s.

Looking Ahead
Both McDonald’s and Wendy’s have displayed resilience in maintaining steady customer visits, with menu innovations and breakfast strategies playing a significant role in shaping their traffic patterns in 2024.
How will the two quick-service giants sign off this year?
Follow our blog at Placer.ai to find out.
This blog includes data from Placer.ai Data Version 2.1, which introduces a new dynamic model that stabilizes daily fluctuations in the panel, improving accuracy and alignment with external ground truth sources.

