


.svg)


How did leading eatertainment chains Dave & Buster’s and Chuck E. Cheese perform in Q3 2024? We dove into the data to find out.
Dave & Buster’s Sees Lower But More Extended Summer Visit Peak
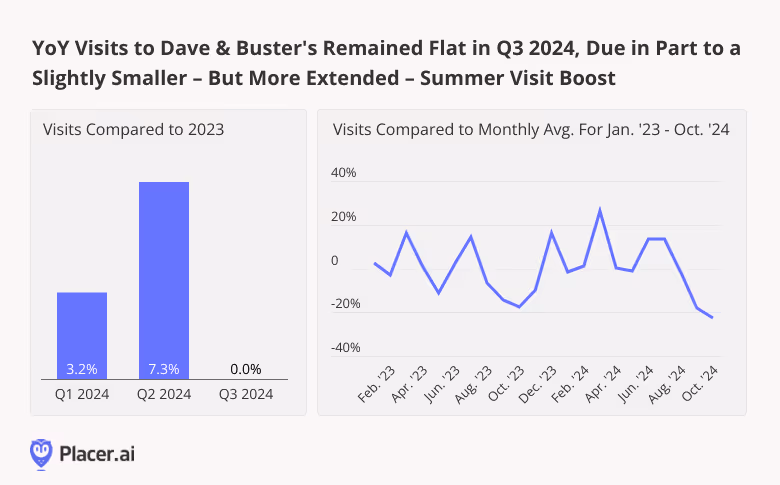
Since January 2024, Dave & Buster’s has enjoyed mainly positive YoY visit growth, fueled in part by the eatertainment leader’s continued expansion. In Q2 and Q3 2024, visits to the chain were up 3.2% and 7.3%, respectively. And though YoY foot traffic to the chain slowed down in Q3 2024, a look at Dave & Buster’s monthly visit patterns shows that this may have been due in part to a summer visit peak that was slightly lower – but more extended – than that seen last year.
In 2023, Dave & Buster’s experienced three distinct visit spikes – in March, July, and December – with the restaurant’s 14.6% July visit boost (compared to a monthly average for Jan. ‘23 - Oct. ‘24) preceded by a relatively quiet June (+2.0%). But this year, summer foot traffic began to trend upwards earlier, with both June and July seeing substantial upticks – 13.6% and 13.4%, respectively. (June is in Q2 and so this part of the uptick would not have been included in Q3 foot traffic numbers). And though September, usually a down period for Dave & Buster’s, saw a modest drop in visitors compared to 2023, the chain’s March peak was higher than last year’s.
Weekday Visits on an Upswing
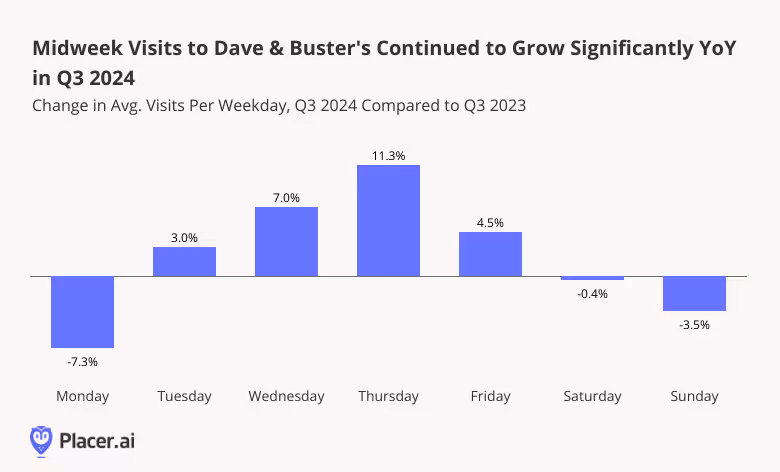
Digging even deeper into the data shows that even as YoY quarterly visits to Dave & Buster’s remained flat in Q3 2024, mid-week visits to the chain continued to climb. Dave & Buster’s has been investing heavily in mid-week promotions meant to drive traffic during quieter periods, and its efforts are clearly paying off. On Wednesdays, Dave & Buster’s offers a 50% discount on games – and the average number of Wednesday visits to the chain were up 7.0% YoY. Thursdays, too, saw an 11.3% YoY foot traffic increase, likely fueled by diners drawn to Thursday specials as the most intensive part of the work week wound down. (In Q3 2024, July 4th fell on a Thursday, which also generated a significant visit bump – but even when discounting the week of the holiday, Thursday visits were up 6.4% on average.)
Against the backdrop of solid seasonal peaks and impressive mid-week visitation trends, Dave & Buster’s appears poised to enjoy a robust December – another important seasonal milestone for the restaurant. And keep an eye out for the week after Christmas, traditionally Dave & Buster’s busiest week of the year: Last year, the week starting December 25th drove a 65.0% visit spike to the chain compared to a 2023 weekly average.
Summer Success at Chuck E. Cheese
Speaking of promotions – Chuck E. Cheese is another eatertainment leader that has been finding success by leaning into special deals, making it easier for price-conscious consumers to treat their kids to pizza and fun.
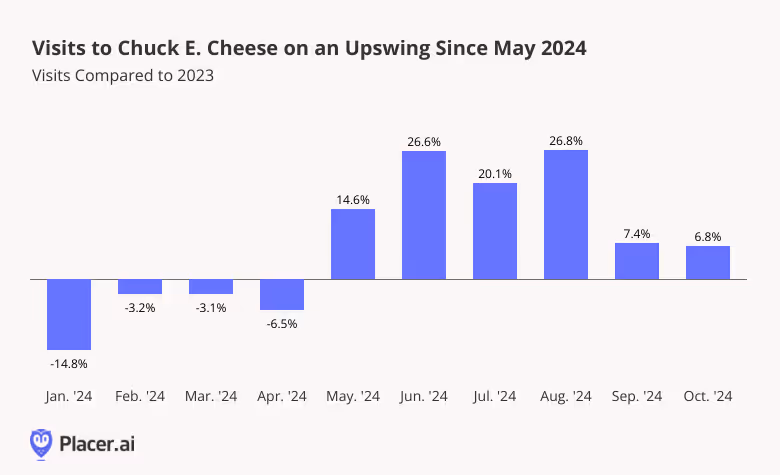
Following a lackluster start to the year, YoY visits to Chuck E. Cheese began trending upwards in May 2024 and have remained elevated ever since. Between June and August 2024, foot traffic to Chuck E. Cheese was up between 20.1% and 26.8% compared to the equivalent period of 2023. And though the pace of visit growth began to taper in September as kids went back to school, visits remained substantially higher than last year.
Chuck it Up to Loyalty
What’s behind Chuck E. Cheese’s summer flourishing? A look at shifts in loyalty trends at the chain suggests that the success of this year’s Summer Fun Pass may be a big part of the story.
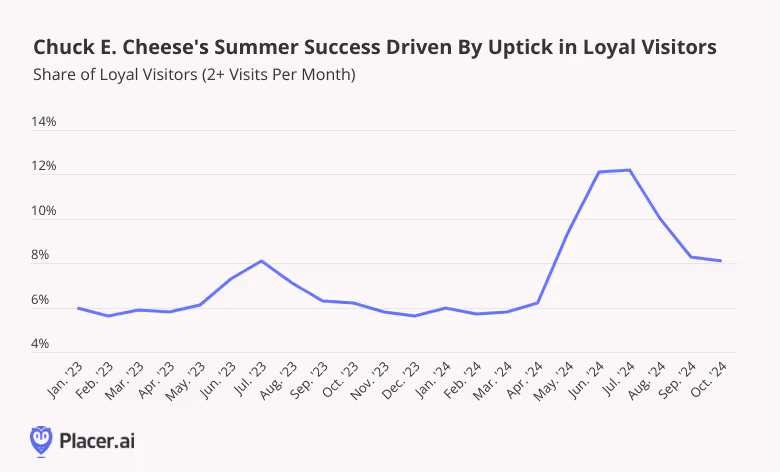
On average, the share of loyal visitors to Chuck E. Cheese – i.e. those frequenting the restaurant at least twice in a month – tends to range between five and seven percent. Last summer, this percentage increased to 8.1%, as parents sought out indoor activities to keep kids occupied when school was out. But this year’s summer loyalty spike – just over 12.0% in both June and July – was significantly higher.
Though Chuck E. Cheese also offered a Summer Fun Pass last year, this year’s deal provided even greater value – including unlimited visits over a two-month period, steep discounts on food, and up to 250 games per day. And the promotion was such a smashing success that Chuck E. Cheese has launched a new unlimited-visit pass meant to make frequent trips to the chain more affordable for families all year round. As the kids’ eatertainment leader continues to revamp its offerings – remodeling locations and adding new activities like indoor trampolines – Chuck E. Cheese appears poised to keep drawing the crowds.
Winning With Fun
Today’s cautious consumers are always on the lookout for ways to save – and eatertainment chains are paying attention. Will Dave & Buster’s post-Christmas visit spike outperform last year’s? And will Chuck E. Cheese’s new unlimited play model continue to drive traffic throughout Q4?
Follow Placer.ai’s data driven analyses to find out.


.avif)
%20IPO.avif)

