


.svg)


With Q3 2024 underway, we checked in with beauty chains Ulta Beauty and Sally Beauty Supply, owned by Sally Beauty Holdings, Inc. How did they fare in the first half of the year? And what are some of the factors driving their success?
We dove into the data to find out.
Ulta Continues to Outperform
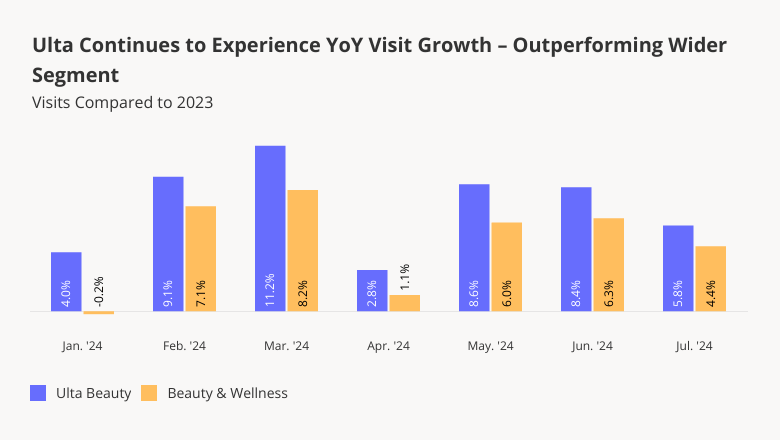
Ulta Beauty thrived in 2022 and 2023, propelled by the lipstick effect – which sees consumers splurging on low-cost indulgences when times are tight – and by the post-pandemic consumer obsession with wellness. And though the beauty giant’s visit growth has moderated somewhat in recent months, it continues to see year-over-year (YoY) foot traffic growth.
Between January and July 2024, Ulta consistently outperformed the wider beauty segment, with monthly YoY visit increases ranging between 2.8% and 11.2%. On a quarterly basis, visits to the chain jumped 6.6% YoY in Q2 2024. Though some of Ulta’s visit growth can be attributed to the chain’s growing store count, the average number of visits to each Ulta location also increased 4.6% YoY in Q2 2024.
Sally Beauty Supply Rebounds
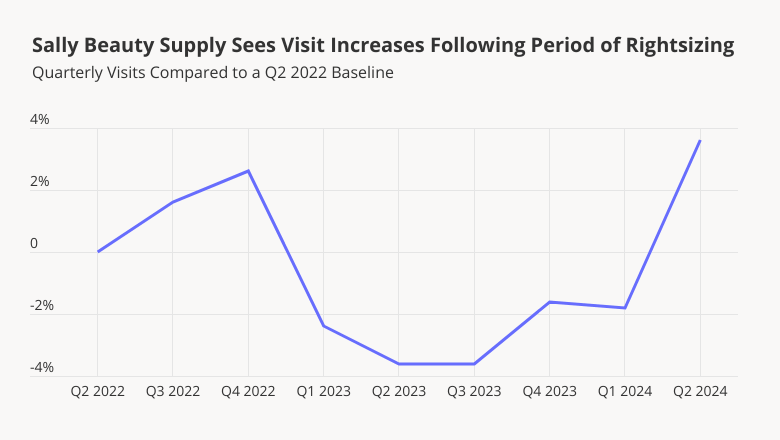
Sally Beauty Supply – the hair care-oriented beauty chain with more than 3,100 stores nationwide – is another beauty brand to watch this year. In 2022, Sally Beauty announced a store optimization plan that included the shuttering of more than 300 stores. And foot traffic data shows that the chain’s rightsizing efforts are paying off.
Comparing quarterly visits to Sally Beauty to a Q2 2022 baseline shows that after declining throughout 2023, overall visits to the chain have begun to pick up once again – with Q2 2024 foot traffic up 3.6%.
Broad and Varying Appeal
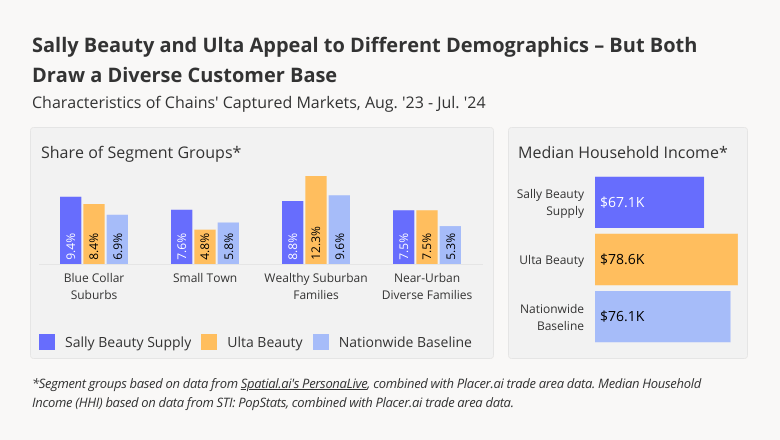
One factor that appears to be driving success for both Ulta and Sally Beauty is their unusually broad appeal. Analyzing the two chains’ captured markets with data from Spatial.ai’s PersonaLive and STI: PopStats shows that though there are differences between Ulta and Sally Beauty’s captured markets, both brands draw large shares of customers from across demographic groups.
Overall, the median household income of Ulta’s captured market is higher than that of Sally Beauty – $78.6K, compared to $67.1K. Ulta’s distinct mix of prestige and budget products is especially likely to draw Wealthy Suburban Families, while Sally Beauty’s offerings hold special appeal for Small Towns.
But both brands’ captured markets include higher-than-average shares of the Blue Collar Suburbs and Near-Urban Diverse Families segment groups – showing that despite their differences, Ulta and Sally Beauty both boast diverse customer bases.
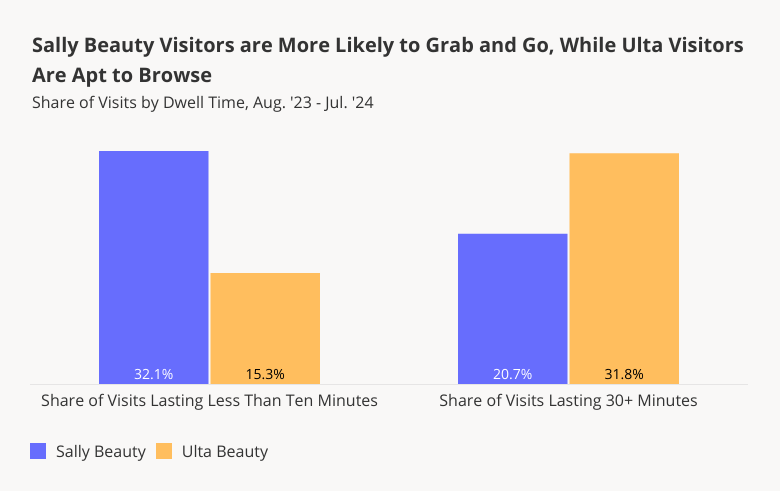
Different Offerings – and Dwell Times
Still, visitors interact with the two beauty chains differently. During the 12-month period ending in July 2024, some 32.1% of visits to Sally Beauty lasted less than 10 minutes – compared to just 15.3% of visits to Ulta.
Sally Beauty’s far greater share of visits under ten minutes may be partly a result of its hair-focused product mix. In Q2 2024, some 64.8% of Sally Beauty’s net sales were in the hair color and care segments, while just 8.1% were in skincare and cosmetics. Ulta’s offerings, by contrast, are very much centered on cosmetics. And while shoppers buying hair care products may be more likely to take advantage of options like BOPIS (buy online, pick up in-store), those on the hunt for makeup may be more intent on trying out products and browsing in-store. Beauty professionals, who make up a larger share of Sally Beauty’s customer base than that of Ulta’s, may also be more inclined to use this service.
On the flip side, Ulta drew a much higher share of extended visits (30+ minutes) during the analyzed period – 31.8%, compared to 20.7% for Sally Beauty. In addition to browsing the aisles and trying new products, many Ulta customers likely remain longer in-store to avail themselves of the chain’s varied in-store salon services.
Looking Ahead
Ulta and Sally Beauty have different offerings – and serve different customer bases. But the success and broad appeal of both brands shows that in the beauty space of 2024, there’s plenty of room at the top.
For more data-driven insights, visit Placer.ai.


.avif)


