Thanks for Visiting!

Register for free to get the full story.

Sign Up
Already have a Placer.ai account? Log In
Retail

Lipstick Effect Boosts Ulta’s Growth 

Beauty sales have been surging, so we dove into Ulta Beauty’s foot traffic data to see how current events are boosting this already strong retailer.

By 
Shira Petrack
August 23, 2022
Lipstick Effect Boosts Ulta’s Growth 
SHARE
Explore our free tools to get timely insights into key industries
Check out the latest trends for
No items found.
Key Takeaways

Beauty products are often seen as an “affordable luxury,” and shoppers looking for budget-friendly splurges are increasing their offline beauty visits even as discretionary spending in other categories drops. To better understand the current beauty surge, we dove into Ulta Beauty’s year-to-date foot traffic performance to see how the wider economic situation is boosting this already strong retailer.

Ulta Building on Last Year’s Strength

The “lipstick effect” (sometimes called the “lipstick index”) posits that in times of economic stress, consumers will indulge in discretionary purchases – such as lipstick – that provide an emotional uplift without breaking the bank. Recently, as shoppers tightened their budgets in the face of high inflation and cut down on dining out, mall trips, and even coffee, beauty purchases surged, with sales of premium beauty products seeing a particularly marked increase.  

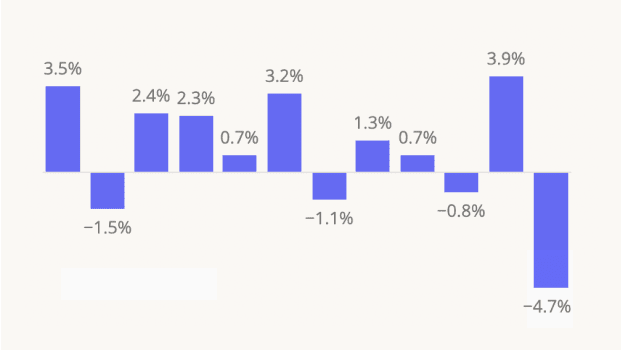
Foot traffic data reveals that Ulta Beauty – a leader in the brick-and-mortar (and online) beauty retail space – is one of the big beneficiaries of this increased beauty demand. Following an already strong 2021, foot traffic to Ulta stores further increased this year, with year-over-year (YoY) monthly visits up every month of 2022 so far on both an overall and visits-per-venue basis. 

Although Ulta has invested heavily in virtual try-on technology, many beauty shoppers still prefer to visit physical stores so they can see, feel, and try on products before making a purchase. The strong YoY foot traffic trends may indicate that many of those who transitioned to online beauty shopping at the height of COVID have now made their way back to physical stores. 

Ulta’s Long-Term Expansion Potential 

Ulta’s strength becomes even more apparent when comparing current visits to pre-pandemic levels: Year-over-three-year (Yo3Y) overall monthly foot traffic to Ulta is up by double-digits every month since the beginning of 2022. 

Some of the overall increase in visits is due to Ulta’s store fleet growth over the past couple of years. But visits per venue have also grown significantly, with July 2022 Yo3Y visits up 30.6% overall and 20.6% on a visits per venue basis. This means that the chain’s expansion is meeting with an eager customer base.  

According to its 2021 annual report, the company operated 1,264 stores in January 2022 (up from 1,174 in February 2020) and has the potential to grow its store fleet to 1,500-1,700 freestanding Ulta stores in the long term. The significant growth in visits per venue over the past three years seems to support the brand’s expansion plans by confirming the strong demand for physical Ulta stores. 

How Has Ulta’s Offline Traffic Changed Since 2019? 

Foot traffic analytics can show more than just the number of visits to each location – it can also reveal where visitors are coming from, who these visitors are, and how often they return. 

Analyzing Ulta locations in the U.S. show that both the number of unique quarterly visitors and the share of returning quarterly visitors increased between Q2 2019 and Q2 2022. This means that Ulta is maintaining – and even increasing – loyalty among its existing customers while successfully attracting new visitors. Ulta's efforts to add new brands is likely contributing to its success in this area – as the company diversifies its inventory, it increases its potential to reach a wider variety of beauty shoppers. 

The data also shows that the average True Trade Area for the Ulta locations increased from 71.1 square miles in Q2 2019 to 86.9 square miles in Q2 2022. Consumers’ willingness to drive further to visit Ulta stores despite this year’s gas hikes is yet another testament to Ulta’s current brick and mortar strength. 

Lastly, combining foot traffic data with other data sets can uncover an additional layer of insights. In Ulta’s case, incorporating data from the 2019 census into the trade area analysis shows that the median household income (HHI) in Ulta’s Q2 2019 trade area was $67,897, compared to a median HHI of $65,078 for Ulta’s Q2 2022 trade area. This means that Ulta is seeing an expansion of who their customers are when compared to Q2 2019, which may offer further support for the “lipstick effect”. Middle- and lower-income consumers are likely feeling a greater inflationary pinch, which may be leading them to avoid larger purchases – and visit the beauty retailer for smaller, budget-friendly thrills. 

For more data-driven retail insights, visit placer.ai/blog.

Learn how downtown regions across US cities are measuring up with our free tools.
Check out the latest trends for
No items found.

Related Topics

Explore our free tools to get timely insights into key industries
Check out the latest trends for
No items found.
SHARE
Get 3 brand & industry
breakdowns every week
Subscribe to the newsletter
Oops! Something went wrong while submitting the form.

Get a Demo

Please enter your first name
Please enter your last name
Please provide a valid email
Please enter your email
Please enter company name

Thanks for reaching out!

One of our experts will be in touch soon

Try Placer.ai Free
Oops! Something went wrong while submitting the form.

Recent Publications

Get 3 brand & industry breakdowns every week

Subscribe to the newsletter
Life Time and Orangetheory: Premium Fitness Flourishing
C-Stores: More Than A Pit Stop
Darden: Dining Dominance Undeterred 
Placer 100 Index for Retail and Dining: August 2024 Recap
Placer.ai Office Index: August 2024 Recap
Placer.ai Mall Index: August 2024 Recap – Back-To-School In Full Swing
Auto Parts Retailers: The Traffic Continues
Pumpkin Spice Works its Magic Once Again
School Season Sparks Retail Growth
Placer.ai White Paper Recap – July & August 2024
Big Lots’ Big Rightsizing Move in Four Data Points
Fun Away From The Sun: Checking in With Eatertainment
Domestic Migration and Population Growth: Strong Currents Off The Carolina Coast
The Civic Impact of Summer Events
Retail Trends in College Towns: A Back-to-School Snapshot
Five Below and Ollie’s Bargain Outlet: Consumers Still on the Hunt for Discounts
Macy’s & Bloomingdale’s: Into 2024 and Beyond
Limited Time Only: The Trend Continues
Beauty in 2024: Many Ways to Win
Dollar General & Dollar Tree: Powering Ahead in Q2 2024
The Home Depot and Lowe's Foot Traffic Remodel in Q2 2024
Superstore Update: Summer Savings Spree
Placer.ai Mall Index: July 2024 Recap – From Fourth of July to Back-to-School
Placer.ai Office Index: July 2024 Recap
Summer Movie Madness: Blockbuster Films Boost Foot Traffic
Driving Success: Toyota in 2024
Denny’s and IHOP: An All-Day Breakfast Matchup
Warby Parker: Seeing Clearly Now
Planet Fitness at the 2024 Halfway Point
Serving Summer 2024: RBI and Yum! Brands Q2 Foot Traffic
Starbucks, Dutch Bros., Dunkin’: Finding Summer Success
Fast Food and Fast Casual Favorites, Plus CosMc’s Takeoff
Chipotle and Sweetgreen: Fast-Casual in Q2 2024
First Watch, Texas Roadhouse, and Applebee’s: An FSR Roundup
Albertsons Companies: H1 2024 Recap
Teaming Up For Success: Sports Stadium Sponsorships
Limited Time Offers: Price Wars Boost Visits
Placer 100 Index for Retail & Dining: June 2024 Recap
Placer.ai Mall Index: June 2024 Recap
Placer.ai Office Index: June 2024 Recap
Inside Out 2: The New Blockbuster Bringing Crowds Back to Theaters
Petco and PetSmart: A Head to Head
Frozen Delights: Exploring Ice Cream Chains Across America
Placer.ai White Paper Recap – June 2024
Barnes & Noble: Writing a New Story
Small Format Stores - Sprouting, Blooming, and Expanding
Retail and Dining on Father’s Day
Thrift Store Visit Scores
Charting Value Grocery’s Visit Growth
Placer 100 Index for Retail & Dining: Introduction and May 2024 Recap
Digging Into Darden: Q2 2024 Update
2024 Retail and Dining Trends Update
TRU and avid: Midscale Hotels on the Rise 
Diving Into Kroger: A Strong Start to 2024
Placer.ai Mall Index: May 2024 Recap – Mall Visits on the Rebound
Placer.ai Office Index: May 2024 Recap
2024 Memorial Day Recap
Las Vegas: A Tourism and Migration Deep Dive
Eatertainment Chains: Full on Food, Fun, and Foot Traffic
The Promise of Luxury Apparel
Catching Up With Ulta Beauty & Gap Brands
Ollie’s Bargain Outlet and Five Below: Q1 2024 Treasure Troves
CAVA Still Going Strong
Driving Success: Auto Parts Chains in 2024
Checking in With DICK’S Sporting Goods
Mother’s Day Shopping and Dining Trends
Placer.ai Mall Index: April 2024 Recap – Retail Resilience Heading into Spring
Dollar Stores Still Gaining Momentum
Off-Price Apparel Chains After Q1 2024: Demographics in the Balance
Walmart, Target, and Wholesale Clubs Continue to Thrive
Home Improvement and Decor Check In
Placer.ai Office Index: April 2024 Recap – Recovery Continues
Movie Theaters in Q1 2024: A Preview of Coming Attractions?
Let’s Get Physical: Fitness In 2024
Where Are Workers Returning to Office in 2024?
2024 Wins: Sweetgreen & First Watch on the Rise
A Full-Service Turnaround: Bloomin’, Dine, and Texas Roadhouse
Wendy’s and Denny’s: Breakfast and Late Night Dining Drives Success
Coffee Chains: Q1 2024 Update and What’s Changed Since COVID
Checking in with RBI and YUM!
Chipotle & McDonald's Serving Up Success
Wingstop & Shake Shack Continue Growing Their Reach 
Strong Start for Sprouts in 2024
Crocs’ Footwear Fairytale
Who Attends NCAA Final Four Events?
Eclipse Fever: How Did the (Retail and Hospitality) Stars Align?
Exploring Albertsons Companies’ Grocery Growth
Placer.ai Mall Index: March 2024 Recap – Malls Rise Again
Placer.ai Office Index: March 2024 Recap
Florida Spring Break Break-Up? Travelers Still Love Florida!
Provo-Orem and Ogden-Clearfield Emerging As Utah Hotspots 
Three Formulas for Experiential Retail in 2024
Aldi & Lidl Making The Cut
Texas Suburbs on the Rise
Exploring Luxury Hotel Brands’ Guest Segmentation
The St. Patrick’s Day Effect
How Can JOANN Make a Comeback?
Panera Bread Well Positioned for Possible IPO
Who Will Benefit From Family Dollar’s Downsizing?
Dave & Buster’s and Main Event Entertainment: Food and Fun for Everyone