


.svg)


We’ve spent a lot of time this past year analyzing how consumer behavior has evolved across the broader food and essentials category, noting that consumers continue to shop a wide number of stores across multiple channels for food purchases. With the release of Placer Data Version 2.1, we thought we’d revisit the topic.
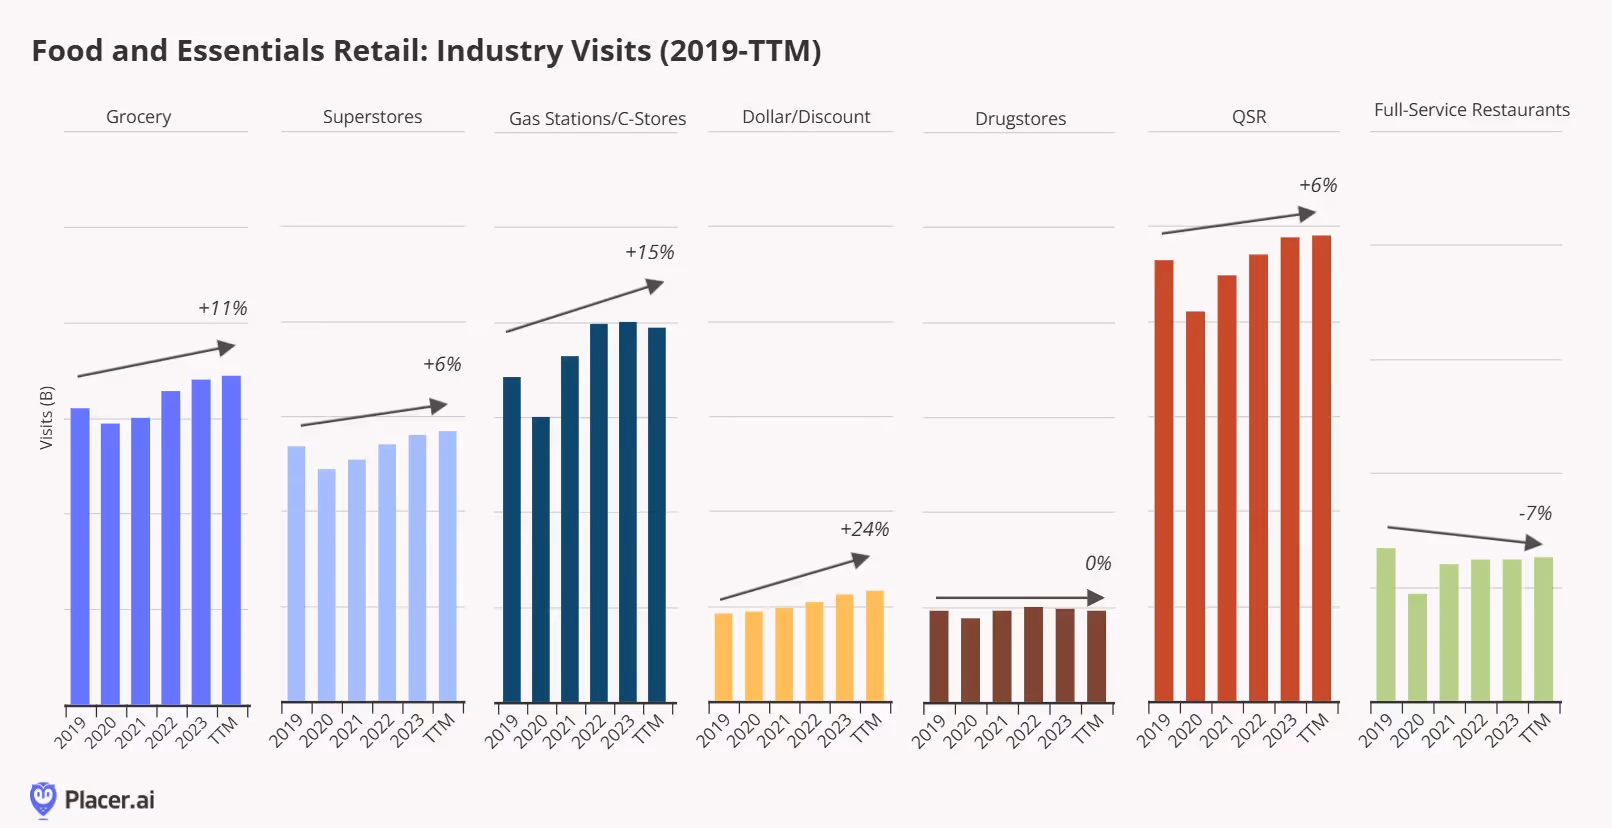
Below, we’ve presented total category visits for grocery stores (including both conventional and value grocery chains), superstores (including mass merchants and warehouse clubs), gas stations and convenience stores, dollar and discount stories (including liquidators), drugstores, quick-service restaurants (QSR), and full-service restaurants from 2019 to the trailing-twelve-month period (TTM0. A few takeaways: (1) Dollar stores saw the largest increase in total visits versus the other categories as they vastly expanded their food and consumables offering since 2019 to drive frequency and traffic. However, the pace of growth has decelerated materially over the past twelve months amid increased competitive pressure from superstore and value-oriented retailers like Aldi and 99 Cents Only Stores exiting the market; (2) drugstore visits have remained flat versus 2019 despite most of the major chains in the category undergoing store closure programs. We believe healthcare service and weight-loss drug prescriptions visits have helped to offset some of the store closures, although we continue to see some transfer of visits to other retail categories in this channel; and (3) the decline in full-service restaurants is partly due to permanent closures compared to 2019.
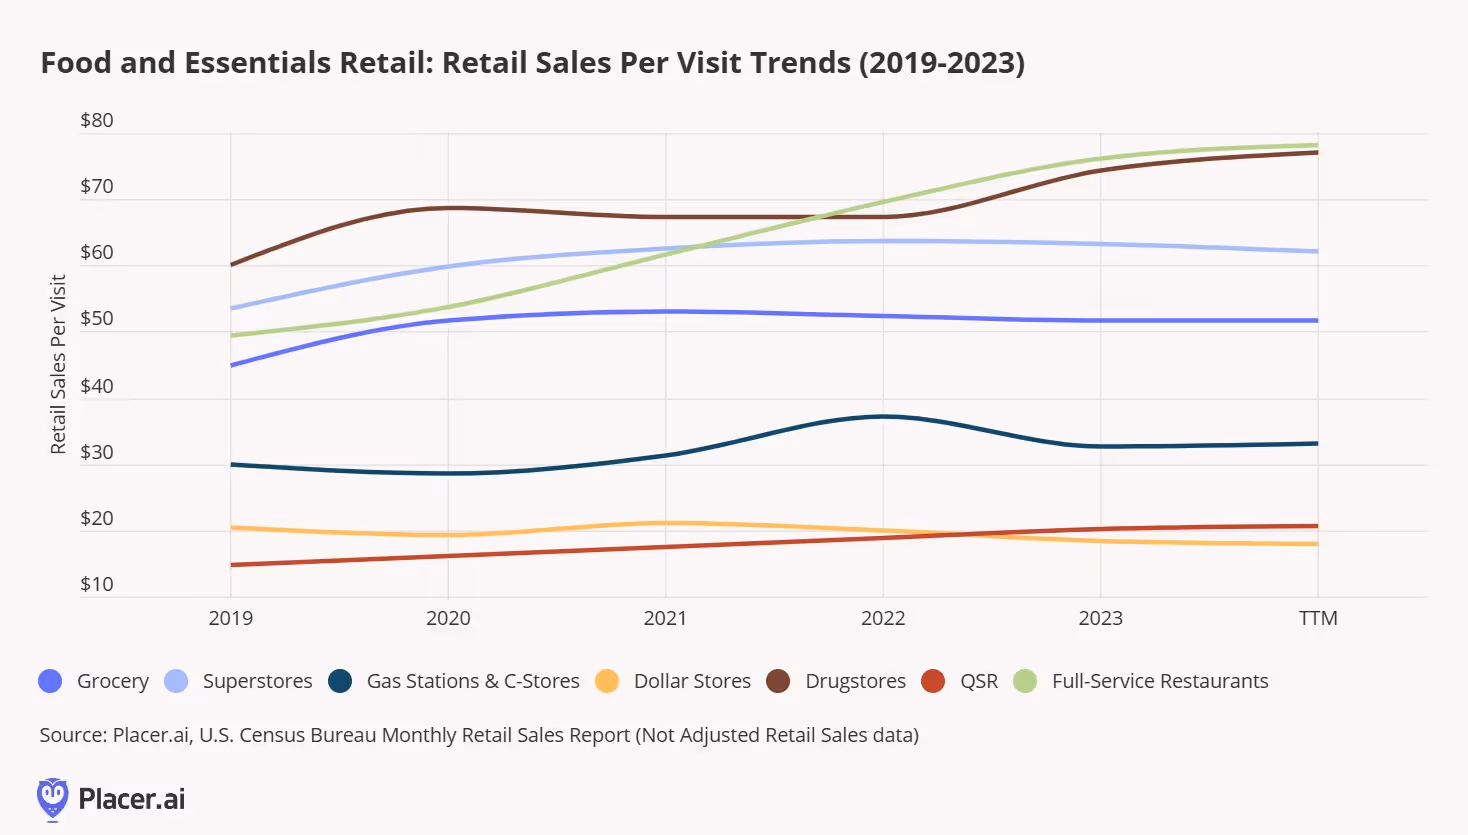
It gets interesting when we compare category-level retail sales data from the U.S. Census Bureau to our visitation data. Below, we’ve taken retail sales (on an unadjusted basis) for the same timeframe that we looked at above to analyze retail spend per visit. A few things stand out here: (1) Three categories saw the average retail sales per visit increase period of the analysis: QSR, full-service restaurants, and drugstores. The increase in drugstores is likely partly to due with the shift in sales mix to more healthcare related services, while the increase in QSR and full-service restaurant retail sales per visit likely explain this summer’s promotional activity to win back customers who traded to other channels; (2) The impact of increased promotional activity and fewer units purchased per transaction can be seen across the other categories, where we saw an inflection in retail sales per visit in 2023 and continuing into 2024 for most.
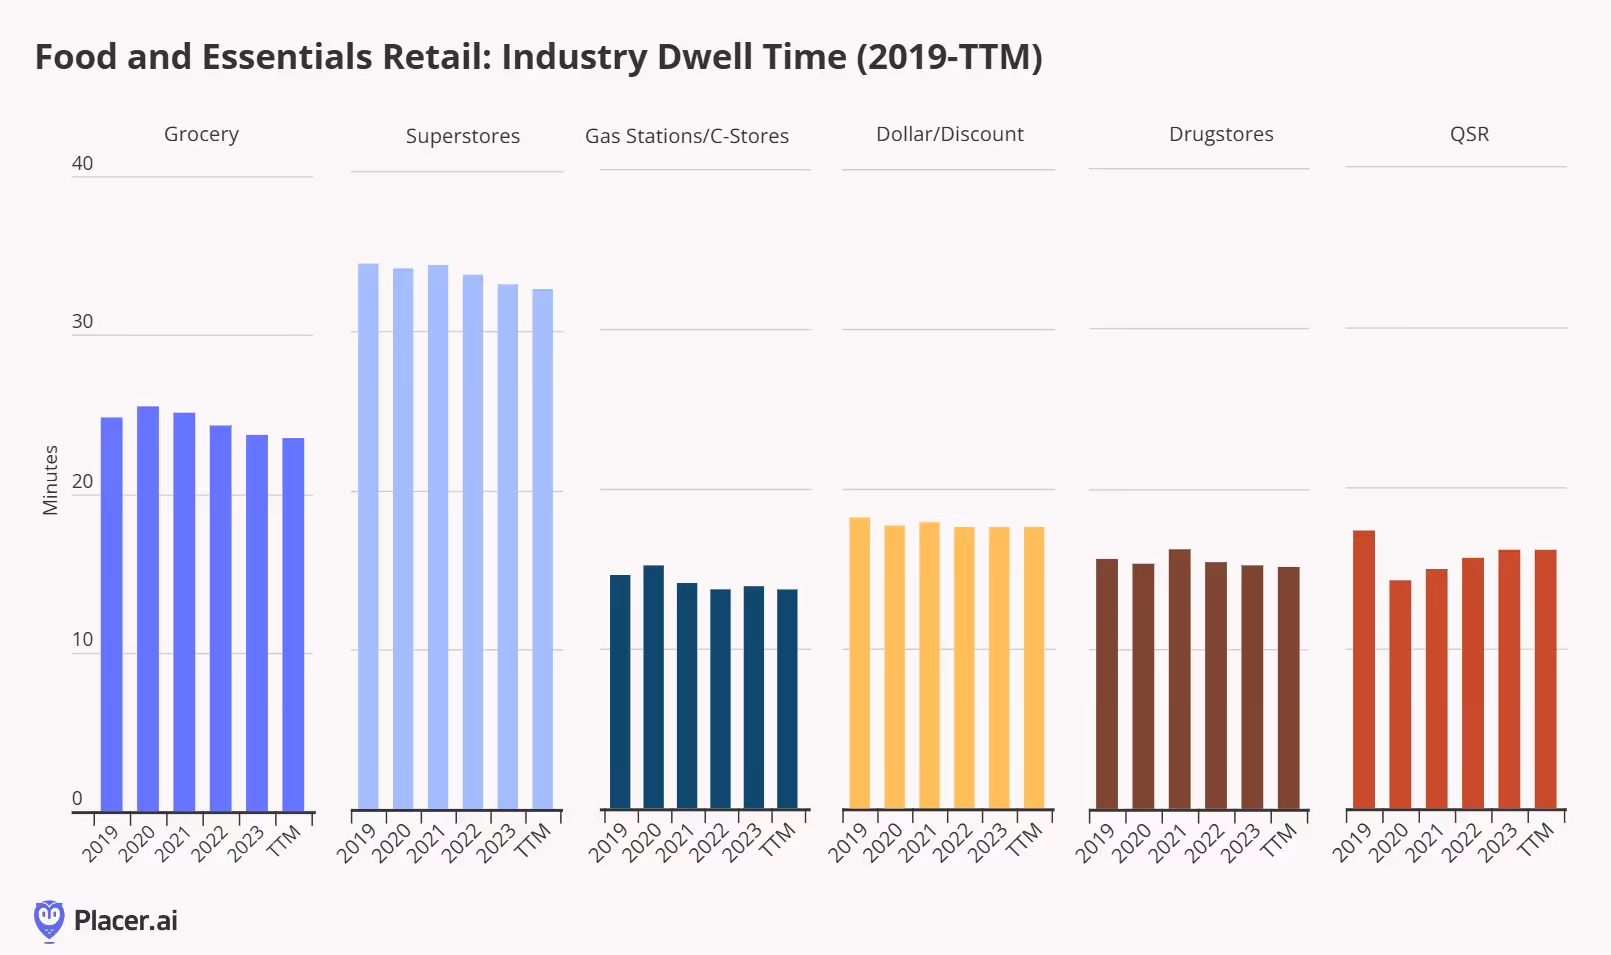
We also thought we’d assess dwell times across the different food and essentials retail categories (for purposes of this analysis, we’ve removed full-service restaurants, which have gone from an average dwell time of 52 minutes in 2019 to 49 minutes over the past twelve months, although we continue to see fine-dining chain dwell times exceed pre-pandemic levels as consumers look to maximize their experience when dining out). Here, we also see two callouts: (1) As consumers make food purchases across a wider number of channels, dwell time has decreased for most, matching the decrease in units per transaction that we've called out in the past. We did see dwell times increase for a few categories during the back half of 2023 which we believe was due to consumers engaging in price comparisons, but this has reversed in 2024 as consumers have now solidified new shopping routines (i.e., knowing what stores to get what deals); and (2) QSR dwell time remains below pre-pandemic levels, which isn’t surprising given that a higher percentage of transactions are now taking place via drive-thru and takeout orders. However, the increase in dwell time the past few years also suggests the potential for improved drive-thru optimization, a topic we recently analyzed.


.avif)

.avif)

