Thanks for Visiting!

Register for free to get the full story.

Sign Up
Already have a Placer.ai account? Log In
Article

Location Intelligence On Display: A Look at Los Angeles's Top Museums

Discover visitation trends and demographics of top Los Angeles museums that attract both locals and tourists.

By 
Ezra Carmel
April 18, 2025
Location Intelligence On Display: A Look at Los Angeles's Top Museums
SHARE
Explore our free tools to get timely insights into key industries
Check out the latest trends for
No items found.
Key Takeaways
  • Most of the Los Angeles museums analyzed saw an uptick in visits in the summer, with visits peaking in July. The La Brea Tar Pits and Museum and The California Science Center received the largest July 2024 visit surges (51.6% and 48.7% above their monthly averages, respectively).
  • Griffith Observatory, with panoramic views of the city, was highly popular with out-of-town visitors in 2024 – 48.7% of its guests came from 250 miles away or more.
  • All of the LA museums analyzed received traffic from higher-income trade areas when compared to the nationwide benchmark, likely due to the relative affluence of the Los Angeles area. The Getty and The Museum of Contemporary Art had the highest captured trade area median HHIs at $107.2K/year and $103.7K/year, respectively.

Los Angeles is famous for its film and music industry, but the city also boasts several world-class museums that educate and entertain local visitors and tourists alike. We dove into the data for several of LA’s top museums in order to examine the visitation patterns and demographics of museum goers in the City of Angels. 

Year-Round Museum Visits 

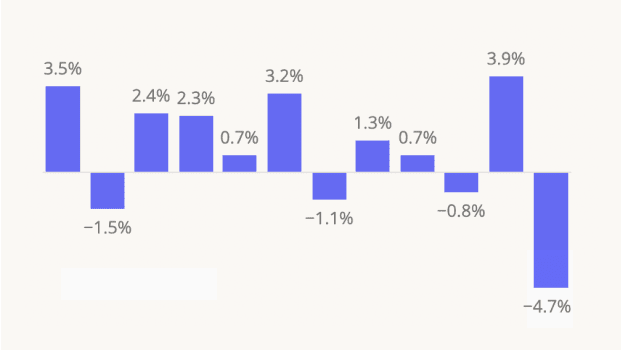
Analyzing monthly visits to the top LA museums over the past 12 months reveals that although most receive a visit boost in the spring and summer, each institution has a unique seasonal visit pattern. 

The California Science Center and La Brea Tar Pits and Museum received the largest July visit surges, likely due to heavy traffic from young families on vacation. Meanwhile, The Petersen Automotive Museum received the largest December visit spike, perhaps due to a boost from private holiday events. And The Museum of Contemporary Art appears to have maintained a steady flow of visitors – experiencing a relatively muted summer uptick, but relatively robust visits in the fall.

Museum Guests From Near and Far

Diving further into the data reveals that LA museums are particularly popular with hyper-local visitors and with out-of-towners: Every museum analyzed received large shares of visitors from less than 30 and/or from more than 250 miles away, with fewer visitors coming from 30-250 miles.

The California Science Center received the greatest share of visitors residing less than 30 miles (60.7%) from the museum, perhaps due to its popularity with educational groups and its location in bustling Exposition Park

Griffith Observatory, with views of the Hollywood sign and Los Angeles's urban landscape, was highly popular with out-of-town visitors – 48.7% of guests resided at least 250 miles away. And as a unique active fossil excavation site, La Brea Tar Pits and Museum was also favored by out-of-town visitors (42.9% of guests came from 250+ miles away). 

Guest Demographics

The relatively high shares of out-of-town visitors at most LA museums analyzed highlights the role that tourists play in supporting LA’s cultural institutions. And diving into the median HHI in the museums’ captured market reveals that these out-of-towners may represent a particularly desirable audience.  

In general, the museums analyzed tend to attract a relatively wealthy audience. In 2024, the median household income (HHI) in all the analyzed museums’ captured market trade areas was higher than the median HHI nationwide ($79.6K/year) – perhaps due to California’s relatively high median HHI of $99.3K/year. Most museums also drove traffic from regions with a higher median HHI than the state benchmark – likely due to the relative affluence of the Los Angeles area. The Getty and The Museum of Contemporary Art’s captured trade areas had the highest median HHIs, at $107.2K/year and $103.7K/year, respectively.

But when analyzing only out-of-town visitors (who traveled 250 miles or more), the median HHIs of the captured trade areas increased – indicating that out-of-town museum guests were more affluent than local ones. This suggests that tickets to special exhibitions could be set at higher price points during peak seasons when more out-of-town guests are anticipated.

Final Stop

Though there are similarities between the behavior and demographics of visitors to LA’s museums, they each experience somewhat distinct seasonal visit patterns and attract diverse audiences. With the busiest museum season ramping up, cultural institutions stand to gain from understanding the changing characteristics of their guests.

For more insights, visit Placer.ai.

Learn how downtown regions across US cities are measuring up with our free tools.
Check out the latest trends for
No items found.

Related Topics

Stay Anchored: Subscribe to Insider & Unlock more  Insights
Subscribe
SHARE
Get 3 brand & industry
breakdowns every week
Subscribe to the newsletter
Oops! Something went wrong while submitting the form.

Get a Demo

Please enter your first name
Please enter your last name
Please provide a valid email
Please enter your email
Please enter company name

Thanks for reaching out!

One of our experts will be in touch soon

Try Placer.ai Free
Oops! Something went wrong while submitting the form.

Get 3 brand & industry breakdowns every week

Subscribe to the newsletter
INSIDER
Stay Anchored: Subscribe to Insider & Unlock more Foot Traffic Insights
Gain insider insights with our in-depth analytics crafted by industry experts
— giving you the knowledge and edge to stay ahead.
Subscribe
Text Link
Museums
Gap & Ulta Traffic Rebound After Tough Start to 2025
Can Chili’s Repeat its 2024 Success in 2025? 
Dollar Stores: Stability in The New Year
How Did Consumers Celebrate Mother's Day 2025?
Off-Price And On Point
Department Stores in 2025: A Mid-Year Recap
Boot Barn Still Growing in 2025
Wholesale Clubs Find Success in Q1 2025 
Lowe’s and The Home Depot: Weathering Q1 Storms and Looking to the Horizon
QSR Q1 2025 Final Thoughts
Placer.ai April 2025 Office Index: Recovery Apace
How Are Coachella Crowds Evolving? 
Broad Pickins’ for Big Chicken
Placer.ai Mall Index: Traffic Up Across All Mall Formats 
The Untapped Potential of Class-B Malls 
First Watch Traffic Continues to Climb 
Warby Parker and Allbirds: Stabilization Trends Into 2025
Resilience 5 Years Post-Covid:  Spotlight on Victoria Gardens in Rancho Cucamonga, CA
Self-Storage: Resilience in 2025
Aldi & Lidl's Winning Formula
Dutch Bros Gains, But Starbucks Holds Top Spot
Love in the Time of Bookstores
CAVA and sweetgreen Take to the Suburbs
The Impact of QSR Promotions in Q1 2025
Sinners Fuels Movie Theater Momentum
Health-Centric Grocers Lead the Way 
Crafting a Goodbye: What Location Analytics Reveals About JOANN’s Departure
All The Things I Think I Think About Retail Over The Last Quarter
What Visitation Data Reveals About Industrial Manufacturing Demand Ahead of Tariffs
McDonald’s & Chipotle Q1 2025 Recap
Location Intelligence On Display: A Look at Los Angeles's Top Museums
3 Insights Into the Shopping Habits of Older Consumers 
Placer 100 Index, March 2025 Recap – Which Chains Weathered the Storm? 
The Post-Pandemic Retail Evolution: A look back on the last five years
Orlando Theme Park Wars Heat Up 
Albertsons Analysis: Stable Start to 2025
What Visitation Data Reveals About Consumer Behavior Ahead of Tariff Implementation
Block-Buster Alert: A Minecraft Movie Placer Byte
Placer.ai March 2025 Office Index: Back to Recovery
Q1 2025 Quick-Service and Fast-Casual Recap
Retail & Dining Q1 2025 Recap: Budget-Friendly Segments Shine 
Placer.ai March 2025 Mall Index: Visits Rebound 
Meal Prep Madness: Wild Fork Foods and Clean Eatz
Dave & Buster’s Ups Its Game
Coffee Visits: Perks in The Segment 
The Dining Habits of College Students
Old Navy's Foray Into Occasionwear
JonasCon Brings Even More Experiential to American Dream 
What Happened to Family Dollar? 
The Impending Transformation of Bev-Alc Retail
CVS and Walgreens in 2025
Target’s Bet on Babies 
The Changing Apparel Landscape in 2025
Trader Joe’s and Aldi’s Continued Success
Retailers Betting on High Income Households
Brooks Brothers Rightsizing Success
The Rise of Smaller-Format Home Improvement Retailers: How Ace Hardware and Harbor Freight Are Outpacing Big-Box Chains
Walmart’s Mall Purchase: Towards a More Diversified Portfolio 
Placer.ai Named One of America’s Best Startup Employers 2025 by Forbes
Darden Weathers the Storm
Diving Into Breakfast Chains: What “Eggs”actly is Going On With Eggs Right Now? 
Placer 100 Index, February 2025 Recap 
Why Chipotle’s 2025 Outlook Looks Conservative
Sportswear in the New Year
Placer.ai February 2025 Office Index: Is The Recovery Stalling? 
Discount and Dollar Stores in a Strong Position to Start 2025
Placer.ai Mall Index: February 2025
Allbirds: Flying Towards New Opportunities
Beauty Retail: Changes, and Challenges Ahead
Who Attends the Super Bowl and the Daytona 500?
The $1B Question: Why Dave’s Hot Chicken Is a QSR Powerhouse
Kroger’s Grocery Dominance in 2025
Walmart Goes to the Mall: Insights From the Monroeville Acquisition
Gap Inc. in 2025 – Recapping 2024 and Uncovering Banana Republic’s Athleisure Opportunity 
Department Stores Providing Value in Today’s Retail Landscape
Dine Brands Maintains Their Broad Appeal
Best Buy: Fully Charged for 2025
Shopping Centers Provide Havens for Residents Affected by the LA Fires
National Retail Chains Utilize Stores to Support LA Fire Relief Efforts
Dutch Bros. & Sprouts: Beverage-Led Success
Off-Price Apparel: Off to a Strong Start in 2025
Visitation Trends and Shopping Behaviors at Walmart & Target 
Restaurant Success in 2025: Experience, Convenience, and Familiarity
Home Improvement Segment Shows Stability
Fitness Starts Strong in 2025
The Meat of the Matter: Bloomin’ Brands in 2024
The Beat of the Bowl: Visitation Patterns for CAVA and sweetgreen
Women's Sports on a Roll: Packed Stadiums, The Sports Bra Bar & Restaurant, and Impacting CRE
Year of the Dragon, Luckiest Animal in the Zodiac: Will that Luck Hold for Asian-Themed CRE?
What First Half 2024 Visit Trends Tell Us About What to Expect in the Second Half
What Does Walmart’s Results Mean for Other Discretionary Retailers?
Warehouse Clubs: Younger Visitors Support Growth
Wayfair: Early Impressions from Wayfair's New Wilmette Store
We're All Mad for March Madness: NCAA Women's Basketball is Breaking All Sorts of Records
Warehouse Clubs: Finding the Perfect Timing
The Sweet Smell of Success: How CPG Brands are Bringing Their Brands to Life with Experiential Stores
Urban Outfitters: High Income, Specialty Fleets Still Thriving
Takeaways from the 2024 Fast Casual Executive Summit
The Lure of Waikiki and Beyond: The Feel of Fifth Avenue on Oahu?
Target: Circle Week Shows Signs of Success