

Key Dutch Bros Metrics
We’ve previously highlighted Dutch Bros. as one of retail’s breakthrough stories during the pandemic, but the company’s 1Q22 update raised concerns about slowing sales trends and rising cost pressures. While there is increasing evidence that inflation is becoming more of an issue for restaurant operators and consumers, we believe the more relevant takeaway for CRE executives is that data still supports Dutch Bros’ longer-term unit aspirations.
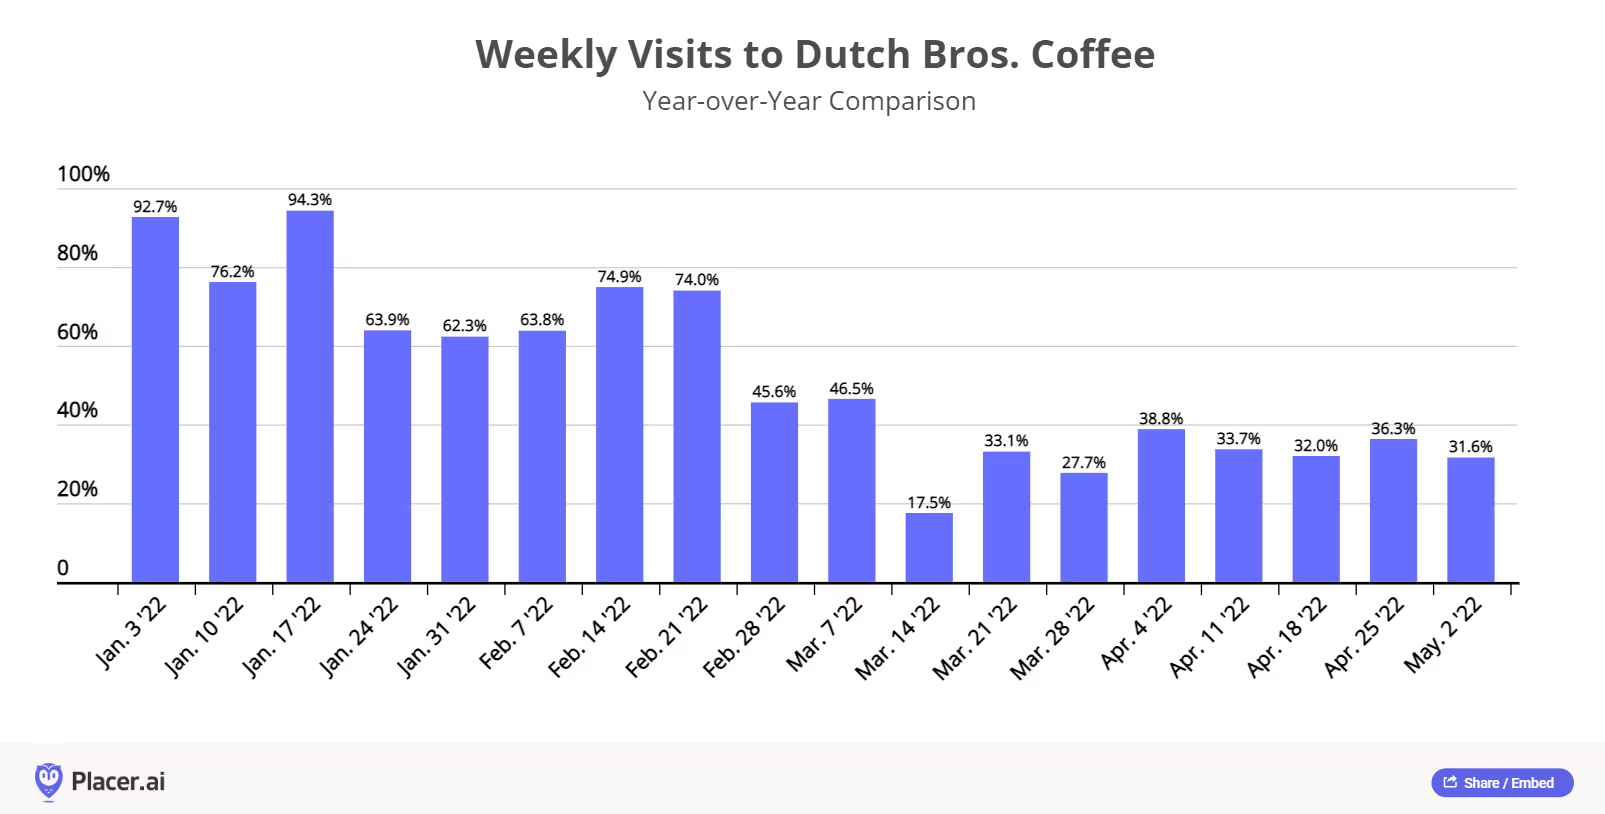
- Assessing recent visitation trends. Dutch Bros systemwide same-shop sales grew 6% in the first quarter and 11.1% compared to 2019, while company-operated same-shop sales grew 5.1% in the first quarter and 9.9%compared to 2019. Management attributed the growth to higher traffic and check that was partially offset by sales transfer as more new shops in existing markets opened. Placer data confirms that trends were stronger in the first half of the quarter before tempering in mid-March (below), which management believes were driven by macroeconomic headwinds related to decreasing consumer discretionary income such as rapidly rising gas prices and the discontinuation of federal stimulus checks. Dutch Bros. expects 2Q22 comps to be flat to slightly negative, with April comps down -3.7% Y/Y compared to 22.6% in the same period a year ago (the most difficult comparisons from a year ago).
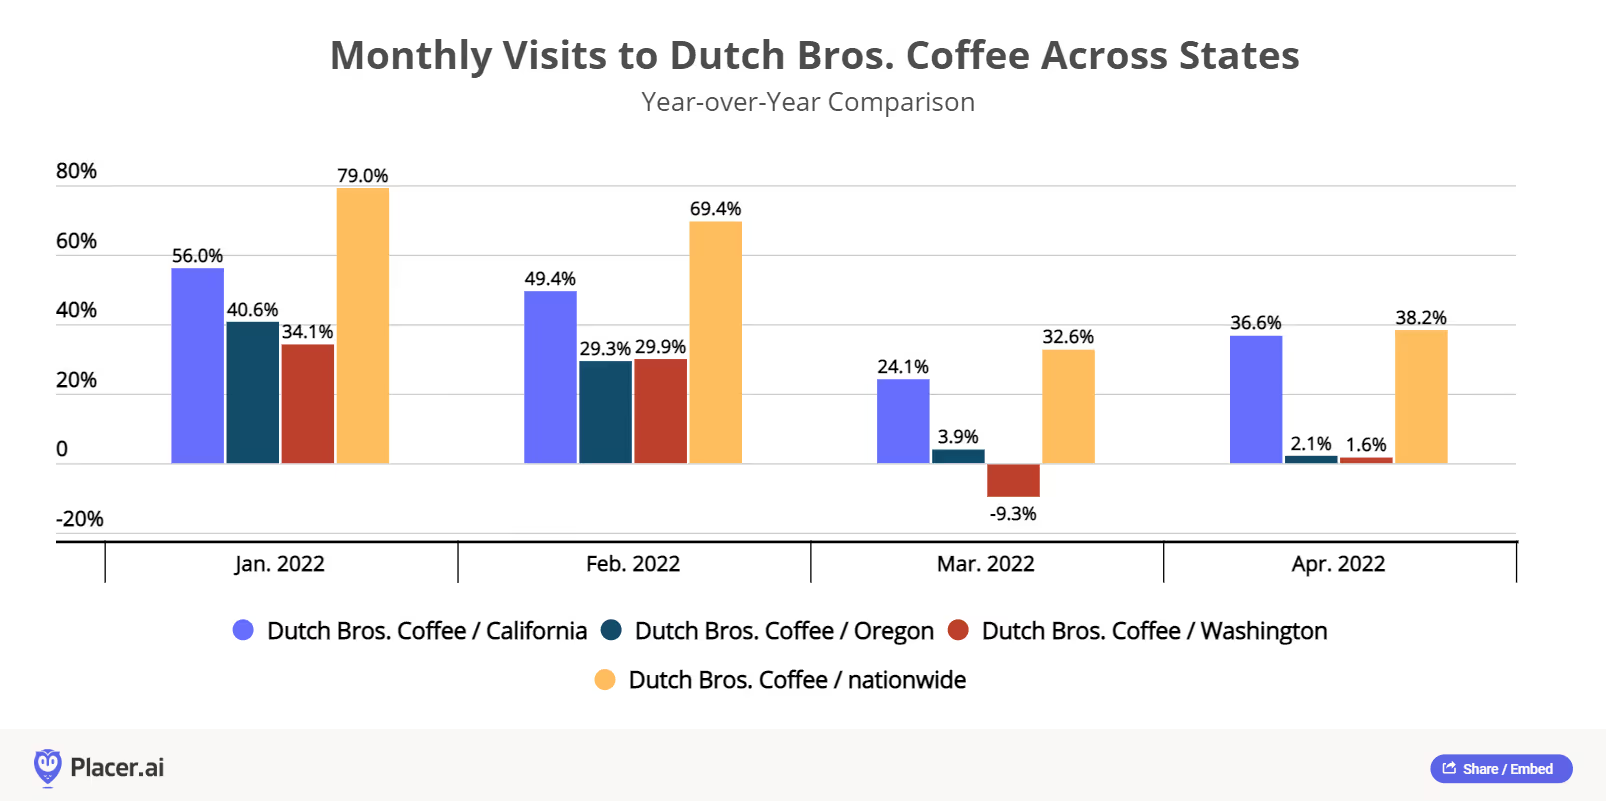
- Placer data reinforces management commentary about gas prices impacting consumer behavior. Dutch Bros management offered two pieces of evidence supporting its view that macro headwinds are impacting results. The first is that the chain has seen slower sales growth in markets where gas prices are highest. Placer data validates this stance, as Dutch Bros visitation trends in three states where the average price of gas exceeds $5 per gallon according to GasBuddy (California, Oregon, and Washington) have experienced year-over-year visitation trends lagging the chain’s national average (below).
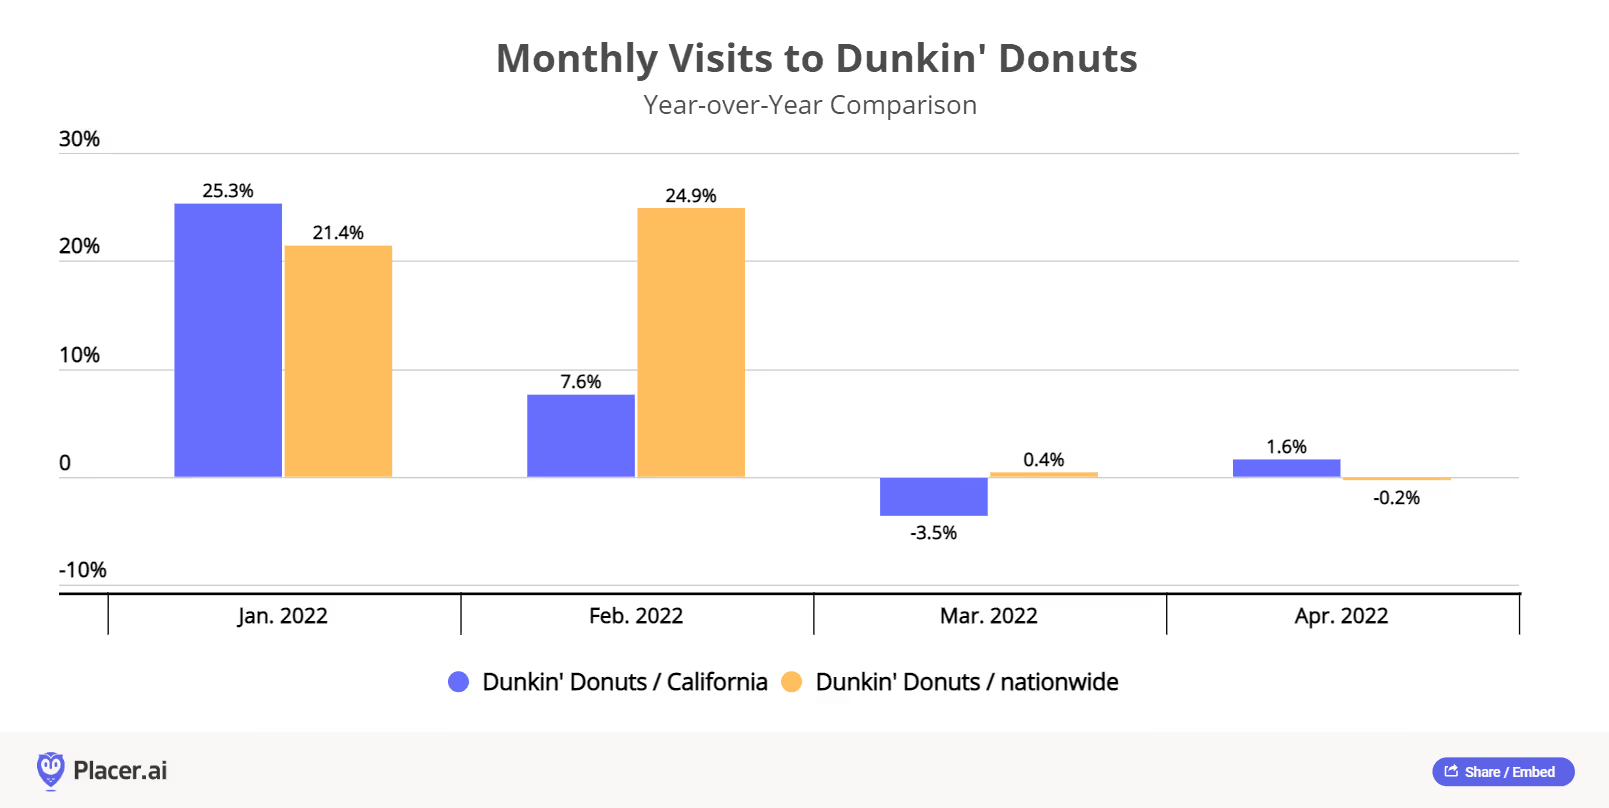
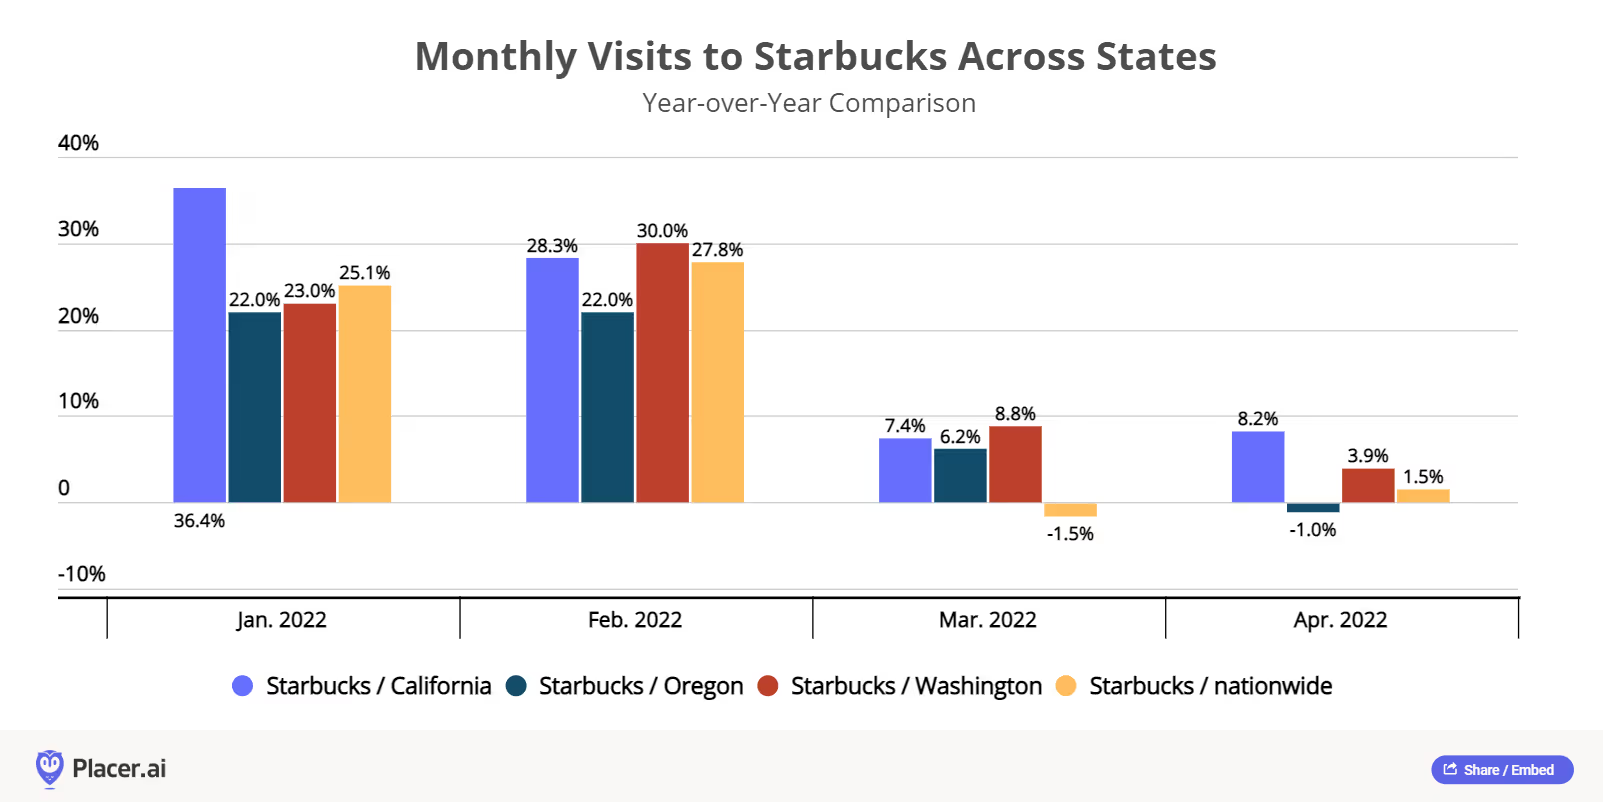
- We also looked at visitation trends for two of Dutch Bros closest competitors in these markets (Starbucks and Dunkin) to rule out any company-specific factors. Our data suggests that Dunkin’s California locations started to underperform the chain’s systemwide in February, which lends more credibility to management’s views about the impact of inflation on consumer behavior (Dunkin and Dutch visitors have roughly equal household incomes at$61K and $62K, respectively). Interestingly, while visitations have also slowed in these states for Starbucks, they remain ahead of the chain’s national average, which we attribute to higher household income levels as well as new format openings (which we discussed last week).
- Afternoon daypart also sheds light on changing consumer behavior. Dutch Bros also noted that the afternoon daypart–where sales trends typically have a higher correlation with discretionary income–has become more “restricted” and is what you would expect "when people are starting to choose between what they've got left over in their wallet at the end of the month and choices around spending.” Placer data confirms a small drop-off in Y/Y visitation trends between 12 PM-3 PM across the system the past several months.
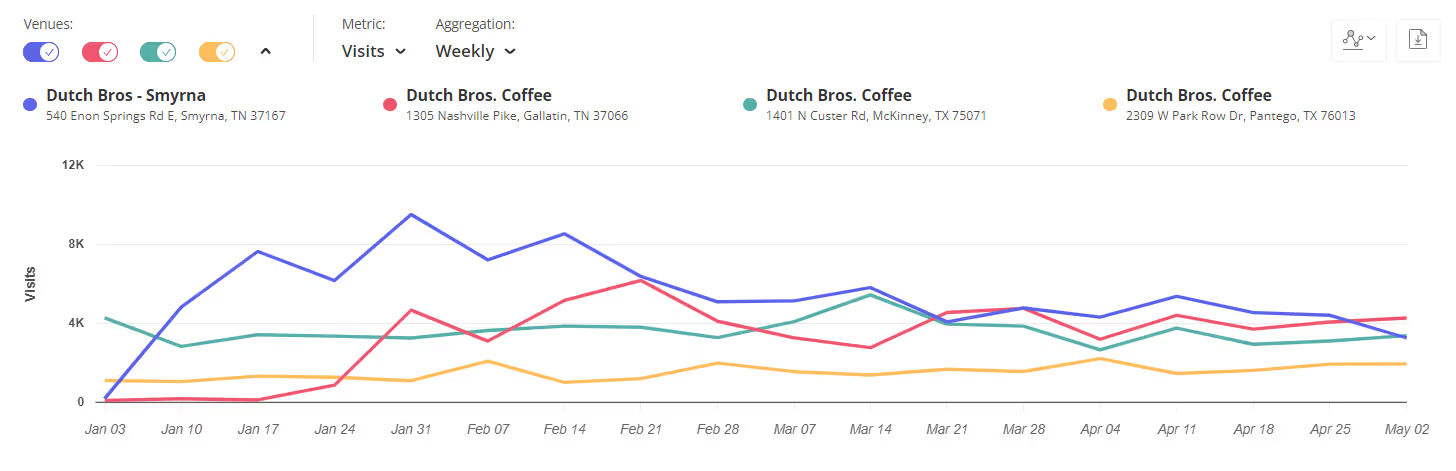
- New store trends remain strong. Despite inflation and consumer behavior concerns, the most important development from Dutch Bros’1Q22 update from a CRE perspective may have been management accelerating its new store development goals for the full year to at least 130 locations (110 shops company-operated), up from 125. Management cited the strength of ROI for recent openings as the rationale for the increase. Placer data reinforces this point, as visitation trends for two of the first locations opened in Tennessee (Smyrna and Gallatin) are strong and actually seeing weekly visits ahead of some of its initial locations in the Dallas-Fort Worth market opened last year (below).
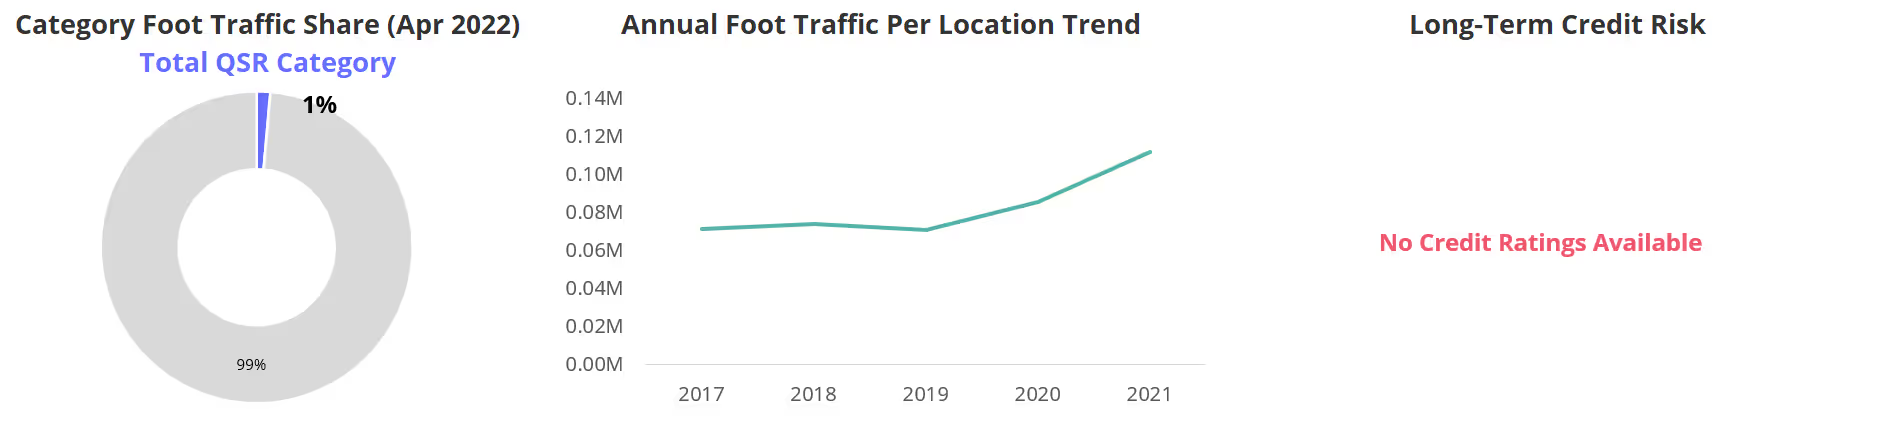
- Combined with visit per location trends that remain well ahead of pre-pandemic levels(below) and lower coffee visitation trends as a percentage of dining visits in many of its nascent markets, Dutch Bros pipeline appears strong and we believe the chain remains on track toward longer-term goal of 4,000 units over the next 10-15 years.