


.svg)


Carter’s Inc., owner of the OshKosh B’gosh and Carter’s baby and children’s clothing brands, is a major player in the nation’s $28 billion children's clothing industry. As of the end of 2023, the company boasted nearly 800 physical stores throughout the U.S. And after closing hundreds of stores in 2020, the brand is back to betting big on brick-and-mortar – with plans to open some 250 new U.S. locations by 2027.
How is Carter's faring in 2024? We took a closer look to find out.
Children's Clothing Creates Crowds
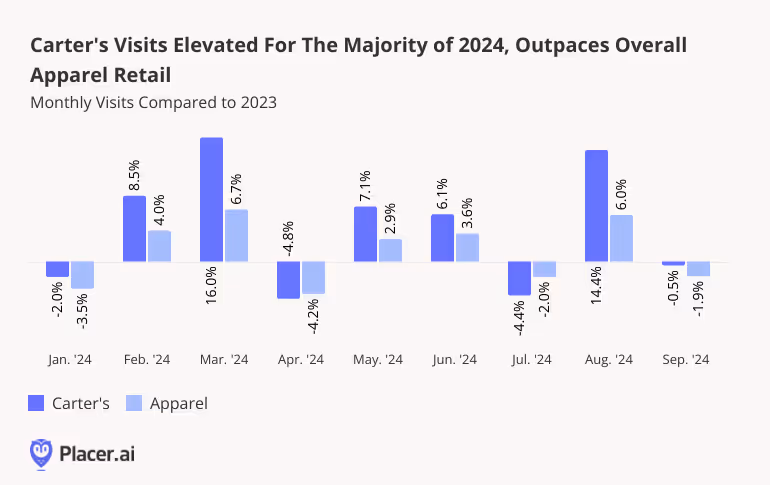
Discretionary spending cutbacks and the rise of online shopping have weighed on apparel retailers in recent years. But some clothing chains – including Carter’s – are bucking the trend. Between January and September 2024, monthly visits to Carter’s stores generally outpaced the wider apparel industry, with some months posting double-digit growth.
March and August 2024 saw respective YoY visit increases of 16.0% and 14.4%, likely driven by pre-Easter and back-to-school shopping. (March and August 2024 each also had one more Saturday than March or August 2023 – a busy day for clothing stores.) And Carter’s finished out Q3 2024 with a 4.3% YoY visit increase, even as the broader apparel category saw just a minor 0.8% uptick.
Baby Sale Boom
Indeed, examining weekly foot traffic to Carter's highlights the seasonality of the company’s visitation patterns. Visits are typically lower during the colder winter months but pick up in anticipation of Easter and spring break – likely encouraged by spring sales held by the brand.
Carter’s real spike, however, comes during the back-to-school season, when parents head to the store to pick up new clothing for the school year – and when Carter's holds major back-to-school sales. During the week of August 5th, foot traffic surged to 29.5% above the year-to-date (YTD) weekly visit average. And with the holiday season fast approaching – including major retail milestones like Black Friday and Super Saturday – the children's retailer appears poised to enjoy continued success.

Family Friendly Fashion
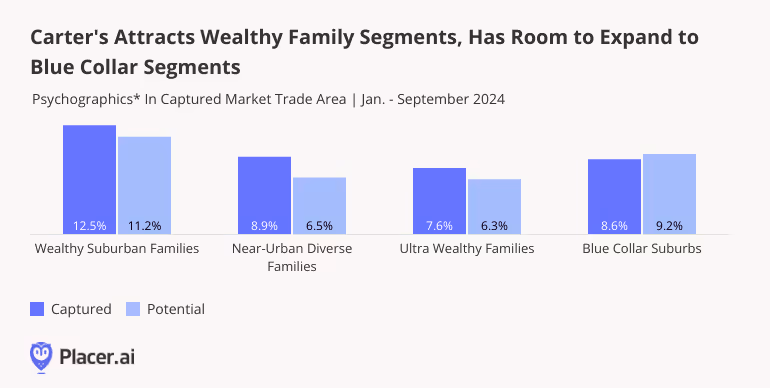
Unsurprisingly, Carter's attracts family segments to its stores, and over-indexes for wealthy and suburban family markets.
Using the Spatial.ai: PersonaLive dataset to analyze Carter's trade areas reveals that, on a nationwide level, the company’s captured market has higher shares of wealthy and suburban consumer segments than its potential one. (A chain’s potential market is obtained by weighting each Census Block Group (CBG) in its trade area according to population size, thus reflecting the overall makeup of the chain’s trade area. A business’ captured market, on the other hand, is obtained by weighting each CBG according to its share of visits to the chain in question – and thus represents the profile of its actual visitor base).
Between January and September 2024, the shares of “Wealthy Suburban Families” and “Ultra Wealthy Families” in Carter's captured market stood at 12.5% and 8.9%, respectively – outpacing the company’s potential market shares. This highlights Carter's’ success in attracting these high-income family segments. Meanwhile, households hailing from “Blue Collar Suburbs” were underrepresented in Carter's captured market compared to its potential one. This suggests that, as Carter’s continues to open stores, targeting blue collar suburban areas may pay off for the brand.
Kid-Sized Summary
Carter's is managing not just to survive, but to thrive. After closing stores during the pandemic, the company is back with full force, driving visits and maximizing high-traffic periods.
Will Carter's continue to outpace the wider apparel category during the upcoming holiday season?
Visit Placer.ai to keep up with the latest data-driven retail insights.
This blog includes data from Placer.ai Data Version 2.1, which introduces a new dynamic model that stabilizes daily fluctuations in the panel, improving accuracy and alignment with external ground truth sources.


.avif)


