Thanks for Visiting!

Register for free to get the full story.

Sign Up
Already have a Placer.ai account? Log In
Article

Albertsons Q3 Check-In

Discover the overall trends driving visits to Albertsons-owned grocery chains nationwide.

By 
Bracha Arnold
October 7, 2024
Albertsons Q3 Check-In
SHARE
Explore our free tools to get timely insights into key industries
Check out the latest trends for
Key Takeaways
  • In Q3 2024, overall visits to Albertsons banners – analyzed as a whole – declined ever so slightly relative to 2023, but showed significant growth (10.8%) compared to 2019. 
  • Holidays and other retail milestones drive significant visit spikes at Albertsons - positioning the company to enjoy significant traffic increases during the upcoming holiday season. Compared to a year-to-date (YTD) weekly average, the company’s banners saw substantial visit boosts during the weeks of Valentine’s Day (4.0%), Easter (7.1%), Mother’s Day (10.8%), and Independence Day (14.1%).  
  • Wealthy and suburban consumer segments are more likely to visit Albertsons brands than younger consumer segments, suggesting that the company has room to reach out to these segments. 

Albertsons Companies is one of the largest grocery holding companies in the U.S., operating over a dozen regional grocery banners and serving millions of shoppers across the country. 

With such a broad presence, the brand caters to a highly diverse customer base – but some overall trends can be observed on a nationwide scale. We took a closer look at the overall visitation patterns the brand experienced in Q3 2024 and dove into the demographics of some of its largest markets.  

Holding Onto Gains

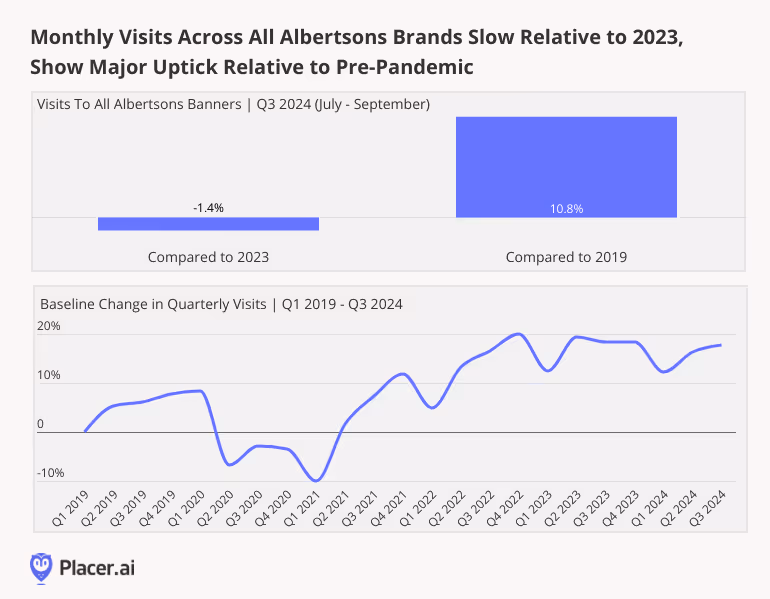
Year over year (YoY), Q3 2024 visits to Albertsons’ banners dropped 1.4% compared to the equivalent period of 2023, possibly reflecting the ongoing financial strain consumers face amid rising grocery prices. Despite this, visits to the company’s chains were significantly higher than pre-pandemic, with Q3 2024 visits up by 10.8% compared to 2019.

Analyzing quarterly visits to Albertsons’ banners relative to a Q1 2019 baseline further highlights the chain’s firm long-term positioning. After dropping during the pandemic, visits increased steadily through Q4 2022 – and have held steady since, despite the challenges facing traditional grocery stores over the past two years. This indicates that even in the face of the growing competition posed by online and value grocers, Albertsons has succeeded in holding onto gains and maintaining its standing within the sector.

Monthly visits at Albertson brands compared to 20233, 2019 and a baseline change since Q1 2019 shows consistent growth with some slowdown in the last year

Sale Events Drive Traffic Across All Banners

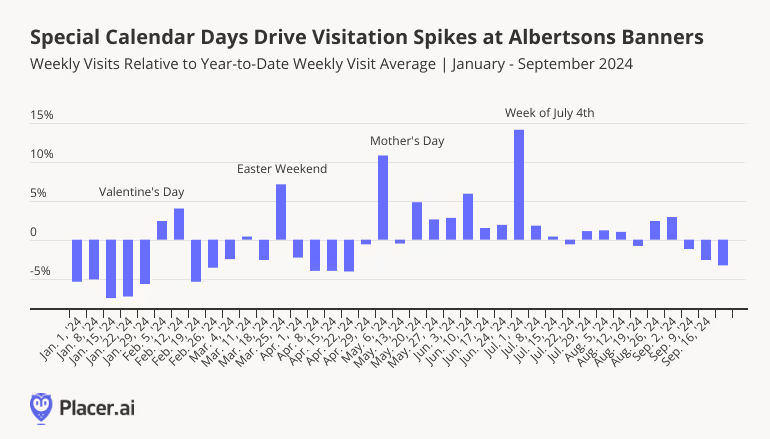
While major holidays like Thanksgiving and Christmas are known for driving grocery visits, other key dates also spark significant foot traffic across Albertsons’ banners. For instance, during the week of July 1, 2024, visits to the company’s portfolio spiked by 14.1% compared to the year-to-date (YTD) weekly visit average, as customers flocked to stores for July 4th weekend supplies.

Mother’s Day also drove significant foot traffic, with visits during the week of May 6, 2024 rising 10.8% above the YTD average. So with Halloween, Turkey Wednesday, and Christmas just around the corner, Albertsons appears poised to enjoy a busy holiday season.

Weekly visits relatively to visit average shows spikes on special calendar days: valentines, easter, mothers day and 4th of July

Albertsons’ Customer Base: Wealthier, Suburban Shoppers

Albertsons’ extensive reach means that it attracts a broad spectrum of consumers, but overall, the company tends to over-index for wealthier and suburban markets. 

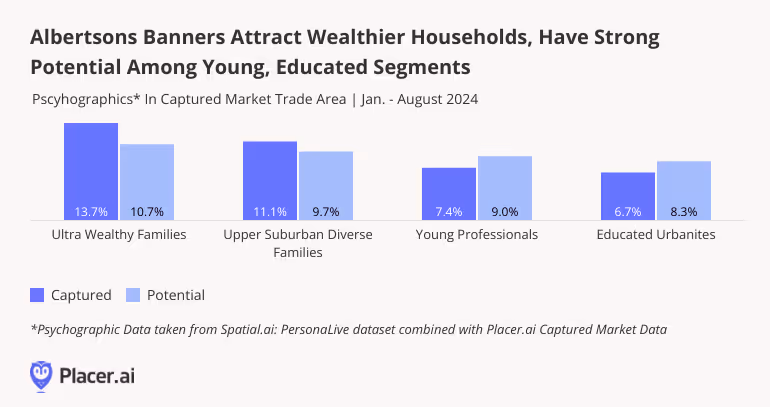
Using the Spatial.ai: PersonaLive dataset to analyze Albertsons' trade areas reveals that, on a nationwide level, the company’s captured market has higher shares of wealthy and suburban consumer segments than its potential one. (A business’ potential market is obtained by weighting each Census Block Group (CBG) in its trade area weighted according to the size of its population. A business’ captured market, on the other hand, is obtained by weighting each CBG according to its share of visits to the chain or venue in question – and thus represents the profile of its actual visitor base). 

During the first eight months of 2024, for example, the share of “Ultra Wealthy Families” in Albertsons’ captured market stood at 13.7%, higher than the company’s potential market share of 10.7%. This suggests that from within the overall trade areas served by Albertsons, the chain is especially successful at attracting this affluent demographic.  

On the flip side, consumer groups like “Young Professionals” and “Young Urban Singles” were underrepresented in Albertsons’ captured market compared to its potential one. This signals potential growth opportunities for Albertsons, as they could expand their appeal to younger, city-based segments.

Captured vs. potential markets of wealther households and young professionals showing Albertson banners attract wealthier households and have potential to tap into the younger markets more

Final Thoughts

Albertsons continues to offer something for everyone, enjoying visit boosts offered by special calendar days and growing its foot traffic relative to pre-pandemic.

For the latest data-driven grocery insights, visit Placer.ai.

This blog includes data from Placer.ai Data Version 2.1, which introduces a new dynamic model that stabilizes daily fluctuations in the panel, improving accuracy and alignment with external ground truth sources.

Learn how downtown regions across US cities are measuring up with our free tools.
Check out the latest trends for

Related Topics

Stay Anchored: Subscribe to Insider & Unlock more  Insights
Subscribe
SHARE
Get 3 brand & industry
breakdowns every week
Subscribe to the newsletter
Oops! Something went wrong while submitting the form.

Get a Demo

Please enter your first name
Please enter your last name
Please provide a valid email
Please enter your email
Please enter company name

Thanks for reaching out!

One of our experts will be in touch soon

Try Placer.ai Free
Oops! Something went wrong while submitting the form.
INSIDER
Stay Anchored: Subscribe to Insider & Unlock more Foot Traffic Insights
Gain insider insights with our in-depth analytics crafted by industry experts
— giving you the knowledge and edge to stay ahead.
Subscribe
L.L.Bean’s Legacy Products Continue to Excite New Shoppers
Service Shift Pays Visit Dividends for Staples
Placer.ai Office Index: June 2025
Potential Tariffs Impact Shopper Behavior in the Baby Space
Placer.ai June 2025 Mall Index 
Where Is Domestic Traffic to Airports On the Rise? 
FSR Roundup: Casual and Upscale Dining Thrive
Beyond the Discount: Can Protein and a "Back to Basics" Approach Re-energize Starbucks?
Bahama Breeze’s Bet
June Industrial Manufacturing Update: A Tale of Two Economies in Mid-2025
How Limited Service Is Succeeding in 2025
Big Lots: Back in the Bargain Game
Do Exclusive Offers and Product Scarcity Still Move the Needle for Retail?
Stanford Stadium: The Coldplay Effect
Target's Back to School Comeback Window 
What Lies Behind Nike's Return to a Multi-Channel Strategy?
Capturing Diners With Creative Offers: LTO Home Runs in 2025
How Did the "Yes, JCPenney" Campaign Impact In-Store Traffic? 
Luxury Apparel’s Recent Strength
What's In Store For Back to School 2025? 
Placer.ai May 2025 Office Index 
Local Eats on the Rise
Living Inside America’s Oldest Enclosed Mall: Arcade Providence and the Promise of Mixed-Use
Burger King’s Fire-Breathing LTO Drives Visits
Placer.ai Mall Index: May 2025 & Memorial Day Strength
Coach Keeps Visits Up
DICK’s Sporting Goods Expands Its Audience Reach with Foot Locker Acquisition
Darden Restaurants: Raising the Steaks in 2025
Much Ado About Store Size
Discount & Dollar Stores Emerge as a Front Runner in 2025 
What Can Pharmacy Chains Gain From Rite Aid’s Closures?
Jagalchi Food Hall Opens at Serramonte Center and Crowds Follow
Memorial Day 2025 Consumer Traffic Recap 
Five Below and Ollie’s Continued Foot Traffic Success
Kohl’s: Bright Spots to Build On?
Gauging the Tariff Impact on Manufacturing – May 2025 Update 
Wayfair at Year One – A Go-To Furniture Destination Spot
Who Attended the 2025 Kentucky Derby?
Lululemon and DICK’s: Scoring Big With Celebs and Events
Gap & Ulta Traffic Rebound After Tough Start to 2025
Can Chili’s Repeat its 2024 Success in 2025? 
Dollar Stores: Stability in The New Year
How Did Consumers Celebrate Mother's Day 2025?
Off-Price And On Point
Department Stores in 2025: A Mid-Year Recap
Boot Barn Still Growing in 2025
Wholesale Clubs Find Success in Q1 2025 
Lowe’s and The Home Depot: Weathering Q1 Storms and Looking to the Horizon
QSR Q1 2025 Final Thoughts
Placer.ai April 2025 Office Index: Recovery Apace
How Are Coachella Crowds Evolving? 
Broad Pickins’ for Big Chicken
Placer.ai Mall Index: Traffic Up Across All Mall Formats 
The Untapped Potential of Class-B Malls 
First Watch Traffic Continues to Climb 
Warby Parker and Allbirds: Stabilization Trends Into 2025
Resilience 5 Years Post-Covid:  Spotlight on Victoria Gardens in Rancho Cucamonga, CA
Self-Storage: Resilience in 2025
Aldi & Lidl's Winning Formula
Dutch Bros Gains, But Starbucks Holds Top Spot
Love in the Time of Bookstores
CAVA and sweetgreen Take to the Suburbs
The Impact of QSR Promotions in Q1 2025
Sinners Fuels Movie Theater Momentum
Health-Centric Grocers Lead the Way 
Crafting a Goodbye: What Location Analytics Reveals About JOANN’s Departure
All The Things I Think I Think About Retail Over The Last Quarter
What Visitation Data Reveals About Industrial Manufacturing Demand Ahead of Tariffs
McDonald’s & Chipotle Q1 2025 Recap
Location Intelligence On Display: A Look at Los Angeles's Top Museums
3 Insights Into the Shopping Habits of Older Consumers 
Placer 100 Index, March 2025 Recap – Which Chains Weathered the Storm? 
The Post-Pandemic Retail Evolution: A look back on the last five years
Orlando Theme Park Wars Heat Up 
Albertsons Analysis: Stable Start to 2025
What Visitation Data Reveals About Consumer Behavior Ahead of Tariff Implementation
Block-Buster Alert: A Minecraft Movie Placer Byte
Placer.ai March 2025 Office Index: Back to Recovery
Q1 2025 Quick-Service and Fast-Casual Recap
Retail & Dining Q1 2025 Recap: Budget-Friendly Segments Shine 
Placer.ai March 2025 Mall Index: Visits Rebound 
Meal Prep Madness: Wild Fork Foods and Clean Eatz
Dave & Buster’s Ups Its Game
Coffee Visits: Perks in The Segment 
The Dining Habits of College Students
Old Navy's Foray Into Occasionwear
JonasCon Brings Even More Experiential to American Dream 
What Happened to Family Dollar? 
The Impending Transformation of Bev-Alc Retail
CVS and Walgreens in 2025
Target’s Bet on Babies 
The Changing Apparel Landscape in 2025
Trader Joe’s and Aldi’s Continued Success
Retailers Betting on High Income Households
Brooks Brothers Rightsizing Success
The Rise of Smaller-Format Home Improvement Retailers: How Ace Hardware and Harbor Freight Are Outpacing Big-Box Chains
Walmart’s Mall Purchase: Towards a More Diversified Portfolio 
Placer.ai Named One of America’s Best Startup Employers 2025 by Forbes
Darden Weathers the Storm
Diving Into Breakfast Chains: What “Eggs”actly is Going On With Eggs Right Now?