
Thanks for Visiting!

Register for free to get the full story.

Sign Up
Already have a Placer.ai account? Log In
Article

Placer 100 Index for Retail & Dining: June 2024 Recap

How did the Placer 100 Index for Retail & Dining fare in June 2024? We dove into the data to find out.

Placer 100 Index for Retail & Dining: June 2024 Recap
SHARE
Explore our free tools to get timely insights into key industries
Check out the latest trends for
No items found.
About the Placer 100 Index for Retail & Dining: The Placer 100 Index for Retail and Dining is a curated, dynamic list of leading chains that often serve as prime tenants for shopping centers and malls. The index includes chains from various industries, such as superstores, grocery, dollar stores, dining, apparel, and more. Among the notable chains featured are Walmart, Target, Costco, Kroger, Ulta Beauty, The Home Depot, McDonald’s, Chipotle, Crunch Fitness, and Trader Joe's. The goal of the list is to provide insight into the wider trends impacting the retail, dining and shopping center segments.
Key Takeaways
  • Retail and dining foot traffic, as measured by the Placer 100 Index, continued to trend upwards in June 2024, with year–over-year (YoY) visits up 6.8% – the highest they’ve been this year.
  • Grocery chains were major winners in June 2024, featuring prominently in the YoY rankings for both visits and visits per location. 
  • One grocery favorite that ranked high for both overall visits and visits per location in June 2024 was Texas cult favorite H-E-B. H-E-B’s YoY visit growth appears to have been driven, in part, by an increase in short visits to the chain – likely bolstered by the chain’s well-known prepared food offerings. 

How did the Placer 100 Index for Retail & Dining fare in June 2024? We dove into the data to find out.

Retail and Dining: A Positive Start to Summer

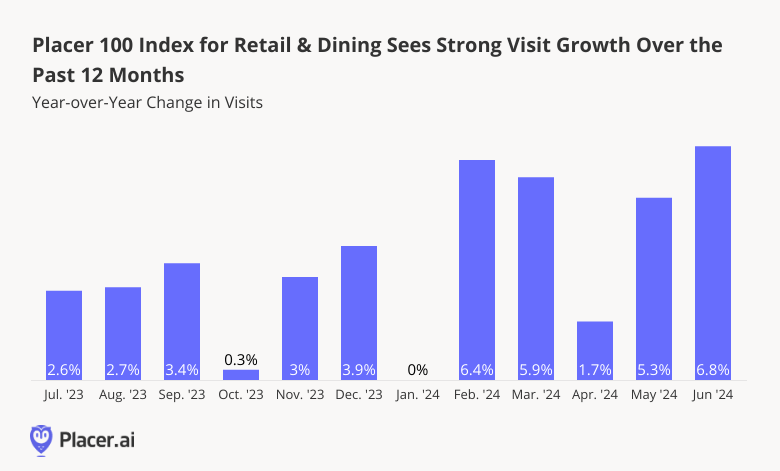
As the first half of the year comes to a close, retail and dining visits continue to demonstrate resilience. Analyzing the YoY foot traffic performance of the Placer 100 Index for Retail and Dining highlights this positive trend, with June visits increasing 6.8% relative to June 2023. This growth follows May 2024's YoY visit growth of 5.3%.

This upward visitation pattern shows that despite continued concerns, consumers are feeling cautiously optimistic about the current economic climate. With back-to-school shopping set to ramp up over the next two months, retail visits may well continue on their upward trajectory.

Placer 100 Index for Retail & Dining Sees Strong Visit Growth Over the Past 12 Months

June’s Grocery Dominance

Drilling down deeper into the data highlights the priority shoppers continue to place on value – with bargain retailers claiming many of the top spots for YoY visit growth. Grocery stores were also major winners in June 2024, likely buoyed by consumers seeking to cut costs by making more of their food at home. 

Three grocery chains ranked among June 2024’s top YoY visit performers: Aldi (28.4%), Trader Joe’s (17.4%) and H-E-B (13.3%). These chains, as well as three others – Food Lion Grocery Store, ShopRite, and Walmart Neighborhood Market – were also among the top performing chains for YoY visits per location. 

Placer 100 Index for Retail & Dining 10 Top Chains

H-E-B: A June Grocery Winner 

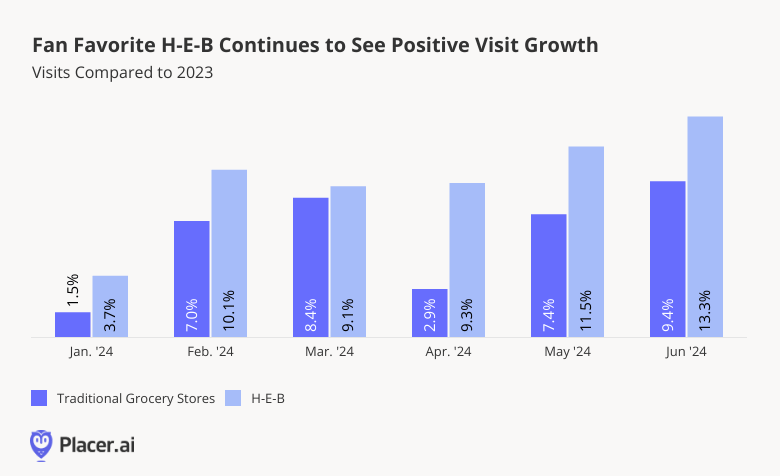
Within the already-strong grocery segment, one chain – H-E-B – continues to prove its staying power. Despite being concentrated in Texas, the chain consistently ranks as one of the most popular grocery chains in the country, as evidenced by its consistently elevated foot traffic.

Since January 2024, YoY visits to H-E-B have increased substantially – outperforming the wider traditional grocery sector. Though very much a full-service supermarket, H-E-B’s foot traffic growth has been more akin to that seen by budget-oriented, limited assortment chains like Aldi and Trader Joe's.

Fan Favorite H-E-B Continues to See Positive Visit Growth

Short Visits Lead The Way

One factor that may be contributing to H-E-B’s ongoing success is its growing role as a purveyor of takeout and inexpensive prepared food options. Many of H-E-B’s grocery stores have in-store restaurants – and the chain also offers a variety of other ready meals and snacks

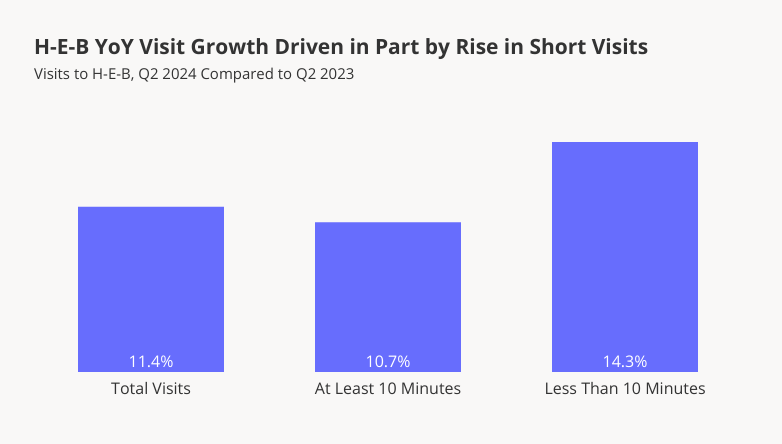
The focus on takeout and convenience food seems to be a solid move for H-E-B, as evidenced by the chain’s YoY increase in short visits – i.e., those lasting under ten minutes. In Q2 2024, short visits to H-E-B increased by 14.3% compared to Q2 2023, while over the same period, longer visits increased by a more modest 10.7%. Some of these quick-stop visitors may be dropping by to grab a snack or to-go meal.  

In recognition of the growing demand for quick-stop grocery and prepared food options, H-E-B has also been making inroads into the c-store space, with a chain of twelve convenience stores recently rebranded as H-E-B Fresh Bites. And as a grocer with its finger on the pulse of what shoppers want, H-E-B appears poised for further success. 

H-E-B YoY Visit Growth Driven in Part by Rise in Short Visits

Strong Positioning Ahead Of Back-To-School Season

As the summer gets underway, retail and dining visitation patterns remain strong – with value chains and grocery retailers leading the way. How will these trends continue to play out throughout the summer? 

Visit Placer.ai to find out. 

Learn how downtown regions across US cities are measuring up with our free tools.
Check out the latest trends for
No items found.

Related Topics

Stay Anchored: Subscribe to Insider & Unlock more  Insights
Subscribe
SHARE
Get 3 brand & industry
breakdowns every week
Subscribe to the newsletter
Oops! Something went wrong while submitting the form.
Recent Publications
INSIDER
Report
5 Markets to Watch in 2026
Find out why Salt Lake City, Reno, Indianapolis, Raleigh, and Tampa are Placer.ai's markets to watch in 2026.
Placer Research
December 5, 2025
Article
Placer.ai November 2025 Office Index: Post-Pandemic Record Occupancy
Driven by stricter RTO mandates and a stabilizing "new normal," November 2025 marked the strongest November office occupancy rates we have seen since 2019.
Shira Petrack
December 11, 2025
3 minutes
Executive Insights
Dutch Bros vs. Dave’s Hot Chicken: The Veteran and the Rookie in America’s Restaurant Expansion Race
Explore how Dutch Bros and Dave’s Hot Chicken showcase two stages of restaurant growth, from explosive expansion to disciplined scaling and strategic maturity.
Kyle Inserra
December 10, 2025
3 minutes
The Anchor Logo
INSIDER
Stay Anchored: Subscribe to Insider & Unlock more Foot Traffic Insights
Gain insider insights with our in-depth analytics crafted by industry experts
— giving you the knowledge and edge to stay ahead.
Subscribe