Thanks for Visiting!

Register for free to get the full story.

Sign Up
Already have a Placer.ai account? Log In
Retail

Ulta Beauty Continues To Shine

We dove into the location intelligence data for Ulta to analyze recent foot traffic performance, explore seasonal trends, and better understand the chain’s visitor base.

By 
Bracha Arnold
March 6, 2024
Ulta Beauty Continues To Shine
SHARE
Explore our free tools to get timely insights into key industries
Check out the latest trends for
No items found.
Key Takeaways

The multi-billion dollar beauty industry has proved to be one of the most resilient retail categories over the past few years – and Ulta Beauty has been one of the biggest beneficiaries of this trend, reporting record growth and experiencing strong foot traffic to its stores. 

We dove into the location intelligence data for Ulta to analyze recent foot traffic performance, explore seasonal trends, and better understand the chain’s visitor base. 

A Blush With Success Year-Over-Year 

The past few years have seen Ulta’s monthly foot traffic growing on a near-constant basis – and 2023 was no exception. Year-over-year (YoY) visits to the chain were up by double digits most months and Ulta consistently outperformed the wider Beauty & Spa segment. The company’s success appears poised to continue in 2024, with January 2024 visits up 4.9% relative to the already impressive January 2023, even as foot traffic to the wider Beauty & Spa category dipped. 

The consistent foot traffic growth Ulta experienced in 2023 and early 2024 is particularly impressive given that 2022 was also a banner year for the brand – meaning that foot traffic has exceeded the previous years’ growth for two years straight. And the company seems to be capitalizing on its success by further enhancing its shopping experience, expanding its presence with new stores, and emphasizing wellness offerings at existing locations to keep its customers coming back.

Holiday Highlights

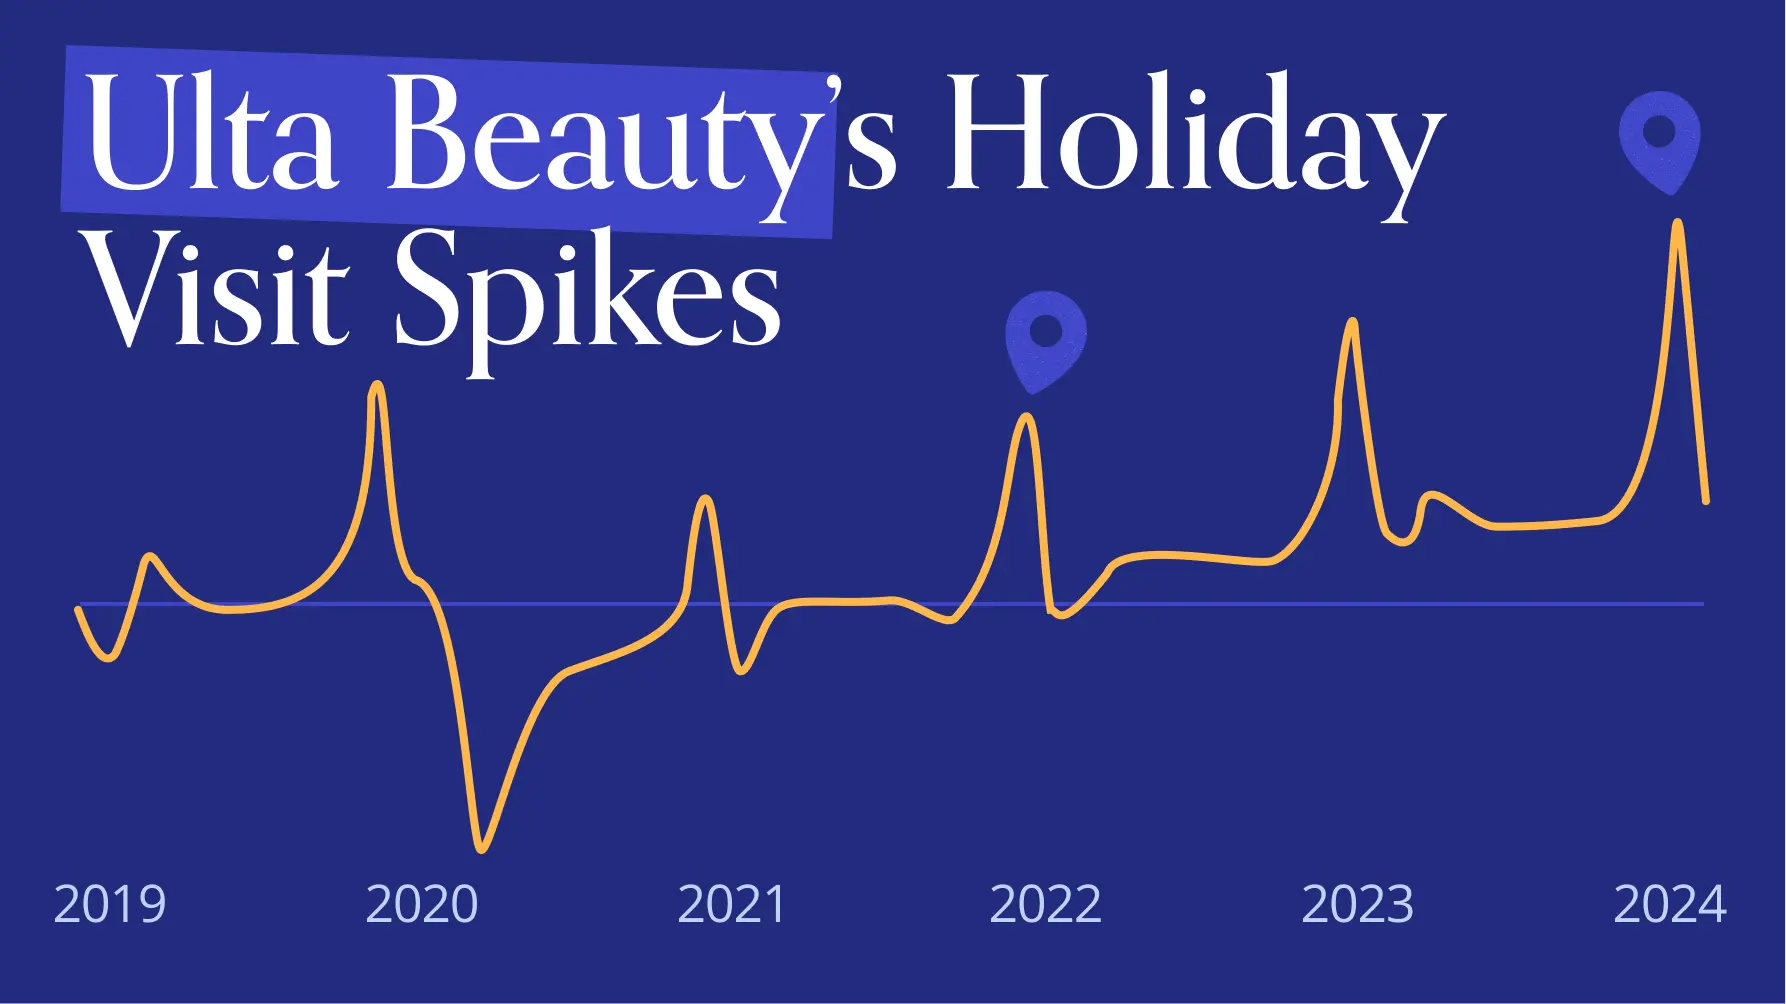
Charting the change in monthly foot traffic to Ulta helps visualize the chain’s seasonal visit patterns and highlight the company’s consistent upward climb since the 2021 retail reopening. The COVID-19 pandemic and ensuing lockdowns led to a steep drop in foot traffic, but visits picked up – and stayed up – as soon as social-distancing restrictions eased. And though inflation replaced the pandemic as an economic concern, Ulta visits continued on their upward climb, highlighting the broad appeal the chain offers to shoppers of all economic levels

Ulta also enjoys significantly elevated visits during the holiday season, with foot traffic surging every December. And visits to the chain, even without a holiday spike, continue to exhibit growth – January 2024’s visits were 43.3% higher than they were in January 2019.

Valentine’s Variances

While December may be the month that Ulta sees the most visits, there are plenty of other minor holidays and retail opportunities that contribute to foot traffic spikes to the retailer. And although Valentine’s Day isn’t a holiday in the official sense of the word, Ulta still enjoyed a mid-week boost in visits on Wednesday, February 14th 2024. 

Visits to Ulta grew 17.2% on Valentine’s Day compared to traffic of the previous six Wednesdays. February 14th 2024  also saw 10.5% more visitors to Ulta than the day did in 2023, signaling a continued, growing interest in the beauty retailer. 

The Gen A Connection

Ulta has taken pains to carry products for consumers of all ages, genders, and backgrounds –and recently, one age group in particular has been making headlines for its interest in beauty and skincare. Teens and tweens have been flocking to their local malls to try out products from brands like Drunk Elephant, driven, in part, by the rise of #BeautyTok, where influencers on TikTok post their makeup and skincare routines. 

And indeed, trade area data indicates that families of all types are overrepresented among Ulta’s visitor base: Analyzing the psychographic makeup of Ulta’s trade areas using the Spatial.ai: PersonaLive dataset revealed that the chain’s captured market* includes more family segments when compared to the chain’s potential market*. Specifically, the chain’s captured markets had higher rates of “Near-Urban Diverse Families”, “Upper Suburban Diverse Families”, and “Wealthy Suburban Families” relative to the chain’s potential market. On the flip side, “Young Urban Singles” saw a smaller share of visitors in Ulta’s captured market than in its potential market. 

Ulta’s popularity with family segments may be due to the increased demand for skincare and makeup among the families’ younger generations. And by continuing to cater to these younger consumers – alongside the numerous other segment that shop at Ulta – the company can hope to foster long-term brand loyalty and continue driving sales and foot traffic to its stores. 

*A chain’s potential market refers to the population residing in a given trade area, where the Census Block Groups (CBGs) making up the trade area are weighted to reflect the number of households in each CBG.. A chain’s captured market weighs each CBG according to the actual number of visits originating to the chain from that CBG. 

Strong Foundations

Ulta continues to impress, growing its sales and foot traffic even during a uniquely challenging period for the average consumer. By creating a shopping experience that is accessible to people across all ages and income levels, the company ensures that its visits can continue to grow.

For more data-driven retail insights, follow placer.ai.

This blog includes data from Placer.ai Data Version 2.0, which implements improvements to our extrapolation capabilities, adds short visit monitoring, and enhances visit detection. 

Learn how downtown regions across US cities are measuring up with our free tools.
Check out the latest trends for
No items found.

Related Topics

Explore our free tools to get timely insights into key industries
Check out the latest trends for
No items found.
SHARE
Get 3 brand & industry
breakdowns every week
Subscribe to the newsletter
Oops! Something went wrong while submitting the form.

Get a Demo

Please enter your first name
Please enter your last name
Please provide a valid email
Please enter your email
Please enter company name

Thanks for reaching out!

One of our experts will be in touch soon

Try Placer.ai Free
Oops! Something went wrong while submitting the form.

Recent Publications

Get 3 brand & industry breakdowns every week

Subscribe to the newsletter
Serving Summer 2024: RBI and Yum! Brands Q2 Foot Traffic
Starbucks, Dutch Bros., Dunkin’: Finding Summer Success
Fast Food and Fast Casual Favorites, Plus CosMc’s Takeoff
Chipotle and Sweetgreen: Fast-Casual in Q2 2024
First Watch, Texas Roadhouse, and Applebee’s: An FSR Roundup
Albertsons Companies: H1 2024 Recap
Teaming Up For Success: Sports Stadium Sponsorships
Limited Time Offers: Price Wars Boost Visits
Placer 100 Index for Retail & Dining: June 2024 Recap
Placer.ai Mall Index: June 2024 Recap
Placer.ai Office Index: June 2024 Recap
Inside Out 2: The New Blockbuster Bringing Crowds Back to Theaters
Petco and PetSmart: A Head to Head
Frozen Delights: Exploring Ice Cream Chains Across America
Placer.ai White Paper Recap – June 2024
Barnes & Noble: Writing a New Story
Small Format Stores - Sprouting, Blooming, and Expanding
Retail and Dining on Father’s Day
Thrift Store Visit Scores
Charting Value Grocery’s Visit Growth
Placer 100 Index for Retail & Dining: Introduction and May 2024 Recap
Digging Into Darden: Q2 2024 Update
2024 Retail and Dining Trends Update
TRU and avid: Midscale Hotels on the Rise 
Diving Into Kroger: A Strong Start to 2024
Placer.ai Mall Index: May 2024 Recap – Mall Visits on the Rebound
Placer.ai Office Index: May 2024 Recap
2024 Memorial Day Recap
Las Vegas: A Tourism and Migration Deep Dive
Eatertainment Chains: Full on Food, Fun, and Foot Traffic
The Promise of Luxury Apparel
Catching Up With Ulta Beauty & Gap Brands
Ollie’s Bargain Outlet and Five Below: Q1 2024 Treasure Troves
CAVA Still Going Strong
Driving Success: Auto Parts Chains in 2024
Checking in With DICK’S Sporting Goods
Mother’s Day Shopping and Dining Trends
Placer.ai Mall Index: April 2024 Recap – Retail Resilience Heading into Spring
Dollar Stores Still Gaining Momentum
Off-Price Apparel Chains After Q1 2024: Demographics in the Balance
Walmart, Target, and Wholesale Clubs Continue to Thrive
Home Improvement and Decor Check In
Placer.ai Office Index: April 2024 Recap – Recovery Continues
Movie Theaters in Q1 2024: A Preview of Coming Attractions?
Let’s Get Physical: Fitness In 2024
Where Are Workers Returning to Office in 2024?
2024 Wins: Sweetgreen & First Watch on the Rise
A Full-Service Turnaround: Bloomin’, Dine, and Texas Roadhouse
Wendy’s and Denny’s: Breakfast and Late Night Dining Drives Success
Coffee Chains: Q1 2024 Update and What’s Changed Since COVID
Checking in with RBI and YUM!
Chipotle & McDonald's Serving Up Success
Wingstop & Shake Shack Continue Growing Their Reach 
Strong Start for Sprouts in 2024
Crocs’ Footwear Fairytale
Who Attends NCAA Final Four Events?
Eclipse Fever: How Did the (Retail and Hospitality) Stars Align?
Exploring Albertsons Companies’ Grocery Growth
Placer.ai Mall Index: March 2024 Recap – Malls Rise Again
Placer.ai Office Index: March 2024 Recap
Florida Spring Break Break-Up? Travelers Still Love Florida!
Provo-Orem and Ogden-Clearfield Emerging As Utah Hotspots 
Three Formulas for Experiential Retail in 2024
Aldi & Lidl Making The Cut
Texas Suburbs on the Rise
Exploring Luxury Hotel Brands’ Guest Segmentation
The St. Patrick’s Day Effect
How Can JOANN Make a Comeback?
Panera Bread Well Positioned for Possible IPO
Who Will Benefit From Family Dollar’s Downsizing?
Dave & Buster’s and Main Event Entertainment: Food and Fun for Everyone
Darden Brands: Location Analytics and Consumer Behavior
Nike and lululemon: a Strong 2023, Sprinting into 2024
Where Is Retail and Dining Foot Traffic Thriving in Early 2024?
Placer.ai White Paper Recap – February 2024
Three Retail & Dining Chains That May Surprise in 2024
Specialty Discount Chains Rock Retail Therapy
Placer.ai Mall Index: February 2024
Placer.ai Office Index: February 2024 Recap
Ulta Beauty Continues To Shine
First Watch Sails Into 2024
Hibbett Sports and DICK’S Sporting Goods: A Psychographic Analysis
Checking in With Discount & Dollar Stores
Peeking Behind The Curtain: Movie Theaters in 2023 and Beyond
Diving Into Brick-and-Mortar Eyewear
Getting Into Gear: Exploring The Auto Part Industry
Recapping Valentine’s Day 2024 Foot Traffic Trends
Fitness: A Strong Start to 2024
Dutch Bros. Continues To Percolate Visits
Super Bowl 2024: Placer.ai’s Postgame Foot Traffic Analysis
CAVA & sweetgreen Are On the Rise
Hats Off For Off-Price
Who Is Shopping at Malls?
Drilling Down Into Home Improvement
Walmart, Target, Costco & Superstore Space 2023 Recap
Catching Up With Shake Shack and Wingstop
Something To Chew On: Demographic Shifts at Steakhouse Chains
Placer.ai Office Index: Looking Back at 2023
Recapping RBI & Yum! Brands’ 2023 Foot Traffic Performance
Placer.ai White Paper Recap – January 2024