
Thanks for Visiting!

Register for free to get the full story.

Sign Up
Already have a Placer.ai account? Log In
Article

Placer.ai Mall Index: October 2024 Recap 

Discover how malls performed during the fall months, especially over Halloween.

By 
Shira Petrack
November 11, 2024
Placer.ai Mall Index: October 2024 Recap 
SHARE
Explore our free tools to get timely insights into key industries
Check out the latest trends for
About the Placer.ai Mall Index: The Index analyzes data from 100 top-tier indoor malls, 100 open-air shopping centers (not including outlet malls) and 100 outlet malls across the country, in both urban and suburban areas. Placer.ai leverages a panel of tens of millions of devices and utilizes machine learning to make estimations for visits to locations across the country. 
Key Takeaways
  • Following a slight decline in September, visits to indoor malls, open-air shopping centers, and outlet malls were back on par with 2023 levels, with traffic up year-over-year during the last two weeks of October – boding well for the upcoming holiday season. 
  • Overall mall visits dipped on Halloween, with the afternoon and early evening seeing the largest drop – so stores looking to capitalize on Halloween shoppers may choose to focus their promotions on reaching consumers during the earlier daypart. 

With the holiday season just around the corner, we dove into the Placer.ai Mall Index to see how these shopping mainstays performed during the fall retail lull.  

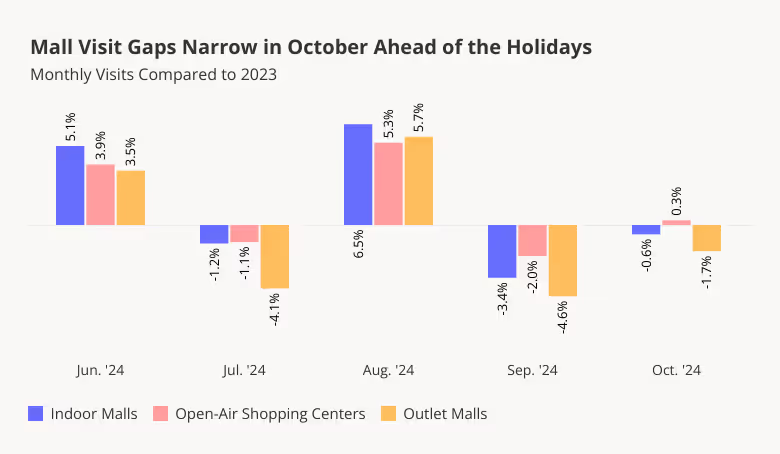
October Mall Visits on Par with 2023 Levels 

Following several months of roller-coaster visit trends – as August visits surged compared to last year and September visits dipped year-over-year (YoY) – mall traffic stabilized in October: Last month’s visits to indoor malls, open-air shopping centers, and outlet malls generally matched 2023 visitation trends. The closing of the YoY visit gaps may indicate that consumers are once again ready to spend following the brief September slow-down – boding well for the upcoming holiday season.

Monthly visits to malls compared to 2023 for Jun - Oct '24

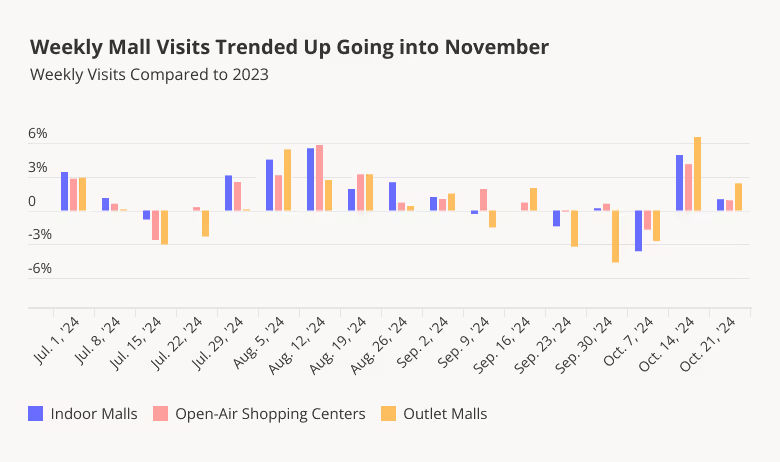
Weekly Trends Swing Positive Ahead of November

Diving into the weekly trends offers even further reasons for optimism: YoY visits over the last two full weeks of October were positive for all three mall categories, with outlet malls in particular seeing the largest YoY increases. Outlet malls’ positive performance during the second half of the month may signal a comeback for the format, which has generally lagged behind indoor malls and open-air shopping centers in recent months.

Weekly YoY visits to malls from Jul - Oct 24 shows growth in august and end of october

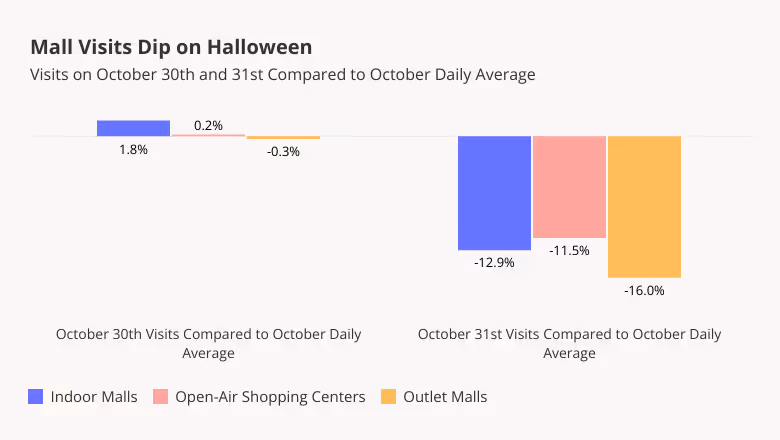
Mall Visits Dip on Halloween

Unlike certain retail categories that enjoy Halloween-driven visit surges either on the day itself or on October 30th, malls do not appear to benefit from the spooky holiday. Analyzing daily visits reveals that October 30th visits were on par with the daily October average, while October 31st traffic actually took a hit across the three mall formats in the Placer.ai Mall Index.

The dip is likely due to shoppers putting off their mall trips and instead choosing superstores and specialty retailers such as party supply stores and liquor shops for their holiday prep. Stores hoping to avoid the Halloween dip may want to offer special promotions around the day – and managers can also use this information to optimize their staffing schedules on October 31st.

Visits on October 31st were much lower than the daily October average visits to malls

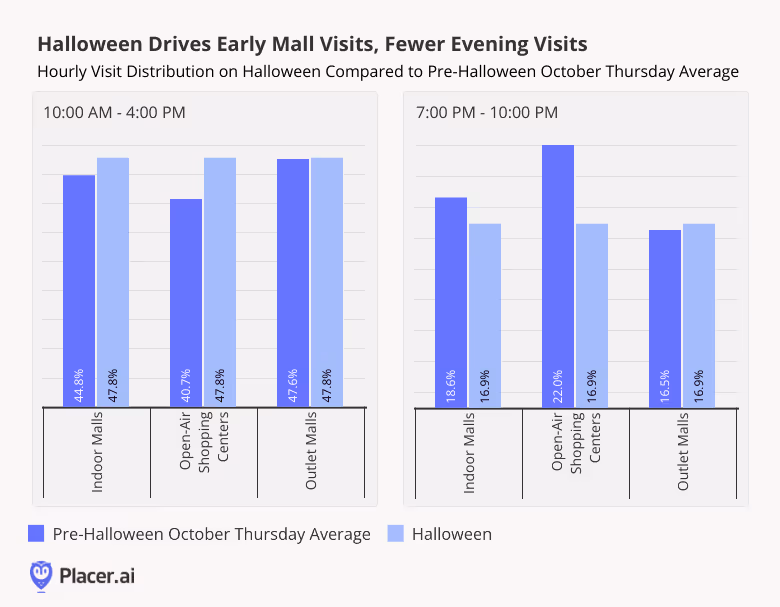
Shoppers Shop Early on Halloween

Diving into hourly visit distributions provides even more data for those looking to optimize store performance. On Halloween, indoor malls and open-air shopping centers received a larger share of their visits before 4:00 PM and relatively fewer visits in the evening when compared to an average Thursday in October. So while some consumers did come out to malls in the morning, by evening, many shoppers may have been too busy scrambling to complete their Halloween costume or stock up on candy for the evening. Meanwhile, the Halloween dip in visits to outlet malls appears to have been evenly spaced throughout the day, with hourly visit shares on October 31st closely matching the average Thursday visit distribution patterns. 

Store managers operating in indoor malls or open-air shopping centers may use this data to optimize staffing for the afternoon and evening Halloween shifts, while those working at outlet malls may want to reconsider their manpower needs for the day as a whole. At the same time, those looking to draw in more foot traffic may try offering promotions that appeal to early birds or trick-or-treaters.

Hourly visits to malls on Halloween shows more early visits and fewer evening visits


With October in the rearview mirror, the holiday season is kicking off. How will malls perform? 

Visit placer.ai to find out. 

Learn how downtown regions across US cities are measuring up with our free tools.
Check out the latest trends for

Related Topics

Stay Anchored: Subscribe to Insider & Unlock more  Insights
Subscribe
SHARE
Get 3 brand & industry
breakdowns every week
Subscribe to the newsletter
Oops! Something went wrong while submitting the form.
Recent Publications
INSIDER
Report
5 Markets to Watch in 2026
Find out why Salt Lake City, Reno, Indianapolis, Raleigh, and Tampa are Placer.ai's markets to watch in 2026.
Placer Research
December 5, 2025
Article
Placer.ai November 2025 Office Index: Post-Pandemic Record Occupancy
Driven by stricter RTO mandates and a stabilizing "new normal," November 2025 marked the strongest November office occupancy rates we have seen since 2019.
Shira Petrack
December 11, 2025
3 minutes
Executive Insights
Dutch Bros vs. Dave’s Hot Chicken: The Veteran and the Rookie in America’s Restaurant Expansion Race
Explore how Dutch Bros and Dave’s Hot Chicken showcase two stages of restaurant growth, from explosive expansion to disciplined scaling and strategic maturity.
Kyle Inserra
December 10, 2025
3 minutes
The Anchor Logo
INSIDER
Stay Anchored: Subscribe to Insider & Unlock more Foot Traffic Insights
Gain insider insights with our in-depth analytics crafted by industry experts
— giving you the knowledge and edge to stay ahead.
Subscribe