
Thanks for Visiting!

Register for free to get the full story.

Sign Up
Already have a Placer.ai account? Log In
Article

Jersey Mike’s: On A (Sandwich) Roll

Find out what is driving Jersey Mike's success.

By 
Bracha Arnold
December 5, 2024
Jersey Mike’s: On A (Sandwich) Roll
SHARE
Explore our free tools to get timely insights into key industries
Check out the latest trends for
Key Takeaways
  • Jersey Mike’s is growing quickly, with the chain’s year-over-year visitation trends outperforming those of the wider fast casual segment. 
  • The company is succeeding in increasing its store count without cannibalizing visits from its existing locations, with visits and visits per location 44.4% and 12.0% higher, respectively than they were in January 2022. 
  • Jersey Mike’s visitors tend to be relatively affluent – indicating that Jersey Mike’s customers may be more economically resilient than the average consumer. 
  • Jersey Mike’s seems particularly popular with suburban consumers – another indication that the chain is well-positioned for continued expansion thanks to the recent suburban revival across the country. 

Jersey Mike’s, a nationwide chain with nearly 3,000 locations across the United States, was recently acquired by Blackstone for $8 billion – one of the largest restaurant mergers and acquisitions in recent years.

We took a look at some of the location analytics to understand what is driving the chain’s success.

Jersey Mike’s Gets That Bread

Jersey Mike’s has been on a serious roll over the past few years. The chain, which operates as both a franchise and a company-owned business, has posted strong visitation numbers while its major expansion push has tripled its store count over the past decade.

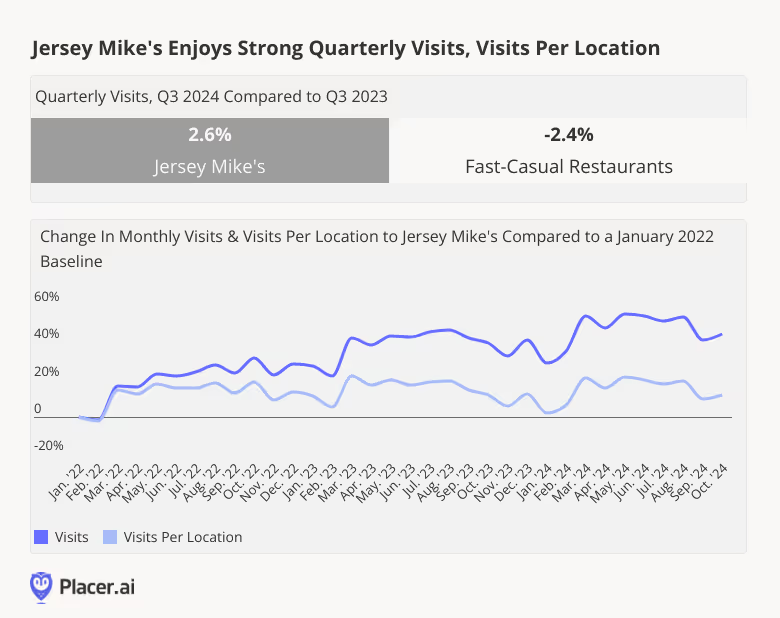
Looking at the chain’s visits highlights just how well it is doing. In Q3 2024, Jersey Mike’s enjoyed year-over-year (YoY) visit growth of 2.6% – outpacing the overall fast-casual dining segment, which experienced a 2.4% decline during the same period.

Part of Jersey Mike’s success lies in its ability to grow its per-location average visit count, even as new locations open at a rapid clip. Analyzing the baseline change in visits highlights this growth – October 2024’s visits per location to Jersey Mike’s were 12.0.% higher than they were in January 2022, while visits grew by 44.4%.

Jersey Mike's outperforming the fast casual category and has both growing visits and visits per location

Subs Find Success in the Suburbs 

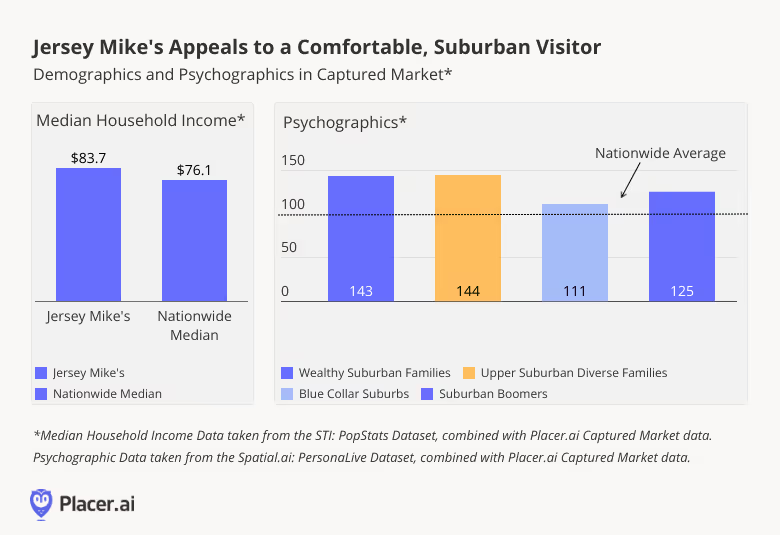
Another factor driving Jersey Mike’s success may lie in the relative affluence of its customer base. Using the STI: PopStats dataset reveals that the chain tends to attract customers coming from trade areas where the median household income (HHI) was higher than the nationwide median – $83.7K compared to $76.1K. This suggests that Jersey Mike’s customers may be relatively resilient to rising prices, which may explain the chain’s rapid growth even during a period of consumer cut backs.

Further analysis of the psychographic data reveals that Jersey Mike’s is particularly popular among suburban visitors. According to the Spatial.ai: PersonaLive dataset, the chain’s captured market* over-indexes for a range of suburban segments – meaning that Jersey Mike’s attracts these audiences at higher rates than the national average. For example, “Wealthy Suburban Families” over-indexed by 43% compared to the nationwide average, “Upper Suburban Diverse Families” by 44%, “Blue Collar Suburbs” by 11%, and “Suburban Boomers” by 25%. 

Jersey Mike’s popularity with these segments bodes well for the chain’s future expansion plans given the continued rise and return to suburban living. 

*A chain’s captured market is obtained by weighting each census block group (CBG) in its trade area according to its share of visits to the chain in question – and thus represents the profile of the business’ actual visitor base.

Demographics and psychographics show Jersey Mike's appeals to higher HHI households and suburban visitors

Sub-Stantial Opportunities Ahead

Jersey Mike’s seems poised to continue building on its impressive upward trajectory. 

Will the sandwich chain  maintain its impressive momentum and keep up with, or outpace its fast-casual competitors?

Visit Placer.ai to stay up-to-date with the latest data-driven dining analyses. 

Learn how downtown regions across US cities are measuring up with our free tools.
Check out the latest trends for

Related Topics

Stay Anchored: Subscribe to Insider & Unlock more  Insights
Subscribe
SHARE
Get 3 brand & industry
breakdowns every week
Subscribe to the newsletter
Oops! Something went wrong while submitting the form.
Recent Publications
INSIDER
Report
5 Markets to Watch in 2026
Find out why Salt Lake City, Reno, Indianapolis, Raleigh, and Tampa are Placer.ai's markets to watch in 2026.
Placer Research
December 5, 2025
Article
Starbucks and Dunkin’s LTOs Boost Traffic
As the 2025 holiday season kicks off, Starbucks and Dunkin’ continue to see strong consumer engagement, with both brands outperforming their 2024 traffic levels and capitalizing on early seasonal launches.
Shira Petrack
December 12, 2025
2 minutes
Article
Placer.ai November 2025 Office Index: Post-Pandemic Record Occupancy
Driven by stricter RTO mandates and a stabilizing "new normal," November 2025 marked the strongest November office occupancy rates we have seen since 2019.
Shira Petrack
December 11, 2025
3 minutes
The Anchor Logo
INSIDER
Stay Anchored: Subscribe to Insider & Unlock more Foot Traffic Insights
Gain insider insights with our in-depth analytics crafted by industry experts
— giving you the knowledge and edge to stay ahead.
Subscribe