While Warby Parker and Allbirds both originated as direct-to-consumer brands, they have since firmly established themselves as brick-and-mortar retailers. Warby Parker, known for its quirky and affordable approach to eyecare, has around 270 stores in the United States, while Allbirds, which recently underwent a significant rightsizing process, currently operates 24 stores across the country.
We took a look at the visit data for the two retailers to explore how they are faring thus far in 2025.
Optimal Optical Opportunities
Warby Parker continues to impress. The eyewear chain, which transitioned from an online-only model to physical stores in 2013, spent 2024 adding stores to its current fleet – and visit data highlights the positive impact of this expansion.
Q4 2024 and Q1 2025 visits to Warby Parker were 13.4% and 6.6% higher, respectively, than in Q4 2023 and Q1 2024. Average visits per location, too, showed growth in Q4 2024 (+4.9%), though they slowed slightly in Q1 2025. Still, Warby Parker’s ability to drive visit growth while keeping average visits per location stable suggests that its expansions are meeting with consistent demand.
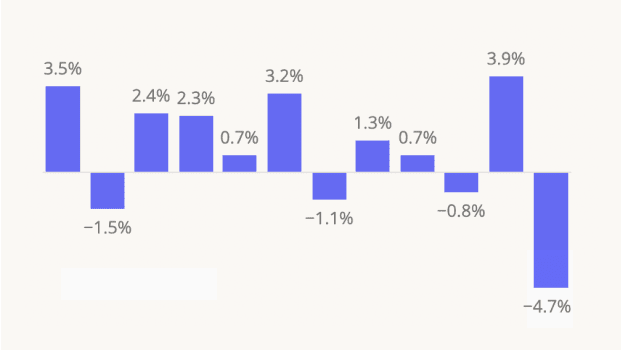
Weekly visits from 2025 onward highlight the brands’ strong positioning, with YoY visit growth in most analyzed weeks. (The significant YoY visit decline during the weeks of March 31st and April 7th is likely due to the comparison with last year’s major eclipse-related promotion, during which the chain offered free solar eclipse glasses.)
Allbirds Aligns with Agility
Shoewear company Allbirds has been charting a new performance course over the last year. The chain, known for its sustainable approach to footwear, recently closed nearly a third of its U.S. fleet in an attempt to optimize its stateside operations. And this consolidation, which allows Allbirds to prioritize top-performing locations, has yielded promising results for the chain.
While YoY visits were down across all analyzed months – an anticipated outcome given the significant reduction in store count – average visits per location, a more relevant indicator of Allbirds’ performance, were up on a near-constant basis. In Q1 2025, visits declined by 35.8% YoY, but visits per location grew by 14.1%.
Monthly visits followed a similar pattern: while overall visits declined by 25.9% YoY in March 2025, visits per location were up by 23.8%. This positive trend continued into April 2025, with overall visits down by just 9.2% YoY and visits per location remaining elevated at 21.0%, suggesting a strengthened performance at the remaining Allbirds stores.
This focus on a more efficient store footprint seems to be paying off for Allbirds, allowing the chain to accurately target its most receptive audience while cutting out underperforming locations.
Direct-to-Consumer Confidence
Warby Parker and Allbirds are performing well, highlighting the importance of remaining agile and pivoting to meet evolving consumer challenges.
Will the two retailers continue to thrive?
Visit Placer.ai to keep up with the latest data-driven retail news.


.svg)


.png)
.png)

.png)
.png)


