Thanks for Visiting!

Register for free to get the full story.

Sign Up
Already have a Placer.ai account? Log In

Placer.ai Office Indexes: September 2022 Recap

by 
Shira Petrack
 on 
October 5, 2022
Placer.ai Office Indexes: September 2022 Recap

About the Office Building Indexes:

These indexes analyze foot traffic data from more than 700 office buildings (53 in San Francisco, 70 in Manhattan, 50 in Dallas, 50 in Denver, 50 in Boston, 50 in Los Angeles, 50 in Atlanta, 51 in Houston and 61 in Chicago). They only include commercial office buildings and commercial office buildings on the first floor (like an office building that might include a national coffee chain on the ground floor). They do NOT include mixed-use buildings that are both residential and commercial. 

Placer.ai uses anonymized location information from a panel of 30 million devices and processes the data using industry-leading AI and machine learning capabilities to make estimations about overall visits to specific locations.

Diving into the September 2022 Office Recovery

With many employers still struggling to bring workers back to the office, we took a look at September 2022 office foot traffic data to find out where the workplace recovery stands heading into Q4 2022. 

New York City Beats the Curve

Over the past couple of months, New York City office workers have consistently outpaced both the nationwide and other major cities in both year-over-three-years (Yo3Y) and year-over-year (YoY) monthly office foot traffic numbers. 

The trend continued in September 2022, with New York City (Manhattan) offices seeing a visit gap of 37.1% compared to 2019, and a 31.1% YoY increase. This compared to a nationwide Yo3Y drop of 41.2% and YoY rise of 11.4% over the same period. Notably, New York City is beating the curve despite being consistently ranked as having one of the highest commute times in the nation – but the city also has a larger than usual share of workers commuting to work via transit (as opposed to driving to work). This may indicate that the fear of sitting in traffic or spending too long behind the wheel area is keeping some workers in other major cities from emulating New York’s return to office rates. 

Chicago and Houston’s office recoveries are now progressing in tandem, even though Chicago’s earlier YoY office foot traffic numbers were surpassing Houston’s – perhaps due to Chicago’s stricter COVID requirements in spring and early summer 2022. Both cities are lagging slightly behind the nationwide average, with September 202 office visits in Chicago and Houston down 48.8% and 46.6% Yo3Y, respectively. 

Meanwhile, Los Angeles offices have yet to pass the 50% mark, with September 2022 office visits 56.1% lower than they were in September 2019 – perhaps in part due to the pandemic “California exodus.” 

Denver, CO Leads Non-Top Four Workplace Recovery

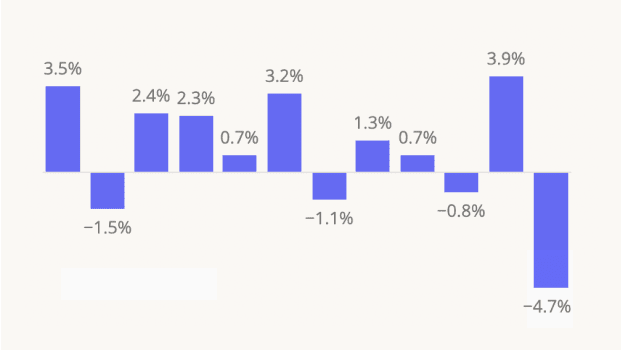
Among the five other major cities analyzed, Denver leads the workplace recovery, with only a 37.3% Yo3Y visit gap in September 2022. At the same time, Denver’s has seen a slight decrease in YoY foot traffic over the past three months, indicating that the workplace occupancy in the city should not be expected to increase significantly any time soon. 

Like with Houston and Los Angeles, Dallas (-43.4% Yo3Y) is seeing a significantly smaller office visit gap than San Francisco (-62.8% Yo3Y) – even though San Francisco is showing impressive YoY increases, which may indicate that the city’s office recovery is still in full swing. Still, the discrepancy in office recoveries between cities in Texas and California may have to do with the inbound migration to the Lone Star State from the Golden State over the past couple of years. 

Meanwhile, in both Boston and Atlanta, Yo3Y visits were down 43.2% in September – slightly below the nationwide average – indicating that the office recovery is not necessarily progressing faster in smaller metros.

In most cities, it appears that the office recovery has essentially plateaued, with many employers settling on some form of hybrid work. Most cities are hovering at around a 40% visit gap, which is most companies adopting a three-day in-office schedule. But with inflation and a changing labor market beginning to impact the power dynamics between employees and their bosses, the office recovery story may still have many key chapters ahead. 

For more data-driven real estate insights, visit placer.ai.

Get 3 brand & industry
breakdowns every week

Subscribe to the newsletter

Great! Prepare your inbox for data-driven insights...
Oops! Something went wrong while submitting the form.

Get a Demo

Please enter your first name
Please enter your last name
Please provide a valid email
Please enter your email
Please enter company name

Thanks for reaching out!

One of our experts will be in touch soon

Try Placer.ai Free
Oops! Something went wrong while submitting the form.
Text Link
Office Building Index
Text Link
Return To Work
4 Strategies Retailers are Using to Drive Traffic to Their Venues
5 Key Regional Grocery Players Impressing in 2023
Upscale Kitchenware Trending Up
Costco Finds More Room for Growth
Four C-Store Chains Making an A-Grade
National Parks + Outdoor Summer Activities
Diving Into Darden: Summer 2023 Update
The Summer Event Effect
Messi: Massive in Miami
Looking Back on Back to School 2023
The Anchor Recap: August 2023
Placer.ai Office Index: August 2023 Recap
Placer.ai Mall Index: August 2023 Recap
Placer.ai White Paper Recap: August 2023
Starbucks Pumpkin Spice Latte Strikes Again
Big Scoop: We All Scream For Ice Cream
Sports Away: Lululemon & Nike’s Momentum Continues
Summer Visits Heat Up For Recreation and Outdoor Gear Chains
No CSS overwrite - July 2023 Office Index Recap
Staging - August 2023 Mall Indec
Mid-Atlantic Grocery Deep Dive
Experiential Chains Heating Up This Summer
Petco Goes Big by Going Small
Ulta Beauty: Leading the Discretionary Pack
Discount and Dollar Chains Continue to Thrive
Summer of Sports: DICK’s Sporting Goods and Hibbett Sports
Off-Price: Succeeding Into Summer
The Anchor Recap: July 2023
Superstores Maintaining Pandemic Gains Amidst Economic Headwinds
2023: Home Improvement at the Halfway Point
July 2023 Office Index Recap
Placer.ai Mall Index: July 2023 Recap
widget test
The Taylor Swift Visit Lift
Southwestern Grocery Dive
July 2023 White Paper Recap: Halfway Point Review & Quarterly Index
Yum! Brands: Driving Dining Visits
Slurpees and Summer Movies Stimulate Consumer Foot Traffic
Cool Beans: Summer Coffee Update
Checking In on Back to School 2023
Crocs and New Balance Tip The Scales
Burger Bliss: Shake Shack and In-N-Out Stacking Visits
Chipotle & McDonald's Continue to Reign Supreme
Vibenomics and Placer.ai Partner to Enhance Retail Media In-Store Measurement
California Grocers Here We Come!
Marriott’s Different Audiences
Bonchon and Kura Sushi Thrive in the Fast-Casual Scene
A Shoe In: Footwear Climbs to the Top
Cheers! Raising a Glass to Beverage Retail
Placer.ai Office Index: June 2023 Recap
Placer.ai Mall Index June 2023 Recap – A Turn of the Tide and a Dive into Open-Air Lifestyle Centers
Local Kitchens: Redefining the Restaurant
Unlocking Urban Insights: The Value in Manhattan’s Employees
Ohio State Parks On The Rise
How is Inflation Impacting the High-Income Shoppers?
Five Fast-Growing Dining Chains
What To Expect From Prime Day and July Sales Events in 2023
The State Of Fashion: How Are Apparel Retailers Faring in 2023?
2023’s Latest Dining Success Story: GEN Korean BBQ House
The NBA Finals: A Location Intelligence Perspective
Moving the Market: The Impact of Domestic Migration on Housing Costs
Post-Pandemic Museum Update
The Darden-est Things
The Enduring Demand for Urban and Suburban Retail
Leveraging Data to Evaluate the Impact of Municipal Investments
Trader Joe's Success Amidst Food Inflation and Changing Consumer Behavior
Placer.ai Office Index: May 2023 Recap
Fitness at its Fittest: Staying Strong in 2023
Movie Theaters, Off-Price, and Home Improvement: May 2023 Recap
Placer.ai Mall Index - May 2023 Recap
What’s Working for Bath & Body Works?
Why Are Specialty Grocers Thriving in 2023?
The CAVA Craze: A Location Intelligence Perspective on the Mediterranean Marvel
How Will Primark’s US Expansion Impact Target?
All Eyes on Eyewear
Northwestern U.S. Grocery Dive
Return of the Lunch: Salad Chains Are Thriving
Retail Media Networks – Off the Beaten Track
Bet Your Bottom Dollar: Discount and Dollar Stores Drive Foot Traffic
Ulta & Lululemon: Discretionary Spending On The Up
The Score After Q1: Sporting Goods Chains
Who Uses NYC Airports: Biting Into The Big Apple’s Main Transport Hubs
Off Price: Strength in The Face of Retail Challenges
Visits Improve for Home Improvement
Walmart, Target & Wholesalers in Q1 2023 – The Return of Mission-Driven Shopping?
Department Store Roundup: Q1 2023
Placer.ai Office Index: April 2023 Recap
Placer.ai Mall Index, April 2023 – A Rebound on the Horizon?
How Will Bed Bath & Beyond’s Bankruptcy Impact the Retail Space?
Buffet Restaurants: Filling Up on Foot Traffic
Thrift Stores: Vintage Visits Drive New Age in Apparel
The Windy City: A Hub of Post-Pandemic Opportunity
Diving into Dining Traffic - Q1 2023
Bring On The Joe
A Dollar (or more) For Your Thoughts: Five Below and pOpshelf
Dining Out With The Cheesecake Factory
Retail Foot Traffic Recap – March 2023
Digging Into 2023: McDonald’s and Chipotle Update
Placer.ai Office Index: March 2023 Recap
How Did Key Retail Categories Perform in Q1 2023?