Thanks for Visiting!

Register for free to get the full story.

Sign Up
Already have a Placer.ai account? Log In
Civic

Manhattan and Brooklyn’s Pandemic Recovery 

Using foot traffic data, we dove into recent retail, tourism, and migration patterns for Manhattan and Brooklyn.

By 
Shira Petrack
July 27, 2022
Manhattan and Brooklyn’s Pandemic Recovery 
SHARE
Explore our free tools to get timely insights into key industries
Check out the latest trends for
No items found.
Key Takeaways

Manhattan and Brooklyn’s Pandemic Recovery 

In the early days of the pandemic, amidst the lockdowns, population exodus, and mounting daily COVID cases, many predicted that New York City was finished. But as it turns out, it takes more than a global pandemic to destroy the city that never sleeps. Using foot traffic data, we dove into recent retail, tourism, and migration patterns for Manhattan and Brooklyn to understand how the past two years have impacted these iconic urban hubs. 

Manhattan’s Population Change 

Manhattan was often compared to a ghost town at the start of the pandemic. New Yorkers practiced social distancing and commuters stayed away while embracing the work-from-home lifestyle (WFH). By September 2020, the residential vacancy rate in Manhattan had reached nearly 6% – more than double the typical 2% to 3%. But even as Manhattan was emptying out in 2020, big tech was betting on the city’s long-term health and snapping up millions of square feet of office space. And Manhattan made headlines recently when a report found that the average apartment rent in the borough for June 2022 exceeded $5,000 for the first time ever, indicating that demand for housing in Manhattan has returned with a vengeance. 

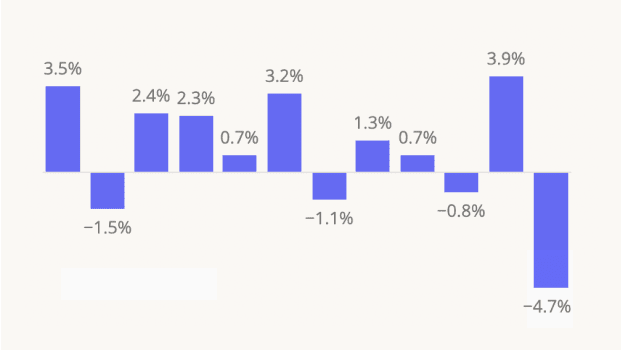
Foot traffic data confirms that Manhattan’s residents have returned home. Year-over-year (YoY) monthly population numbers have been consistently elevated, bringing the population in line with pre-pandemic levels – in the first half of 2022, Manhattan’s population was essentially the same as it was in the first half of 2019. And while some Manhattan residents have chosen to leave over the past three years and move to suburban Long Island (Suffolk County) or neighboring boroughs of Brooklyn, Queens, or the Bronx, just as many people have moved into Manhattan from these surrounding counties – indicating that despite the staying power of remote and hybrid work, living in Manhattan still has serious appeal. 

Brooklyn’s Population Change 

While Manhattan’s population has essentially returned to pre-pandemic levels, Brooklyn still has fewer residents than it did in 2019, with the year-over-three-year (Yo3Y) monthly population gap hovering at a little less than 4% for the first half of 2022. And unlike Manhattan that saw monthly YoY population increases between January 2022 and June 2022, Brooklyn’s population continued decreasing (albeit slightly) between 2021 and 2022 – indicating that many of those who left the borough during the first two years of COVID have yet to return. 

Like with Manhattan, most of those leaving Brooklyn remained nearby. Queens was the most popular relocation destination, followed by Manhattan, which means that not everyone left Brooklyn in search of open spaces. Some did move to the suburbs – 4.9% of those who left King’s County between June 2019 and June 2022 moved across the bay to Monmouth County, NJ. But 6.1% of those who moved to Brooklyn arrived from Monmouth County – so more people moved into Brooklyn from Monmouth than moved from Monmouth to Brooklyn. 

Brooklyn Domestic Tourism Recovery Beating Manhattan

Manhattan’s population may be returning faster than Brooklyn’s, but the data indicates that Brooklyn has the upper hand in terms of retail traffic and domestic tourism visits. Using Placer.ai’s COVID-19 Recovery Dashboard, we analyzed differences in retail and domestic foot traffic to Manhattan and Brooklyn between 2019 and 2022. We found that while Manhattan is struggling to maintain its pre-pandemic levels of domestic tourism, Brooklyn has experienced Yo3Y domestic tourism growth every month this year. 

Manhattan’s domestic tourism took a hit in January as Omicron kept would-be travelers home, but visits climbed to 10% Yo3Y growth in February – only to fall again in March as inflation caused many to think twice before booking such an expensive vacation. And although tourism foot traffic recovered slightly in April, visits fell again in May – and fell even further to 14% domestic tourism visit gap in June 2022. Inflation may actually be hurting Manhattan tourism in two ways – first, by leading some potential tourists to forego their vacation altogether, and second, by making it relatively cheap for those Americans who can afford a trip to travel to Europe instead. 

Meanwhile, domestic tourism to Brooklyn skyrocketed between January 2022 and May 2022, with double-digit increases in foot traffic every month relative to the equivalent month in 2019. And while visit growth did slow down in June 2022, domestic tourism was still 5% higher than in June 2019. Brooklyn is a much more affordable destination than Manhattan, which could explain some of the disparity. But the increase in domestic tourism to Brooklyn can also be attributed to former residents who are now regularly returning to their old haunts to shop, eat, or visit friends. 

Brooklyn’s Smaller Yo3Y Retail Visit Gap 

And even though Brooklyn lost a fair number of permanent residents while Manhattan’s population has recovered, Brooklyn is seeing smaller retail visit gaps than Manhattan – in June 2022, retail foot traffic in Manhattan and Brooklyn was 27% and 17% below June 2019 levels, respectively. This could indicate that – at least in popular tourist hubs – domestic tourism is just as important a driver of offline retail as are residents. 

For more foot traffic data-driven insights, visit placer.ai/blog

Learn how downtown regions across US cities are measuring up with our free tools.
Check out the latest trends for
No items found.
Explore our free tools to get timely insights into key industries
Check out the latest trends for
No items found.
SHARE
Get 3 brand & industry
breakdowns every week
Subscribe to the newsletter
Oops! Something went wrong while submitting the form.

Get a Demo

Please enter your first name
Please enter your last name
Please provide a valid email
Please enter your email
Please enter company name

Thanks for reaching out!

One of our experts will be in touch soon

Try Placer.ai Free
Oops! Something went wrong while submitting the form.

Recent Publications

Get 3 brand & industry breakdowns every week

Subscribe to the newsletter
Text Link
New York City
Text Link
Tourism
Text Link
Brooklyn
Serving Summer 2024: RBI and Yum! Brands Q2 Foot Traffic
Starbucks, Dutch Bros., Dunkin’: Finding Summer Success
Fast Food and Fast Casual Favorites, Plus CosMc’s Takeoff
Chipotle and Sweetgreen: Fast-Casual in Q2 2024
First Watch, Texas Roadhouse, and Applebee’s: An FSR Roundup
Albertsons Companies: H1 2024 Recap
Teaming Up For Success: Sports Stadium Sponsorships
Limited Time Offers: Price Wars Boost Visits
Placer 100 Index for Retail & Dining: June 2024 Recap
Placer.ai Mall Index: June 2024 Recap
Placer.ai Office Index: June 2024 Recap
Inside Out 2: The New Blockbuster Bringing Crowds Back to Theaters
Petco and PetSmart: A Head to Head
Frozen Delights: Exploring Ice Cream Chains Across America
Placer.ai White Paper Recap – June 2024
Barnes & Noble: Writing a New Story
Small Format Stores - Sprouting, Blooming, and Expanding
Retail and Dining on Father’s Day
Thrift Store Visit Scores
Charting Value Grocery’s Visit Growth
Placer 100 Index for Retail & Dining: Introduction and May 2024 Recap
Digging Into Darden: Q2 2024 Update
2024 Retail and Dining Trends Update
TRU and avid: Midscale Hotels on the Rise 
Diving Into Kroger: A Strong Start to 2024
Placer.ai Mall Index: May 2024 Recap – Mall Visits on the Rebound
Placer.ai Office Index: May 2024 Recap
2024 Memorial Day Recap
Las Vegas: A Tourism and Migration Deep Dive
Eatertainment Chains: Full on Food, Fun, and Foot Traffic
The Promise of Luxury Apparel
Catching Up With Ulta Beauty & Gap Brands
Ollie’s Bargain Outlet and Five Below: Q1 2024 Treasure Troves
CAVA Still Going Strong
Driving Success: Auto Parts Chains in 2024
Checking in With DICK’S Sporting Goods
Mother’s Day Shopping and Dining Trends
Placer.ai Mall Index: April 2024 Recap – Retail Resilience Heading into Spring
Dollar Stores Still Gaining Momentum
Off-Price Apparel Chains After Q1 2024: Demographics in the Balance
Walmart, Target, and Wholesale Clubs Continue to Thrive
Home Improvement and Decor Check In
Placer.ai Office Index: April 2024 Recap – Recovery Continues
Movie Theaters in Q1 2024: A Preview of Coming Attractions?
Let’s Get Physical: Fitness In 2024
Where Are Workers Returning to Office in 2024?
2024 Wins: Sweetgreen & First Watch on the Rise
A Full-Service Turnaround: Bloomin’, Dine, and Texas Roadhouse
Wendy’s and Denny’s: Breakfast and Late Night Dining Drives Success
Coffee Chains: Q1 2024 Update and What’s Changed Since COVID
Checking in with RBI and YUM!
Chipotle & McDonald's Serving Up Success
Wingstop & Shake Shack Continue Growing Their Reach 
Strong Start for Sprouts in 2024
Crocs’ Footwear Fairytale
Who Attends NCAA Final Four Events?
Eclipse Fever: How Did the (Retail and Hospitality) Stars Align?
Exploring Albertsons Companies’ Grocery Growth
Placer.ai Mall Index: March 2024 Recap – Malls Rise Again
Placer.ai Office Index: March 2024 Recap
Florida Spring Break Break-Up? Travelers Still Love Florida!
Provo-Orem and Ogden-Clearfield Emerging As Utah Hotspots 
Three Formulas for Experiential Retail in 2024
Aldi & Lidl Making The Cut
Texas Suburbs on the Rise
Exploring Luxury Hotel Brands’ Guest Segmentation
The St. Patrick’s Day Effect
How Can JOANN Make a Comeback?
Panera Bread Well Positioned for Possible IPO
Who Will Benefit From Family Dollar’s Downsizing?
Dave & Buster’s and Main Event Entertainment: Food and Fun for Everyone
Darden Brands: Location Analytics and Consumer Behavior
Nike and lululemon: a Strong 2023, Sprinting into 2024
Where Is Retail and Dining Foot Traffic Thriving in Early 2024?
Placer.ai White Paper Recap – February 2024
Three Retail & Dining Chains That May Surprise in 2024
Specialty Discount Chains Rock Retail Therapy
Placer.ai Mall Index: February 2024
Placer.ai Office Index: February 2024 Recap
Ulta Beauty Continues To Shine
First Watch Sails Into 2024
Hibbett Sports and DICK’S Sporting Goods: A Psychographic Analysis
Checking in With Discount & Dollar Stores
Peeking Behind The Curtain: Movie Theaters in 2023 and Beyond
Diving Into Brick-and-Mortar Eyewear
Getting Into Gear: Exploring The Auto Part Industry
Recapping Valentine’s Day 2024 Foot Traffic Trends
Fitness: A Strong Start to 2024
Dutch Bros. Continues To Percolate Visits
Super Bowl 2024: Placer.ai’s Postgame Foot Traffic Analysis
CAVA & sweetgreen Are On the Rise
Hats Off For Off-Price
Who Is Shopping at Malls?
Drilling Down Into Home Improvement
Walmart, Target, Costco & Superstore Space 2023 Recap
Catching Up With Shake Shack and Wingstop
Something To Chew On: Demographic Shifts at Steakhouse Chains
Placer.ai Office Index: Looking Back at 2023
Recapping RBI & Yum! Brands’ 2023 Foot Traffic Performance
Placer.ai White Paper Recap – January 2024