


Insights into the physical world anchored in location analytics

INSIDER
Report
Office Attendance Drivers in 2026: The New Rules of Showing UpDive into the data to learn how convenience-driven behaviors are impacting the office recovery – and how stakeholders from employers to office owners and local retailers can best adapt.
Placer Research
February 5, 2026
Industry Trends
Year-Over-Year Visits to Grocery Stores by State
Article

Article
Dutch Bros’ Grounds for Success in 2026The Kroger Co, is a leading player in the grocery store space, operating its epon lorem ipsum dolor sit amet, consectetur adipiscing elit, sed do eiusmod tempor incididunt ut labore et dolore magna aliqua. Ut enim ad minim veniam, quis nostrud exercitation ullamco laboris nisi ut aliquip ex ea commodo consequat. Duis aute irure dolor in reprehenderit in voluptate velit esse cillum dolore eu
Ezra Carmel
Feb 5, 2026
2 minutes
Article
Article
Higher-End Bloomin' Concepts Outperformed in Q4 2025The Kroger Co, is a leading player in the grocery store space, operating its epon lorem ipsum dolor sit amet, consectetur adipiscing elit, sed do eiusmod tempor incididunt ut labore et dolore magna aliqua. Ut enim ad minim veniam, quis nostrud exercitation ullamco laboris nisi ut aliquip ex ea commodo consequat. Duis aute irure dolor in reprehenderit in voluptate velit esse cillum dolore eu
Shira Petrack
Feb 4, 2026
2 minutes
Article

Article
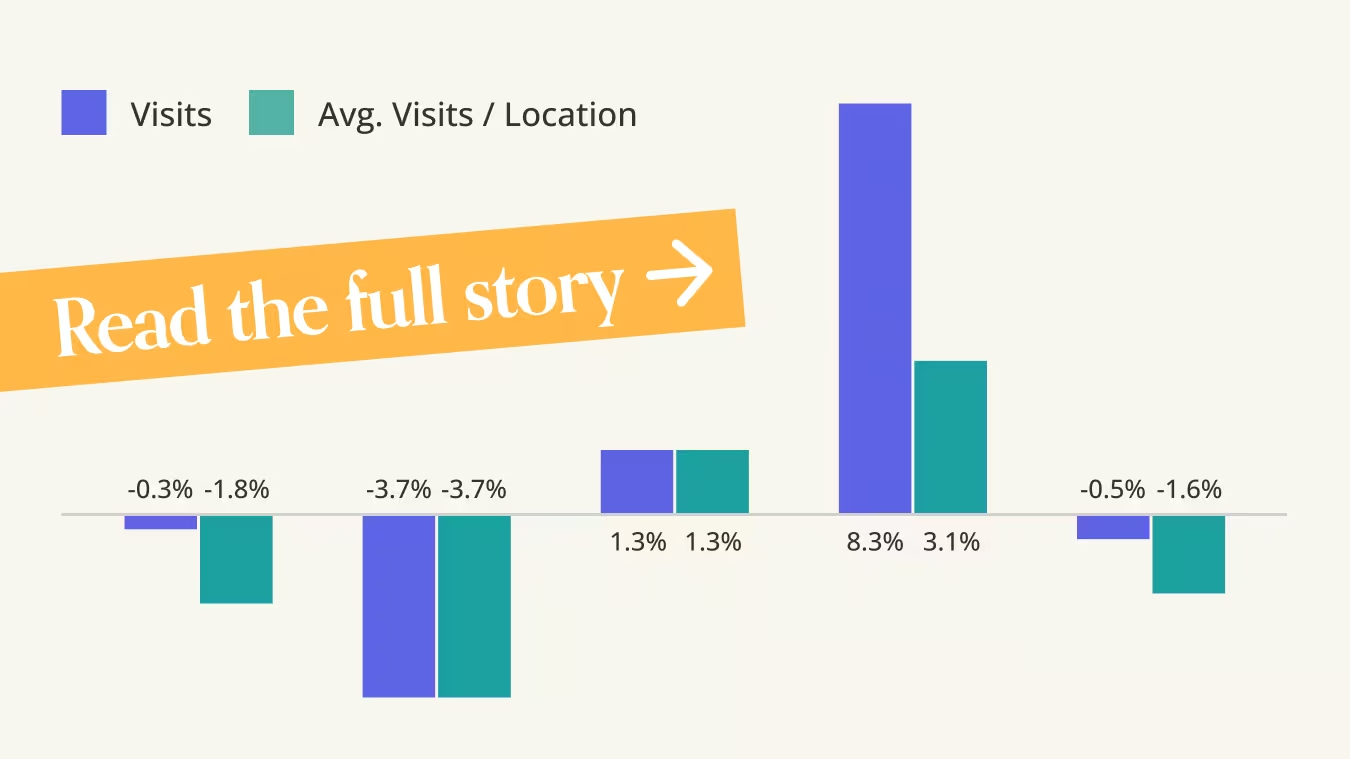
The 2026 Fight for Value, Precision, and the Middle-Income Consumer in the Restaurant SpaceThe Kroger Co, is a leading player in the grocery store space, operating its epon lorem ipsum dolor sit amet, consectetur adipiscing elit, sed do eiusmod tempor incididunt ut labore et dolore magna aliqua. Ut enim ad minim veniam, quis nostrud exercitation ullamco laboris nisi ut aliquip ex ea commodo consequat. Duis aute irure dolor in reprehenderit in voluptate velit esse cillum dolore eu
R.J. Hottovy
Feb 3, 2026
6 minutes
Executive Insights

Executive Insights
What it Takes to Win at Grocery in 2026The Kroger Co, is a leading player in the grocery store space, operating its epon lorem ipsum dolor sit amet, consectetur adipiscing elit, sed do eiusmod tempor incididunt ut labore et dolore magna aliqua. Ut enim ad minim veniam, quis nostrud exercitation ullamco laboris nisi ut aliquip ex ea commodo consequat. Duis aute irure dolor in reprehenderit in voluptate velit esse cillum dolore eu
Erich Kahner
Feb 2, 2026
3 minutes
Latest Articles


.avif)

_texasroadhouse_dine.png)
Article
Q4 2025 FSR Trends Emphasize Strategy, Value, and Footprint DisciplineShira Petrack
January 26, 2026
3 minutes

Article
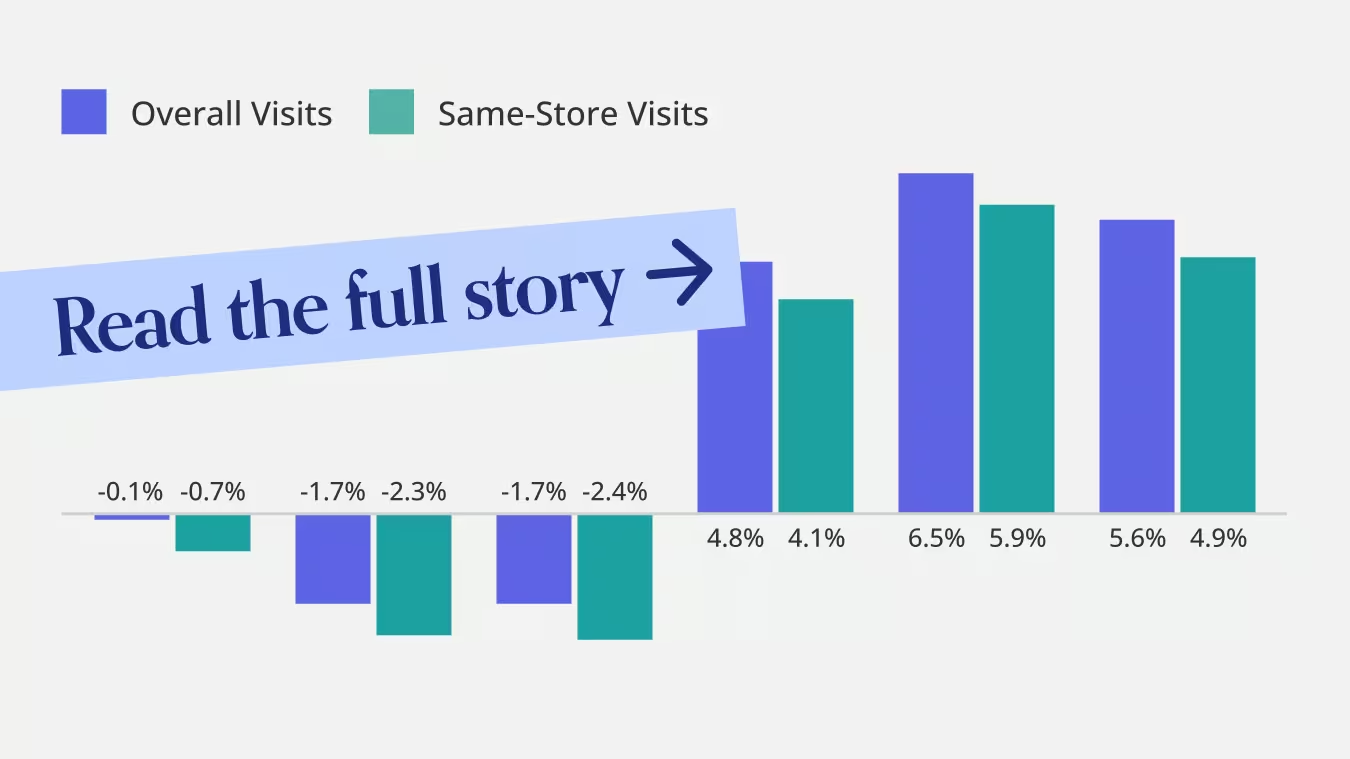
Chipotle’s Growth Is No Longer Just About New RestaurantsLila Margalit
January 22, 2026
3 minutes
Article
What Other QSR Brands Can Learn From McDonald’s Loyalty StrategyShira Petrack
January 21, 2026
3 minutes
Article
Opportunity vs. Operational Reality in Dollar Tree's 99 Cents Only AcquisitionShira Petrack
January 20, 2026
3 minutes
.avif)
Article
Which Gym Is Right For You in 2026?Using AI-powered location analytics, we reveal which gyms are less crowded at peak times, skew younger or older, and attract the most singles.
Ezra Carmel
January 16, 2026
4 minutes

Latest Reports
.avif)


.png)
INSIDER
Report
10 Top Brands to Watch in 2026Meet the ten retail and dining powerhouses, including H-E-B, Walmart, and Dave’s Hot Chicken, redefining success and winning consumer loyalty in 2026.
Placer Research
January 12, 2026
INSIDER
Report
6 Coffee-Inspired Strategies That Can Reshape Dining in 2026Dive into the data to see how coffee became one of this year’s strongest dining performers – and explore strategies that can drive restaurant success across concepts in 2026.
Placer Research
December 18, 2025
INSIDER
Report
5 Markets to Watch in 2026Find out why Salt Lake City, Reno, Indianapolis, Raleigh, and Tampa are Placer.ai's markets to watch in 2026.
Placer Research
December 5, 2025
INSIDER
Report
Retail Trends to Watch in 2026Which retail trends are set to define 2026? Using location intelligence, we explore the shifting patterns that could shape the retail landscape in the year ahead.
Placer Research
November 14, 2025
INSIDER
Report
Winning Holiday Shoppers in 2025: Key Insights for Advertisers and RetailersDive into the data to uncover the retail categories, audiences, and timing strategies poised to deliver high-impact campaigns this holiday season.
Placer Research
October 30, 2025
INSIDER
Report
What is Driving Discretionary Spending in 2025? See which discretionary retail categories are gaining momentum by delivering value, accessible upgrades, and immersive experiences.
Placer Research
October 2, 2025


.svg)