Thanks for Visiting!

Register for free to get the full story.

Sign Up
Already have a Placer.ai account? Log In

Checking in with the Urban Retail Recovery

By 
Shira Petrack
February 3, 2022
Checking in with the Urban Retail Recovery
SHARE
Explore our free tools to get timely insights into key industries
Check out the latest trends for
No items found.
Key Takeaways

Checking in with the Urban Retail Recovery

For most weeks of the second half of 2021, nationwide weekly retail foot traffic has been up or equivalent to 2019 levels. But as hybrid work and migration shifts keeps urban occupancy down and travel restrictions continue to limit tourism, some major cities are still feeling the pandemic’s impact.

Retail Foot Traffic in America’s Largest Cities 

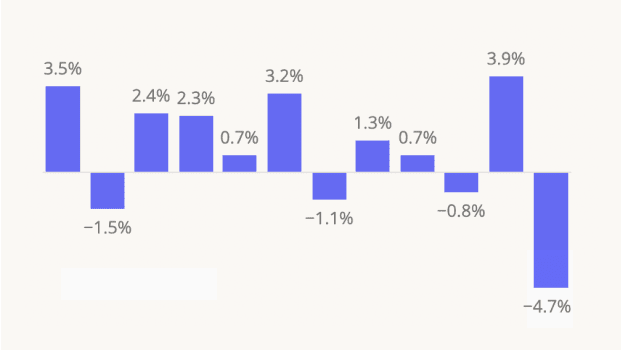
Clearly, some cities have been more affected than others. Of the four major cities analyzed, New York City – where the retail sector relies heavily on tourists and office workers – suffered the heaviest blow. While summer retail foot traffic was almost back to pre-pandemic levels, with July visits comparable to 2019 levels, NYC retail foot traffic dipped back down in August and has remained below pre-COVID levels ever since. Los Angeles also saw Yo2Y retail growth down for most of 2021 – perhaps due to the high numbers of Californians moving to inland and mountain communities over the past year.

The situation looked slightly rosier in Chicago and Houston. While the Yo2Y visit gap in those cities did grow in September – likely a result of the spread of the Delta variant – retail visits quickly bounced back. October retail foot traffic in both cities was 1% higher than it had been in 2019, and despite a small decline in November – likely due to the demise of Black Friday – December retail visits rose right back to pre-pandemic levels.

Diving into Leading Retailers’ Regional Performance 

But behind the overall retail visit numbers lies a more complicated reality. Some retailers are thriving in cities that have yet to make a full visit recovery, while other brands whose foot traffic is strong nationwide are still lagging behind in areas where overall retail visits are growing. We dived into the DMA data for each of the four cities analyzed to understand how different retailers were performing regionally. 

Target, which has shown strength all year, performed well in all four cities analyzed but performed best in the Big Apple – even though year-over-two-year (Yo2Y) retail visits in New York were lower than in the other three cities. Planet Fitness Yo2Y monthly visits in Q4 were also up every month in NYC, despite the overall fitness downturn. And Starbucks in New York also overperformed compared to the Starbucks national average, even though many offices in the city have yet to hit full occupancy

In Los Angeles, Starbucks saw Yo2Y visit increases but still underperformed its nationwide average – perhaps due to the rise of Dunkin’ on the West Coast. Target foot traffic also increased in LA compared to 2019 but remained below the nationwide average, which may be attributed to the popularity of Walmart in Tinseltown. And despite Californians’ well-known interest in fitness, October visits to Planet Fitness actually decreased by 0.9% compared to 2019 – but skyrocketed again in November and December to outperform the nationwide average. 

Chicago, which has seen the strongest retail recovery of the four cities analyzed, saw Target and Starbucks underperform their nationwide average. But the retail giant and the coffee leader still posted Yo2Y visit growth almost every month, a testament to the nearly universal appeal of these brands. Planet Fitness in the Windy City also saw a slight Yo2Y dip in August while overall retail visits increased – but the fitness brand saw strong growth in Chicago in November and December, even though average Yo2Y retail visits for those months stood at -1% and 0%, respectively. 

And Houston, which has also seen a strong overall retail recovery, has seen its visits to Target and Planet Fitness skyrocket and overperform the nationwide average – while visits to Starbucks have been growing a little slower. 

As the data here shows, looking at city-specific overall retail visits and comparing the city-specific brand foot traffic to the brand’s nationwide average can uncover regional disparities in retail recovery rates. So, while overall foot traffic numbers for nationwide retail categories or brands can give a good sense of the average foot traffic performance across a region or chain, diving into the regional performance provides a whole different level of insight. 

Want to dive deeper into Target, Planet Fitness, and Starbucks’ nationwide performances?

Visit Placer.ai

Learn how downtown regions across US cities are measuring up with our free tools.
Check out the latest trends for
No items found.

Related Topics

Explore our free tools to get timely insights into key industries
Check out the latest trends for
No items found.
SHARE
Get 3 brand & industry
breakdowns every week
Subscribe to the newsletter
Oops! Something went wrong while submitting the form.

Get a Demo

Please enter your first name
Please enter your last name
Please provide a valid email
Please enter your email
Please enter company name

Thanks for reaching out!

One of our experts will be in touch soon

Try Placer.ai Free
Oops! Something went wrong while submitting the form.

Recent Publications

Get 3 brand & industry breakdowns every week

Subscribe to the newsletter
Serving Summer 2024: RBI and Yum! Brands Q2 Foot Traffic
Starbucks, Dutch Bros., Dunkin’: Finding Summer Success
Fast Food and Fast Casual Favorites, Plus CosMc’s Takeoff
Chipotle and Sweetgreen: Fast-Casual in Q2 2024
First Watch, Texas Roadhouse, and Applebee’s: An FSR Roundup
Albertsons Companies: H1 2024 Recap
Teaming Up For Success: Sports Stadium Sponsorships
Limited Time Offers: Price Wars Boost Visits
Placer 100 Index for Retail & Dining: June 2024 Recap
Placer.ai Mall Index: June 2024 Recap
Placer.ai Office Index: June 2024 Recap
Inside Out 2: The New Blockbuster Bringing Crowds Back to Theaters
Petco and PetSmart: A Head to Head
Frozen Delights: Exploring Ice Cream Chains Across America
Placer.ai White Paper Recap – June 2024
Barnes & Noble: Writing a New Story
Small Format Stores - Sprouting, Blooming, and Expanding
Retail and Dining on Father’s Day
Thrift Store Visit Scores
Charting Value Grocery’s Visit Growth
Placer 100 Index for Retail & Dining: Introduction and May 2024 Recap
Digging Into Darden: Q2 2024 Update
2024 Retail and Dining Trends Update
TRU and avid: Midscale Hotels on the Rise 
Diving Into Kroger: A Strong Start to 2024
Placer.ai Mall Index: May 2024 Recap – Mall Visits on the Rebound
Placer.ai Office Index: May 2024 Recap
2024 Memorial Day Recap
Las Vegas: A Tourism and Migration Deep Dive
Eatertainment Chains: Full on Food, Fun, and Foot Traffic
The Promise of Luxury Apparel
Catching Up With Ulta Beauty & Gap Brands
Ollie’s Bargain Outlet and Five Below: Q1 2024 Treasure Troves
CAVA Still Going Strong
Driving Success: Auto Parts Chains in 2024
Checking in With DICK’S Sporting Goods
Mother’s Day Shopping and Dining Trends
Placer.ai Mall Index: April 2024 Recap – Retail Resilience Heading into Spring
Dollar Stores Still Gaining Momentum
Off-Price Apparel Chains After Q1 2024: Demographics in the Balance
Walmart, Target, and Wholesale Clubs Continue to Thrive
Home Improvement and Decor Check In
Placer.ai Office Index: April 2024 Recap – Recovery Continues
Movie Theaters in Q1 2024: A Preview of Coming Attractions?
Let’s Get Physical: Fitness In 2024
Where Are Workers Returning to Office in 2024?
2024 Wins: Sweetgreen & First Watch on the Rise
A Full-Service Turnaround: Bloomin’, Dine, and Texas Roadhouse
Wendy’s and Denny’s: Breakfast and Late Night Dining Drives Success
Coffee Chains: Q1 2024 Update and What’s Changed Since COVID
Checking in with RBI and YUM!
Chipotle & McDonald's Serving Up Success
Wingstop & Shake Shack Continue Growing Their Reach 
Strong Start for Sprouts in 2024
Crocs’ Footwear Fairytale
Who Attends NCAA Final Four Events?
Eclipse Fever: How Did the (Retail and Hospitality) Stars Align?
Exploring Albertsons Companies’ Grocery Growth
Placer.ai Mall Index: March 2024 Recap – Malls Rise Again
Placer.ai Office Index: March 2024 Recap
Florida Spring Break Break-Up? Travelers Still Love Florida!
Provo-Orem and Ogden-Clearfield Emerging As Utah Hotspots 
Three Formulas for Experiential Retail in 2024
Aldi & Lidl Making The Cut
Texas Suburbs on the Rise
Exploring Luxury Hotel Brands’ Guest Segmentation
The St. Patrick’s Day Effect
How Can JOANN Make a Comeback?
Panera Bread Well Positioned for Possible IPO
Who Will Benefit From Family Dollar’s Downsizing?
Dave & Buster’s and Main Event Entertainment: Food and Fun for Everyone
Darden Brands: Location Analytics and Consumer Behavior
Nike and lululemon: a Strong 2023, Sprinting into 2024
Where Is Retail and Dining Foot Traffic Thriving in Early 2024?
Placer.ai White Paper Recap – February 2024
Three Retail & Dining Chains That May Surprise in 2024
Specialty Discount Chains Rock Retail Therapy
Placer.ai Mall Index: February 2024
Placer.ai Office Index: February 2024 Recap
Ulta Beauty Continues To Shine
First Watch Sails Into 2024
Hibbett Sports and DICK’S Sporting Goods: A Psychographic Analysis
Checking in With Discount & Dollar Stores
Peeking Behind The Curtain: Movie Theaters in 2023 and Beyond
Diving Into Brick-and-Mortar Eyewear
Getting Into Gear: Exploring The Auto Part Industry
Recapping Valentine’s Day 2024 Foot Traffic Trends
Fitness: A Strong Start to 2024
Dutch Bros. Continues To Percolate Visits
Super Bowl 2024: Placer.ai’s Postgame Foot Traffic Analysis
CAVA & sweetgreen Are On the Rise
Hats Off For Off-Price
Who Is Shopping at Malls?
Drilling Down Into Home Improvement
Walmart, Target, Costco & Superstore Space 2023 Recap
Catching Up With Shake Shack and Wingstop
Something To Chew On: Demographic Shifts at Steakhouse Chains
Placer.ai Office Index: Looking Back at 2023
Recapping RBI & Yum! Brands’ 2023 Foot Traffic Performance
Placer.ai White Paper Recap – January 2024