


Insights into the physical world anchored in location analytics
INSIDER
Report
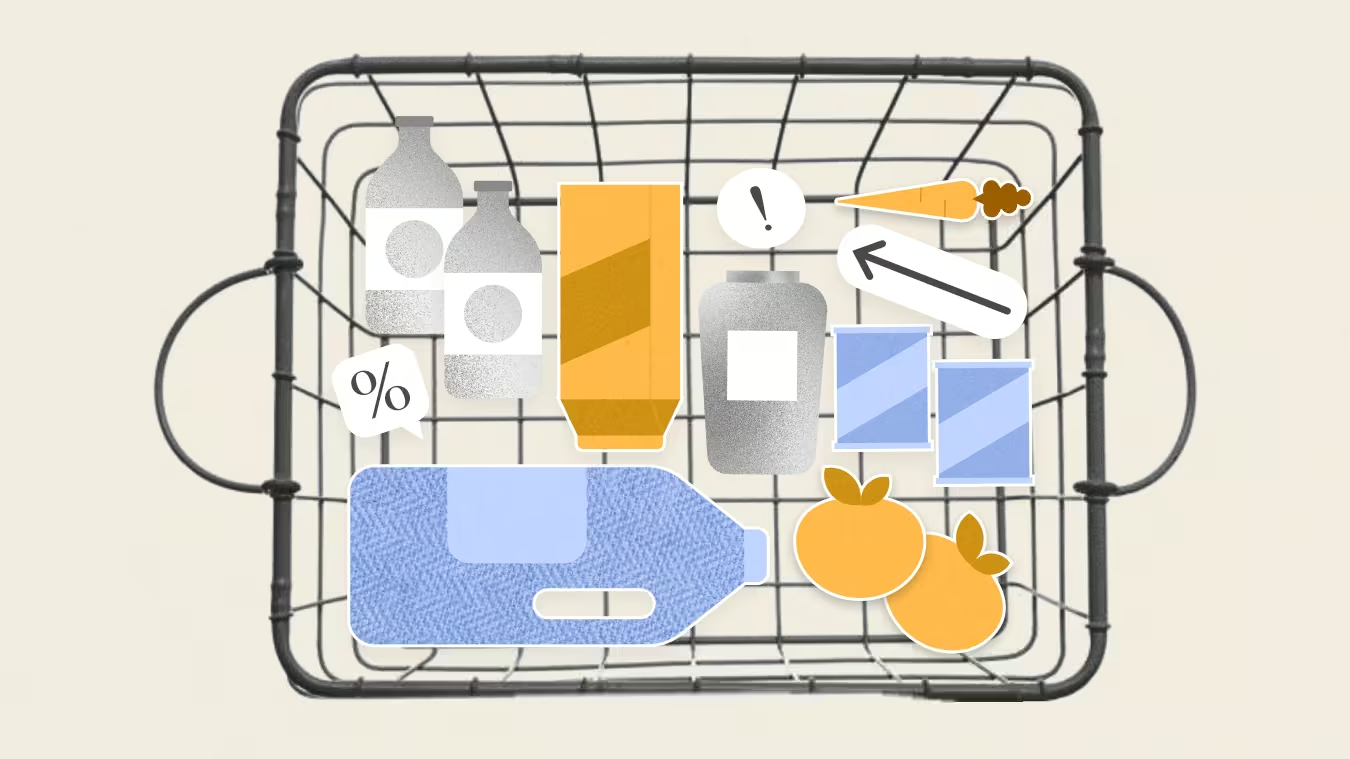
5 Grocery Growth Drivers in 2026How Expanded Supply, Trip Frequency, and Shopping Missions Are Reshaping Food Retail and Creating Multiple Paths to Growth
Placer Research
February 19, 2026
Industry Trends
Year-Over-Year Visits to Grocery Stores by State
Article
Article
The Strategy That Helped Propel Bob’s Discount Furniture to an IPOThe Kroger Co, is a leading player in the grocery store space, operating its epon lorem ipsum dolor sit amet, consectetur adipiscing elit, sed do eiusmod tempor incididunt ut labore et dolore magna aliqua. Ut enim ad minim veniam, quis nostrud exercitation ullamco laboris nisi ut aliquip ex ea commodo consequat. Duis aute irure dolor in reprehenderit in voluptate velit esse cillum dolore eu
Ezra Carmel
Mar 11, 2026
4 minutes
Article

Article
Premium Brands, LongHorn Boost Darden’s 2025 PerformanceThe Kroger Co, is a leading player in the grocery store space, operating its epon lorem ipsum dolor sit amet, consectetur adipiscing elit, sed do eiusmod tempor incididunt ut labore et dolore magna aliqua. Ut enim ad minim veniam, quis nostrud exercitation ullamco laboris nisi ut aliquip ex ea commodo consequat. Duis aute irure dolor in reprehenderit in voluptate velit esse cillum dolore eu
Shira Petrack
Mar 10, 2026
3 minutes
Article
.avif)
Article
Placer.ai February 2026 Mall Index: Are Outlet Malls Making A Comeback?The Kroger Co, is a leading player in the grocery store space, operating its epon lorem ipsum dolor sit amet, consectetur adipiscing elit, sed do eiusmod tempor incididunt ut labore et dolore magna aliqua. Ut enim ad minim veniam, quis nostrud exercitation ullamco laboris nisi ut aliquip ex ea commodo consequat. Duis aute irure dolor in reprehenderit in voluptate velit esse cillum dolore eu
Shira Petrack
Mar 9, 2026
2 minutes
Article

Article
Are Discretionary Pullbacks Hurting Treasure-Hunt Discounters?The Kroger Co, is a leading player in the grocery store space, operating its epon lorem ipsum dolor sit amet, consectetur adipiscing elit, sed do eiusmod tempor incididunt ut labore et dolore magna aliqua. Ut enim ad minim veniam, quis nostrud exercitation ullamco laboris nisi ut aliquip ex ea commodo consequat. Duis aute irure dolor in reprehenderit in voluptate velit esse cillum dolore eu
Lila Margalit
Mar 6, 2026
2 minutes
Latest Articles

.avif)

.avif)

Article
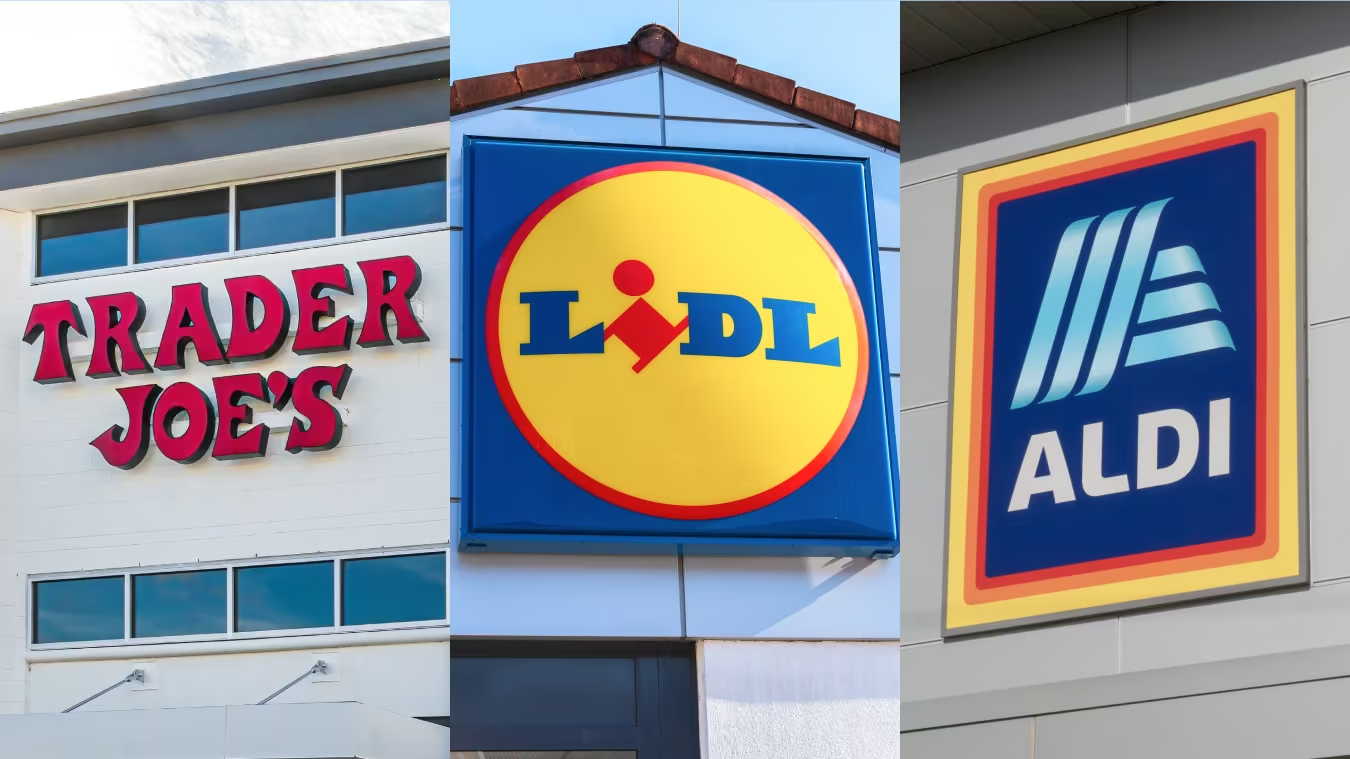
Trader Joe’s, Aldi, and Lidl: Don’t Put These Low-Price Grocers in the Same BasketEzra Carmel
February 25, 2026
4 minutes

Guest Contributor
Tech and AI: An Evolution, Not a Reinvention, of Commercial Real EstateGregg Katz
February 24, 2026
5 minutes

Article
How Old Navy and Gap Can Play Distinct Roles in Gap Inc.’s RecoveryLila Margalit
February 23, 2026
4 minutes

%20(1).avif)
Article
Clarity Wins as Off-Price Widens Its Lead Over Department StoresLila Margalit
February 18, 2026
3 minutes
Latest Reports

.avif)


INSIDER
Report
Five Ways Retailers Can Leverage AI Without Losing What WorksRead the report to learn how AI is changing store roles, operations, marketing, and fleet strategy – and how to apply it without undermining what already works.
Placer Research
January 29, 2026
INSIDER
Report
10 Top Brands to Watch in 2026Meet the ten retail and dining powerhouses, including H-E-B, Walmart, and Dave’s Hot Chicken, redefining success and winning consumer loyalty in 2026.
Placer Research
January 12, 2026
INSIDER
Report
6 Coffee-Inspired Strategies That Can Reshape Dining in 2026Dive into the data to see how coffee became one of this year’s strongest dining performers – and explore strategies that can drive restaurant success across concepts in 2026.
Placer Research
December 18, 2025
INSIDER
Report
5 Markets to Watch in 2026Find out why Salt Lake City, Reno, Indianapolis, Raleigh, and Tampa are Placer.ai's markets to watch in 2026.
Placer Research
December 5, 2025
INSIDER
Report
Retail Trends to Watch in 2026Which retail trends are set to define 2026? Using location intelligence, we explore the shifting patterns that could shape the retail landscape in the year ahead.
Placer Research
November 14, 2025
INSIDER
Report
Winning Holiday Shoppers in 2025: Key Insights for Advertisers and RetailersDive into the data to uncover the retail categories, audiences, and timing strategies poised to deliver high-impact campaigns this holiday season.
Placer Research
October 30, 2025


.svg)