


.svg)


Burger King is the latest quick-service restaurant (QSR) brand to jump on the LTO bandwagon, introducing a limited-time menu inspired by the much-anticipated How to Train Your Dragon movie. And though the film isn’t set to hit theaters until June 13th, the offering – which launched on Tuesday, May 27th – already appears to be boosting foot traffic.
On the day of the launch, visits to Burger King rose 6.2% above the chain’s year-to-date (YTD) Tuesday average. Momentum continued to build throughout the week, with May 30th seeing an 11.1% visit bump compared to an average Friday – and emerging as Burger King’s busiest day of the year so far. Year over year, too, Burger King registered increased traffic during the week of the launch – a trend that could intensify once the movie premieres.

Small-format stores are all the rage. Retailers from Macy’s to IKEA are experimenting with more compact locations to save on operating costs, expand into new markets, and offer customers a more convenient, curated shopping experience.
But just how effective is this approach? Is “going small” truly the key to brick-and-mortar retail success in 2025?
We dove into the data to find out.
Sprouting in Smaller Spaces
One chain that has successfully embraced a small-format strategy is Sprouts Farmers Market, the upscale, fresh-format grocery brand that has been steadily expanding over the past few years. Since 2022, the chain has pivoted from its traditional 30,000-32,000-square-foot stores to a more compact model of around 23,000 square feet. And location analytics suggest that this shift has been instrumental in Sprouts’ ongoing success.
In Q1 2025, the average number of visits per Sprouts location nationwide rose 4.4% year over year (YoY). But the chains’ smaller-format stores – those under 24,000 square feet – saw an even more impressive 8.8% YoY jump.
And digging into demographic data reveals that these smaller stores are helping Sprouts connect with new, urban audiences while still appealing to its core suburban customer base. Like Sprouts’ larger stores, the smaller outlets attract a higher-than-average share of “Suburban Periphery” shoppers, though less than the chain overall. But these smaller stores also draw more customers from urban areas – including shoppers from “Principal Urban Centers” that tend to be under-represented in Sprouts’ trade areas. Meanwhile, small-format Sprouts’ also attract visitors from slightly less affluent areas (though still above the nationwide median) – showing how Sprouts is expanding its audience without losing its suburban, affluent core.
Kohl’s Smaller Fit
Kohl’s is another chain demonstrating the potential of scaled-down stores. In 2022, the retailer announced plans to open about 100 smaller-format stores – around 35,000 square feet – a marked reduction from Kohl’s typical 80,000-square-foot footprint. And the success of Kohl’s 37,000 square-foot “concept” store in Tacoma, WA – opened in November 2022 as a testing ground for this format – showcases the promise of this approach.
The store offers a curated selection of active lifestyle products geared towards local preferences – as well as an improved self-pickup area. And location analytics suggest that the location’s offerings are resonating: The Tacoma store’s convenient set-up appears to help speed up shopping trips, as reflected by reduced dwell times. And over the past two quarters, YoY visits at the Tacoma Kohl’s have significantly outperformed other area locations.
Buc-ee’s: Everything’s Bigger in the Lone Star State
But going small isn’t the only recipe for retail success in 2025. Some chains are finding that bigger is better – creating gigantic stores that offer an unforgettable shopping experience, and keep customers coming back.
Convenience stores are rarely known for their size – but Buc-ee’s, the Texan favorite that holds the record for the largest c-store in the world, is the exception that proves the rule. Many of Buc-ee’s locations exceed 70,000 square feet. And over the past 12 months, Buc-ee’s has enjoyed consistent YoY visit growth, even as the broader category has languished. The massive c-store’s over-the-top offerings, from homemade fudge to Beaver Nuggets, have cemented Buc-ee’s reputation as a destination in its own right.
Scheels’ Supersized Approach to Sporting Goods
Supersized store formats have also fueled success in the recreational and sporting goods space. Dick’s House of Sport, Bass Pro Shop, and other chains have invested in expansive, experiential stores meant to serve as community hubs for sports fans and outdoor enthusiasts. And expanding Midwestern and Mountain State brand Scheels is emerging as a benchmark for this approach.
Roughly half of Scheels stores span at least 200,000 square feet, featuring attractions like Ferris wheels, massive saltwater aquariums, shooting galleries, archery lanes, and more. Unsurprisingly, these entertainment-oriented spaces draw more weekend crowds than other sporting goods stores. The chain has also grown its audience, outperforming the wider sector for YoY visit growth.
Creative Leverage is Key
The takeaway? There’s no single formula for retail success in 2025. But whether scaled-down and curated or grandiose and experiential, retail chains that intentionally and creatively leverage their physical spaces to engage audiences will continue to thrive.
For more data-driven retail insights, visit Placer.ai.

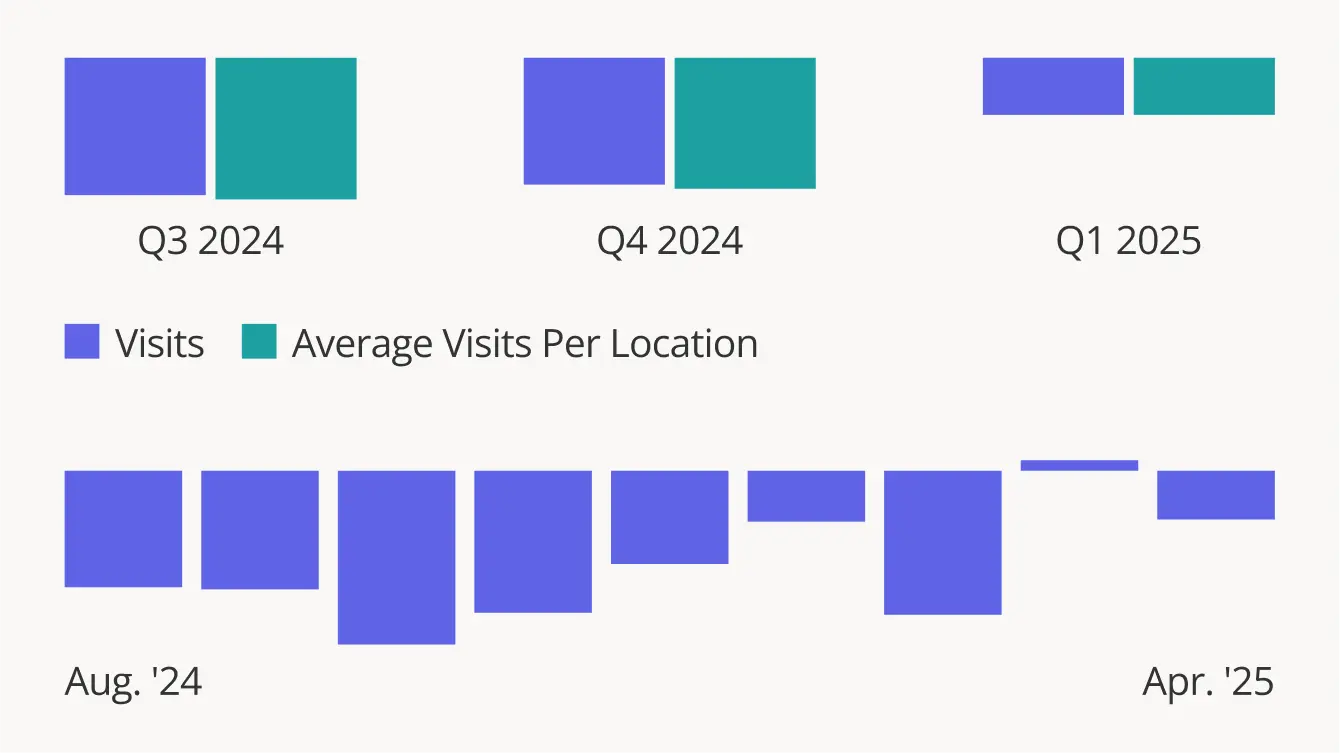
Kohl’s has faced a challenging period marked by store closures, leadership instability and a 6.5% decline in comparable sales last year. So it may come as no surprise that the department store continued to see year-over-year (YoY) visit gaps in Q1 2025 – with YoY foot traffic down nearly every month since August 2024.
Still, Q1 2025 saw the department store’s YoY visit gap shrink to just 2.7%, with March experiencing a slight uptick in visits YoY. Kohl’s narrower Q1 visit gap may be a promising sign for the retailer, especially given the inclement weather that kept many consumers at home in February.
Sephora at Kohl’s also remains a bright spot, contributing to an 8.8% net sales increase in the department store’s Accessories category in 2024. And a regional snapshot of YoY visit trends shows that much of the western United States actually experienced a YoY visit increase in Q1 – a trend the company’s incoming CEO may wish to build upon.
What lies in store for Kohl’s in the months to come?
Follow Placer.ai's data driven retail analyses to find out.
Like many e-commerce retailers, Wayfair jumped on the brick-and-mortar bandwagon last year with a large-format flagship store at Edens Plaza in Wilmette, IL – giving customers a physical space to explore its products. To mark the store’s one year anniversary (it opened to great fanfare on May 23rd, 2024 – just a few days before Memorial Day), we dove into the data to examine the profile and behavior of its visitors – and see how they compare to the wider home furnishings space.
Location analytics show that Wayfair has emerged as a go-to furniture destination, drawing visitors from farther away than the industry standard. Wayfair’s large-format store also attracts an above-average share of weekend foot traffic, with most visits occurring on Saturdays and Sundays. During these peak times, customers can leisurely browse Wayfair’s extensive offerings, enjoy the onsite café, and take advantage of free design and home improvement consulting services. The store also attracts an affluent audience – from areas with a higher median HHI than either the nationwide baseline or the broader home furnishings segment.
Given Wayfair’s popularity – the Wilmette location has emerged as a major traffic driver to the mall – it may come as no surprise that plans are already in the works to open two more large-format Wayfair locations. How will the retailer continue to fare as it expands its footprint?
Follow Placer.ai’s data-driven retail analyses to find out.

With Google and Uber joining the ever-growing ranks of companies tightening remote work policies, employees across industries are being forced to spend more time in the office. But how much are office visit patterns really changing on the ground? Did the resurgence observed in March 2025 continue into April, or was it merely a brief reprieve from the slump seen earlier this year?
Third-Busiest In-Office Month Since COVID
April 2025 emerged as the third-busiest in-office month since COVID, outpaced only by October and July 2024. And visits to the Placer.ai Nationwide Office Index were down just 30.7% compared to April 2019 (pre-COVID) – an improvement over April 2024. The upswing is especially notable given that Easter fell in April this year, whereas last year it fell in March. Though the holiday itself takes place on Sunday, many employees celebrate the occasion with a long weekend.
April 2025’s strong performance suggests that despite setbacks in January and February, the office recovery is back on track, with further increases potentially ahead in the coming months.
New York’s Near-Complete Recovery
A closer look at regional trends shows significant variation across major business hubs. New York City, long at the forefront of office recovery, nearly closed its post-pandemic office visit gap in April 2025, with visits just 5.5% below April 2019 levels. Miami also performed strongly, with visits down only 15.3%. Meanwhile, Atlanta and Dallas outperformed the national baseline (Dallas, just barely), while San Francisco once again took up the rear with Chicago.
Tuesdays and Wednesdays are Back! (in NYC)
Drilling down deeper into the data for office recovery leaders, New York and Miami highlights the continued influence of hybrid work on office visitation trends, even as numbers approach pre-pandemic levels.
Nationwide, office visits recovered most strongly mid-week. But this trend was especially pronounced in nearly-recovered NYC, where Tuesdays and Wednesdays were actually busier last month than they were during the same period of 2019 – and where Thursdays were essentially on par with April 2019 levels. Meanwhile, Fridays, and to a lesser extent Mondays, remained significantly below pre-COVID benchmarks. In Miami, too, it was midweek attendance that powered the office recovery – though Fridays rebounded more strongly in the Florida hub than in New York or nationwide.
San Francisco Leads in YoY Growth
Turning to year-over-year (YoY) trends, San Francisco once again led in YoY office visit growth – suggesting that accumulating RTO mandates in the city’s tech sector may be fueling substantial recovery. Boston was not far behind, with visits up 7.4% YoY. And while most other cities also posted YoY visit growth, a few hubs – including Houston and Los Angeles – saw modest declines.
Full Speed Ahead?
April 2025 data from the Placer.ai Office Index indicates that the renewed office recovery momentum seen in March 2025 is continuing apace – though hybrid work remains in full force. What lies ahead for offices in the months to come?
Follow Placer.ai’s data-driven office recovery analyses to find out.
Amid rising housing costs and shifting consumer lifestyles, self-storage has emerged as a go-to solution for many Americans. We dove into the data to take the pulse of the market in Q1 2025 – and uncover the audience segments behind the industry’s ongoing growth.
Room for Growth
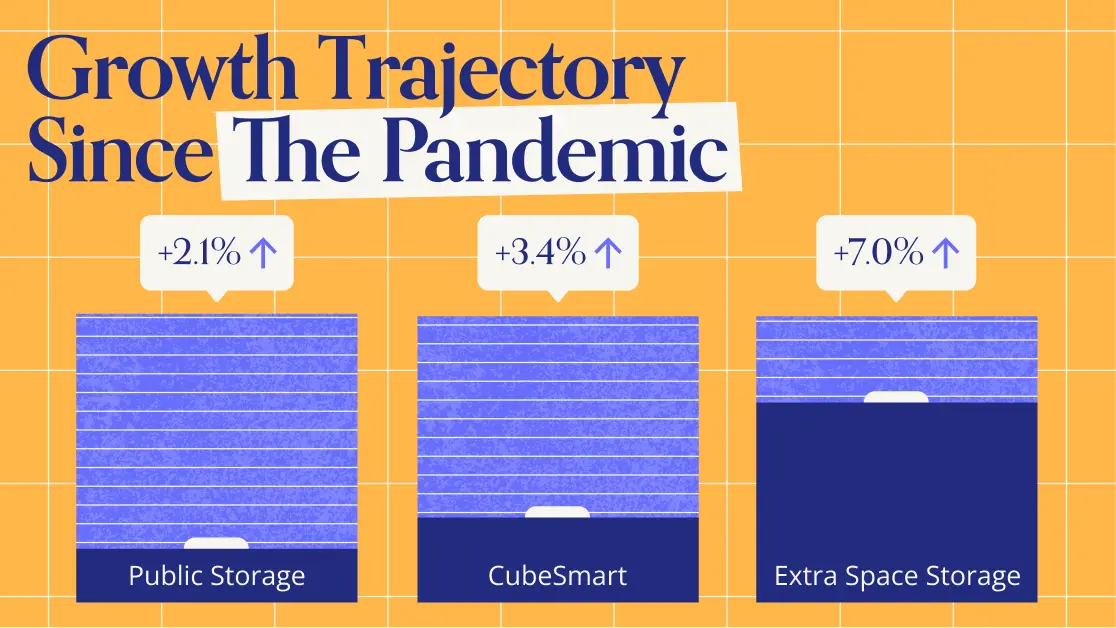
Visits to leading self-storage companies have been on a steady growth trajectory since 2019. During the pandemic, storage utilization surged as many Americans relocated or stored items to free up space for home offices or DIY projects. Since then, high prices and interest rates appear to have further fueled demand, with some households likely deferring space-adding renovations or larger home purchases.
In Q1 2025, visits to Public Storage and CubeSmart were up 24.7% and 30.7%, respectively, compared to a Q1 2019 baseline. Extra Space Storage – which substantially expanded its unit count following its 2023 acquisition of Life Storage – saw visits surge 98.3% over the same baseline. And year over year (YoY), all three chains posted foot traffic growth, partly driven by continued expansion.
The baseline visit analysis also reveals a distinct seasonal pattern in self-storage usage patterns. Each year, visits to self-storage chains peak in Q2 and Q3 (April through September), aligning with spring cleaning, home improvement prime time, and moving season. Then in Q1, visits drop as people stay indoors during winter – likely also making fewer trips to access recreational gear and vehicles in storage.
Checking the Boxes
Who are the consumers driving self-storage visit growth? Looking at the demographic characteristics of Extra Space Storage, Public Storage, and CubeSmart’s visitor bases reveals a common consumer profile across chains. In Q1 2025, the captured markets of all three chains had nearly identical median household incomes (HHIs), very close to the nationwide baseline of $79.6K. Their markets were also disproportionately urban, with higher-than-average shares of renter-occupied and multi-unit housing – all groups more likely to need extra storage space.
Stashing Stuff in the ‘Burbs
Still, as the self-storage market has grown, industry leaders have grown their presence in more affluent suburban markets. Between Q1 2019 and Q1 2025, Extra Space Storage’s share of “Wealthy Suburban Families” rose from 9.1% to 10.1% – slightly above the nationwide baseline of 9.6%. Meanwhile, Public Storage’s share of this segment increased from 8.8% to 9.8%, and CubeSmart’s share remained steady at 10.1%. A similar pattern emerged for “Upper Suburban Diverse Families”, with all three chains at or above the nationwide segment baseline of 9.0% by Q1 2025.
This small but perceptible shift may reflect rising demand from households where adult children are increasingly staying at home or returning after college, prompting a need for additional storage. Spare rooms once used for storage may also be increasingly repurposed into home offices, studios, or workout spaces in the wake of hybrid work trends.
Looking Ahead
Known for resilience in the face of economic headwinds and uncertainty, the self-storage space appears well-positioned to continue to thrive. How will the segment evolve in the years and months ahead?
Follow Placer.ai/anchor to find out.

