If 2025 proved anything, it’s that the American consumer hasn’t stopped spending – they’ve just become incredibly selective about who earns their dollar. As we look toward 2026, success isn't just about weathering headwinds; it's about identifying the specific operational levers that drive traffic.
We analyzed the data to identify ten retail and dining standouts (presented in no particular order) that are especially well-positioned for the year ahead. From grocery icons mastering hyper-authenticity to fitness challengers proving that low price doesn't mean low quality, these companies have demonstrated a powerful understanding of their audience and the operational agility to meet them where they are.
Here – in no particular order – are the brands setting the pace for 2026.
1. H-E-B
When we pick retailers for our Ten Top list, there are some that rest on the edgier side and others that look fairly down the middle. Picking H-E-B, a grocer that has seen monthly visits up year over year (YoY) for all but one month since April of 2021, is clearly not one of the bolder claims. But consistent success shouldn’t preclude a retailer from receiving its well deserved kudos, and there are some unique reasons that H-E-B specifically needs to be included this year.
H-E-B exemplifies the single most important trend in retail: the need for a brand to have authenticity and a clear reason for being. The retailer understands its audience, and as a result, it’s able to optimize its merchandising, promotions, and experience to best serve that loyal customer base. This pops in the data when we see the loyalty H-E-B commands, especially when compared to the grocery average.
In addition, the chain has also embraced adjacent innovation, leveraging its existing fleet by adding True Texas BBQ to a growing number of locations. The offering not only helps maximize the revenue potential of each visit, it taps into the core identity of the brand, further deepening customer connection and authenticity. The strategy also signals H-E-B’s understanding of emerging consumer behaviors – particularly the increase in shoppers turning to grocery stores for affordable, restaurant-quality lunches. And this combination of expanding revenue channels while heightening H-E-B’s uniqueness should also carry over into the value and impact of its retail media network.
In short, H-E-B has not only identified a critical route to success, it continues to embrace channels that widen revenue potential while doubling down on foundational strengths.
2. Michaels
In 2024, Michaels held nearly 32.0% of overall visit share among the top four retailers in the wider crafts and hobby space. By the second half of 2025, that number had skyrocketed to just over 40.0% – driven largely by the closures of key competitors JoAnn Fabrics and Party City.
And it isn’t just that the removal of competitors is increasing the share of overall visits; the rate of capture appears to be accelerating. In Q2 2025, visits rose 7.3% YoY as Michaels began absorbing traffic from Party City, which closed the bulk of its locations by March. Growth strengthened further in Q3, with visits up 13.1% YoY following the completion of JoAnn’s shutdown in May. But during the all-important Q4, traffic surged even higher YoY, suggesting that that consolidation alone doesn’t fully explain the gains.
While the tailwinds of competitor closures clearly help, there are other strategies that are helping the retailer maximize this wave. Whether it be NFL partnerships to boost the retailer’s Sunday role in American households, a push into the framing space with 10-minute custom framing, the addition of JoAnn’s branded merchandise to its offerings, or even a challenge to Etsy’s online dominance with a new marketplace – Michaels is making moves to take full advantage of their improved positioning. There is also an argument to be made that Michaels is the retailer best poised to benefit from the segment’s consolidation, given that it is also the most oriented to a higher income consumer among top players in the category. This could help unlock other more focused concepts and promotions, and better align with an audience now looking for a retail replacement.
3. Walmart
Walmart is the dominant player in physical retail.
And they leverage this position to push forward new offerings that extend revenue potential while maximizing per-store impact. They are a pioneer in the retail media space and have been using their unique reach to push that side of the business forward. Add to that the fact that they have been among the savviest players in all of retail in identifying the ideal approach to omnichannel, utilizing their massive physical footprint to improve their reach via BOPIS and store-fulfilled e-commerce.
All good reasons for inclusion, right?
But, here’s the kicker - from a pure visit perspective, things are going from good to better. Between January and September 2025, Walmart visits were essentially flat year over year – a good position for a retailer with such a massive reach and such strength shown in recent years. Yet, since October, visits have actually been on the rise, with Q4 2025 showing a 2.5% YoY traffic increase and several weeks exceeding 4.0% YoY.
A retail giant with even more potential growth than we might have expected – and one that’s pushing the very strategies we believe are the key to future success? That’s certainly a reason for inclusion.
4. Dillard’s
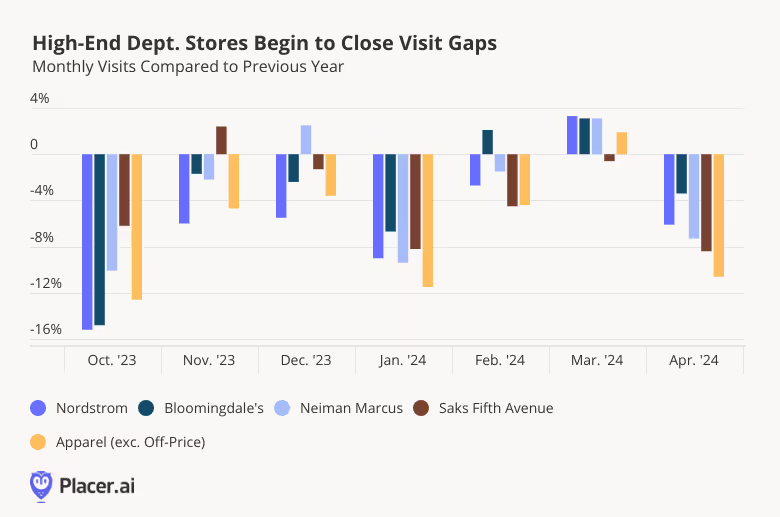
Including a department store again on this year’s list? It seems counterintuitive to many of the narratives that ran through 2025, especially as middle-class consumers continue to be squeezed financially. However, Dillard’s still appears to be an exception to the rule, with performance more closely aligned to that of luxury department store brands like Bloomingdales & Nordstrom than to its true competitive set.
In 2025, visitation to Dillard’s was essentially flat YoY – though the chain has consistently outperformed the wider department store category. Dillard’s stands at a unique point somewhere between a mid-tier and luxury department store, and that distinction may be its secret to success. The retailer continues to wow with strong private label offerings that rival and often exceed national brands, a diverse merchandise mix, and locations that often benefit from indoor mall traffic trends.
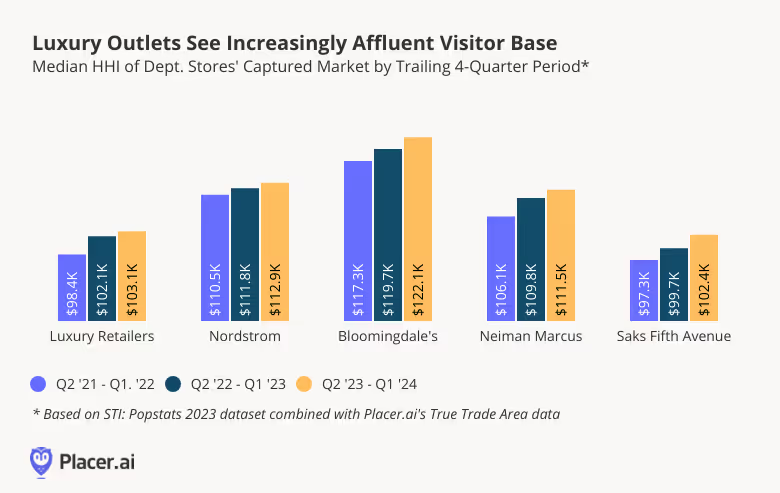
While Dillard’s lags behind the wider department store category, for example, in terms of repeat visitation and the share of wealthy visitors, these factors may actually create an advantage. Efforts by Dillard's to refresh its product mix through limited-edition capsule collections and new brand launches may be helping it attract a steady inflow of economically diverse new shoppers. And the ability to continually win over new segments without alienating a “core customer” could be a strength amid economic headwinds and waning consumer sentiment.
At the same time, a more diverse visitor profile means that Dillard’s can truly be the department store for many consumers, with a product range that strikes a chord with different shopper segments.
Department stores truly aren’t dead, and those who have found their reason to exist continue to garner attention with shoppers.
5. POP MART
If the retail industry had a symbol for 2025, it was probably Labubu. The toy-and-collectible-turned–bag charm took consumers by storm in the second quarter of the year, and POP MART – the retailer responsible for bringing Labubus stateside – quickly became an overnight sensation. Visits to the chain surged over the summer at the height of the craze, while trade areas expanded as customers traveled significant distances to get their hands on a doll.
And although the frenzy cooled somewhat in early fall, visits to POP MART locations like the one in Tulalip, WA began trending upward once again in November 2025 as the holiday season approached, surging even higher in December. Trade area size also increased dramatically during the holiday shopping period, as consumers rushed to get their hands on the chain’s coveted line of festive blind boxes.
As demonstrated by the recent Starbucks Bearista craze, consumers are all-in on cool collectible items that make life more fun – a trend POP MART, strategically located in high-traffic malls popular with younger shoppers, is uniquely positioned to ride. During times of economic uncertainty, consumers crave small ways to indulge, and affordable collectibles that are cute, cuddly, and fun have worked their way into the American zeitgeist.
So, what is next for POP MART? Can it continue to sustain its momentum? It seems likely that Labubus are here to stay, at least for a little while longer, before the retailer hopefully strikes it big with the next “must have”.
6. 7 Brew
When all is said and done, 2021-2025 will likely be viewed as a pivotal turning point for the U.S. coffee industry. As the country recovered from the pandemic, consumer interaction with coffee brands fundamentally shifted. With more employees working from home – bypassing the traditional pre-work coffee run – visit trends migrated to later in the morning and afternoon. Meanwhile, industry-wide dwell times shortened as consumers renewed their focus on convenience.
This move away from the sit-down café experience placed significant pressure on industry leaders, accelerating the shift toward drive-thru and mobile order-and-pay options. This moment of friction also created space for drive-thru-centric challengers like Dutch Bros, which rapidly expanded on the strength of speed and menu innovation.
Among these challengers, 7 Brew stands out as a fast-rising powerhouse heading into 2026. Expanding outward from its Arkansas roots, 7 Brew has been strategic about market entry and site selection for its unique double-drive-thru format. And with a concept that resonates with younger demographics and a footprint adaptable to various geographies, the coffee chain has become a go-to destination for rural and small-town communities, while also maintaining solid reach among more traditional coffee segments like wealthy suburbanites and urban singles. Thanks in part to this broad appeal, 7 Brew is well-positioned for future growth, even as it faces stiffer competition in new markets.
7. Dave's Hot Chicken
It is no secret that most of the growth in the QSR space over the past two decades has been driven by chicken concepts. Chick-fil-A, rising from a regional chain to a national player throughout the late 1990s and 2000s, was the first to disrupt the burger’s stranglehold on QSR. Raising Cane’s followed in the 2010s with a model built on menu simplicity and operational excellence, earning its place as one of the largest chains in the category. More recently, hot chicken has emerged as one of the fastest-growing segments – and Dave’s Hot Chicken is leading the charge.
No single factor accounts for Dave’s growth from a lone unit in Los Angeles to over 350 units today. Certainly, a wide assortment of sauces and flavor profiles has resonated with U.S. consumers who are increasingly seeking spicier products, while Dave’s 'rebel' brand positioning has successfully attracted younger audiences. And at a time when many QSR and fast-casual chains are abandoning urban locations in favor of suburban markets, Dave’s Hot Chicken continues to open predominantly in urban settings – a strategy that may prove advantageous as migration patterns shift back toward major cities this year.
With so much of the industry’s expansion driven by chicken concepts, it is natural to ask: Have we reached 'peak chicken'? While we are certainly seeing other categories gain traction – think CAVA – Dave’s unique product mix and edgier marketing should help it stand out, even amidst increased competition.
8. HomeGoods & Homesense
While many discretionary retail categories – including consumer electronics, sporting goods, home improvement, and furniture – are still waiting for post-pandemic demand to recover, housewares retailers have generally enjoyed solid visit trends in 2025. Although consumers may not be financially positioned for large-scale remodels, we are now five years past the pandemic, and many residents (many of whom still work from home) are looking to refresh their living spaces.
It may therefore come as no surprise that TJX Companies’ HomeGoods and Homesense brands had an exceptional 2025 and are well-positioned to repeat this success in 2026.
This year, we observed a behavioral shift among middle-income consumers, including a clear “trade down” from mid-tier department stores and other discretionary categories. In addition, accumulated housing wear-and-tear, the recent bankruptcies of value-oriented competitors such as Conn’s and At Home, and the enduring appeal of the treasure hunt retail model, have all reinforced the brands’ momentum. Taken together, these trends leave HomeGoods and Homesense poised for both continued unit growth and increased traffic in the year ahead.
9. EōS Fitness
With the heightened emphasis on health and wellness post-pandemic, fitness is proving to be a category with remarkable staying power well beyond New Year’s resolution season – even in an era of macroeconomic uncertainty. Whether it’s pumping iron, hitting the treadmill, or joining fitness classes, staying healthy no longer requires breaking the bank – for just a dollar a day or less, gymgoers can build strength and endurance, achieve their rep goals, and hit their mileage targets. And affordable fitness chains – those that charge less than $30 per month – are reaping the benefits, outperforming more expensive gyms for YoY visit growth.
Among this value-oriented fitness cohort, EōS saw outsized traffic growth in 2025, with both overall visits and average visits per location outpacing competitors as the chain expands its footprint. EōS’s motto, “High Value, Low Price,” appears to be resonating strongly – especially in a year when similar value propositions are driving momentum across off-price retailers, value grocers, and dollar stores. Longer-than-average dwell times at EōS provide another encouraging signal, suggesting that its amenities, including pools, saunas, basketball courts, and equipment assortments typically found in higher-priced gyms, are truly connecting with visitors. And since visitors who stay longer are more likely to return – and to renew their memberships – EōS is well-positioned to convert this year’s traffic gains into lasting market share.
10. Chuck E. Cheese
Eating and entertainment are a match made in heaven — and by leaning into a subscription model that meets price-sensitive customers where they are, Chuck E. Cheese has solidified its position as a standout in the eatertainment category.
Nearly 50 years old, this evergreen children’s entertainment concept has stood the test of time and now boasts roughly 500 venues nationwide. Its perennial tagline – “where a kid can be a kid” – still resonates with today’s children and with the parents who grew up with the brand. After languishing for several years in the wake of COVID, the company turned things around with a revamped Summer Fun Pass launched on April 30th, 2024. The offer of unlimited play per month sparked a dramatic boost in customer loyalty, and the model proved so successful that the company extended it year-round with a family pass as low as $7.99 per month.
This strategy has helped sustain visit growth throughout 2025. Despite closing several locations during the year, visits to Chuck E. Cheese rose 8.3% YoY – well above the flat eatertainment average. And the company’s loyalty rates outpaced last year from August through November, indicating that the offering isn’t losing steam and that customers continue to respond enthusiastically.
Retail’s Next Chapter
The diversity of brands featured in this report highlights that there is no single path to success in 2026.
H-E-B and Chuck E. Cheese demonstrate the power of deepening loyalty through authentic experiences and value-driven memberships. Michaels and HomeGoods show how savvy retailers can capitalize on competitor consolidation and changing consumer spending habits. Meanwhile, Walmart and 7 Brew prove that even in saturated markets, operational innovation can drive fresh momentum.
As we move deeper into 2026, the brands that win will be those that, like the ten profiled here, combine a clear understanding of their unique value proposition with the agility to execute on it.


.svg)


.avif)


