Q2 2024 Overview
The positive retail momentum observed in Q1 2024 continued into Q2 – as stabilizing prices and a strong job market fostered cautious optimism among consumers. Year-over-year (YoY) retail foot traffic remained elevated throughout the quarter, with June in particular seeing significant weekly visit boosts ranging from 4.7% to 8.5%.
The robustness of the retail sector in Q2 was also highlighted by positive visit growth during the quarter’s special calendar occasions, including Mother’s Day (the week of May 6th) and Memorial Day (the week of May 27th). And though consumer spending may moderate as the year wears on, retail’s strong Q2 showing offers plenty of room for optimism ahead of back-to-school sales and other summer milestones.
Consumers Double Down on Value and Essential Goods
On a quarterly basis, overall retail visits rose 4.2% in Q2. And diving into specific categories shows that value continued to reign supreme, with discount and dollar stores seeing the most robust YoY visit growth (11.2%) of any analyzed category.
Other essential goods purveyors, such as grocery store chains (7.6%) and superstores (4.6%), also outperformed the overall retail baseline. And fitness – a category deemed essential by many health-conscious consumers – outpaced overall retail with a substantial 6.0% YoY foot traffic increase.
The decidedly more discretionary home improvement industry performed less well than overall retail in Q2 – but in another sign of consumer resilience, it too experienced a YoY visit uptick. And overall restaurant foot traffic increased 2.6% YoY.
Discount & Dollar Stores
Discount and dollar stores enjoyed a strong Q2 2024, maintaining YoY visit growth above 10.0% for six out of the quarter’s 13 weeks. Only during the week of April 1st did the category see a temporary decline, likely the result of an Easter calendar shift. (The week of April 1st 2024 is being compared to the week of April 3rd, 2023, which included the run-up to Easter)
Some of this growth can be attributed to the continued expansion of segment leaders like Dollar General. But the category has also been bolstered by the emphasis consumers continue to place on value in the face of still-high prices and economic uncertainty.
Expanding Store Counts – and Visits
Dollar General, which has been expanding both its store count and its grocery offerings, saw YoY visits increase between 9.1% and 15.9% throughout the quarter. Affordable-indulgence-oriented Five Below, which has also been adding locations at a brisk clip, saw YoY visits increase between 4.9% and 18.8%.
And though Dollar Tree has taken steps to rightsize its Family Dollar brand, the company’s eponymous banner – which caters to middle-income consumers in suburban areas – continued to grow both its store count and its visits in Q2.
Grocery Stores
Grocery store chains also performed well in Q2 2024 – experiencing strongly positive foot traffic growth throughout the quarter. Though the sector continues to face its share of challenges, stabilizing food-at-home prices and improvements in employee retention and supply chain management have helped propel the industry forward.
Aldi Ahead of the Pack
Diving into the performance of specific chains shows that within the grocery segment, too, price was paramount in Q2 2024 – with limited-assortment value grocery stores like Aldi and Trader Joe’s leading the way.
Traditional chains H-E-B and Food Lion (owned by Ahold Delhaize) – both of which are known for relatively low prices – outperformed the wider grocery sector with respective YoY foot traffic boosts of 11.4% and 8.7%. But ShopRite, Safeway (owned by Albertsons), Kroger, and Albertsons also drew more visits in Q2 2024 than in the equivalent period of last year.
Fitness
Fitness has proven to be relatively inflation-proof in recent years – thriving even in the face of reduced discretionary spending and consumer cutbacks. Indeed, rising prices may have actually helped boost gym attendance, as people sought to squeeze the most value out of their monthly fees and replace pricy outings with already-paid-for gym excursions.
And despite lapping a remarkably strong 2023, visits to gyms nationwide remained elevated YoY in Q2 2024.
Value Fitness Holds Sway
Diving into the data for some of the nation’s leading gyms shows that today’s fitness market has plenty of room at the top. Planet Fitness, 24 Hour Fitness, Life Time Fitness, Orangetheory Fitness, and LA Fitness all experienced YoY visit growth in Q2 2024 – reflecting consumers’ enduring interest in all things wellness-related.
But it was EōS Fitness and Crunch Fitness – two value gyms that have been pursuing aggressive expansion strategies – that really hit it out of the park, with respective YoY foot traffic increases of 23.4% and 21.4%.
Superstores
The week of April 1st saw a decline in YoY visits to superstores – likely attributable to the Easter calendar shift noted above. But the category quickly rallied, and with back-to-school shopping and major superstore sales events coming up this July, the category appears poised to enjoy continued success throughout the summer.
Wholesale Clubs Maintain Their Lead
Within the superstore category, wholesale clubs continued to stand out – with Costco Wholesale, Sam’s Club and BJ’s Wholesale Club enjoying YoY foot traffic growth ranging from 12.0% to 7.4%. But Target and Walmart also impressed with 4.6% and 4.0% YoY visit increases.
Home Improvement and Furnishings
Inflation, elevated interest rates, and a sluggish real estate market have created a perfect storm for the home improvement industry, with spending on renovations in decline. The accelerated return to office has likely also taken its toll on the category, as people spend more time outside the home and have less availability to immerse themselves in DIY projects.
But despite these challenges, weekly YoY foot traffic to home improvement and furnishing chains remained elevated throughout much of the Q2 – with June and April seeing mostly positive YoY visit growth, and May hovering just below 2023 levels. This (modest) visit growth may be driven by consumers loading up on supplies for necessary home repairs, or by shoppers seeking materials for smaller projects. And given the importance of Q2 for the home improvement sector, this largely positive snapshot may offer some promise of good things to come.
Value Fuels Growth at Harbor Freight Tools
Some chains within the home improvement category continued to perform especially well in Q2 2024 – with rapidly expanding, budget-oriented Harbor Freight Tools leading the pack. But Ace Hardware, Menards, The Home Depot, and Lowe’s also saw foot traffic increases in Q2, showcasing the category’s resilience in the face of headwinds.
Restaurants
Restaurants – including full-service restaurants (FSR), quick-service restaurants (QSR), fast-casual chains, and coffee chains – lagged behind grocery stores and other essential goods retailers in Q2 2024, as price-sensitive consumers prioritized needs over wants and ate at home more often.
Still, YoY restaurant foot traffic remained up throughout most of the quarter. And impressively, the sector saw a YoY visit uptick during the week of Mother’s Day (the week of May 6th, 2024, compared to the week of May 8th, 2023) – an important milestone for FSR.
Chain Expansion Drives Restaurant Visit Growth
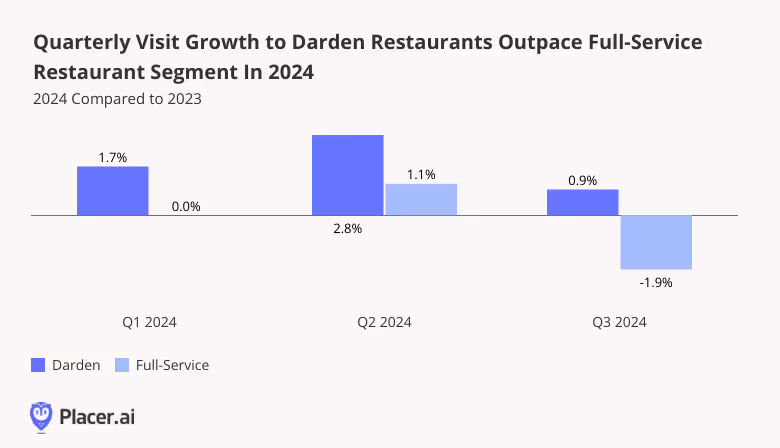
The restaurant industry’s YoY visit growth was felt across segments – though fast-casual and coffee chains experienced the biggest visit boosts. Like in Q1 2024, fast-casual restaurants hit the sweet spot between indulgence and affordability, outpacing QSR in the wake of fast food price hikes. And building on the positive YoY trendline that began to emerge last quarter, full-service restaurants finished Q2 2024 with a 1.4% YoY visit uptick.
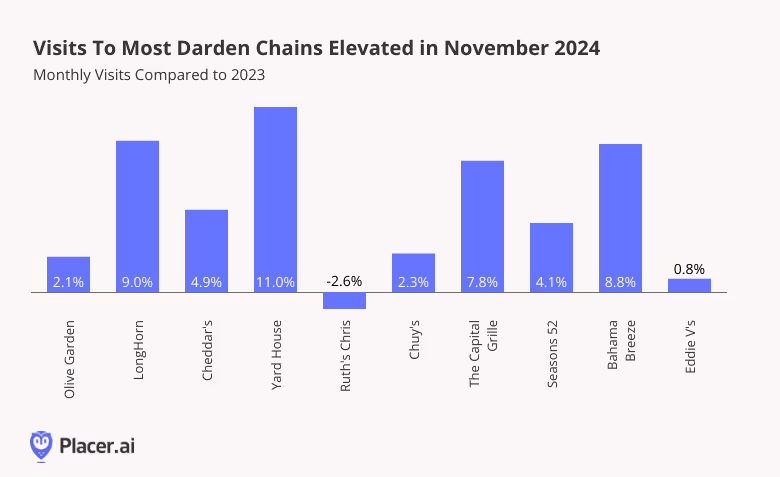
Chain expansion was the name of the restaurant game in Q2 2024, with several chains that have been growing their footprints outperforming segment averages – including CAVA, Chipotle Mexican Grill, Ziggi’s Coffee, California-based Philz Coffee, Raising Cane’s, Whataburger, and First Watch. Chili’s Grill and Bar also outpaced the full-service category average, aided by the revamping of its “3 for Me” menu.
Positive Momentum Heading Into Summer
Retailers and restaurants in Q2 2024 continued to face plenty of challenges, from inflation to rising labor costs and volatile consumer confidence. But foot traffic trends across industries – including both essential goods purveyors like grocery stores and more discretionary categories like home improvement and restaurants – suggest plenty of room for cautious optimism as 2024 wears on.


.svg)