


.svg)


Expansion Drove Growth – Until Late Fall
Between July and October 2025, Chipotle’s year-over-year (YoY) visit growth was driven almost entirely by expansion. Overall chain-wide visits rose each month, while same-store visits remained negative, generally hovering between -1% and -2%.
This pattern aligns closely with Chipotle’s recent earnings results. In Q2 2025, the company reported a 4% decline in comparable restaurant sales driven by a nearly 5% drop in transactions, even as average check size increased modestly. Q3 showed a slight improvement in same-store sales, but that gain was driven by higher checks rather than traffic, prompting Chipotle to trim its same-store sales outlook to a low single-digit decline. Throughout this period, digital sales remained a significant share of revenue, and new restaurant openings continued to support overall growth.
More recent visit data, however, suggests the dynamic may be shifting. In November, same-store visits turned slightly positive, contributing to a stronger increase in total chain-wide traffic, and December data shows that improvement continued to build. While expansion remains a key driver, this emerging pattern suggests existing locations may be starting to regain momentum.
Ten Minutes to Win It
Some of Chipotle’s late-year momentum appears to be driven by a growing share of short visits (defined as those lasting under ten minutes), which accounted for 42.2% of total chain traffic in 2025 – up from 41.2% in 2024. These quicker trips have consistently outperformed longer visits on a YoY basis, making their increasing share an important contributor to overall visit growth.
Importantly, the rise in short visits does not appear to be coming at the expense of longer ones. From July through October 2025, average per-location visits lasting under ten minutes remained essentially flat even as longer visits continued to lag; by December, however, both short and longer visits were growing on a per-location basis. This pattern indicates that the shift toward convenience is not cannibalizing traditional visit occasions, but may instead be lifting overall engagement with the brand.
The Bigger Signal
Chipotle still benefits from expansion, but the more important story may be what’s happening inside existing restaurants: Same-store visits are stabilizing while quick trips gain share. And with the December launch of an all-new high-protein menu, Chipotle is signaling that it isn’t standing still – it’s continuing to refine its offerings to stay relevant as customer expectations and visit behaviors change.
For more data-driven dining insights, visit Placer.ai/anchor.
Placer.ai leverages a panel of tens of millions of devices and utilizes machine learning to make estimations for visits to locations across the US. The data is trusted by thousands of industry leaders who leverage Placer.ai for insights into foot traffic, demographic breakdowns, retail sale predictions, migration trends, site selection, and more.

Brick-and-Mortar Retail Ends 2025 On a High Note
Brick-and-mortar retail ended 2025 on a high note, with offline retailers posting a 2.4% increase in traffic in Q4 2025 relative to Q4 2024. This growth underscores the sector’s continued relevance even amid ongoing e-commerce growth and reinforces that retail growth is not a zero-sum dynamic, but one in which physical and digital channels increasingly coexist and complement one another.
The traffic gains during the holiday season also highlights the particular appeal of physical retail during the holiday season, when demand for in-person shopping experiences is particularly high. And as retailers refine store formats, right-size footprints, and better integrate physical locations into omnichannel strategies, brick-and-mortar retail is well positioned to remain a critical growth and engagement channel heading into 2026.
Foot Traffic Strength Signals Durable Demand for Logistics Space
Foot traffic to e-commerce distribution centers remained consistently positive YoY throughout 2025, underscoring the strength of the logistics segment and signaling durable demand for logistics space rather than short-term fluctuations. This pattern aligns with the broader trajectory of e-commerce in the U.S., where online retail sales are projected to continue expanding, and reflects a broader structural shift in how goods move through the economy, with fulfillment infrastructure playing an increasingly central role.
This consistency is driven by long-term forces shaping retail and supply chains, including omnichannel fulfillment, faster delivery expectations, and inventory decentralization. As retailers rely more heavily on regional distribution nodes to support ship-from-store, curbside pickup, and next-day delivery, logistics facilities have become essential infrastructure rather than optional back-end operations. Even as growth moderated slightly later in the year, the persistence of positive YoY traffic points to sustained operational intensity and long-term relevance.
December Uptick Points to Stabilizing Manufacturing Activity
Year-over-year (YoY) foot traffic to U.S. manufacturing facilities points to volatility rather than sustained growth, reflecting a sector that is actively managing uncertainty. Visits declined during much of the year, suggesting restrained hiring as manufacturers appear to be operating lean – adjusting labor and on-site activity quickly in response to demand changes. Productivity gains and automation are likely also playing a role, allowing facilities to maintain output with less consistent physical presence. As a result, the foot traffic volatility may be reflecting operational flexibility rather than simple expansion or contraction.
Against this backdrop, December stands out with a clear uptick in manufacturing visits, signaling increased end-of-year activity. This rise likely reflects a mix of year-end production runs, inventory adjustments, maintenance work, and preparation for early-year demand. The December traffic increase reinforces that U.S. manufacturing – still one of the largest and most economically significant sectors globally – is adapting, not retreating, maintaining operational relevance even as it recalibrates for efficiency, automation, and selective growth.
For more data-driven retail & CRE insights, visit placer.ai/anchor.
Even as return-to-office (RTO) mandates continue to accumulate, December operates on a different rhythm – shaped as much by holiday flexibility and inclement weather as by formal policy. We dove into the data to see how office attendance reflected these dynamics this year.
The Quietest Month
In December 2025, visits to office buildings nationwide were 33.1% below 2019 levels – 36.2% below when accounting for working days – the widest year-over-six-year (Yo6Y) gap seen in recent months on a per-working-day basis.
But the softness appears to reflect shifting work patterns rather than a stalled recovery. Despite slowing from recent months, December 2025 was still the busiest in-office December since COVID, suggesting that the slowdown was driven by seasonal rhythms rather than any substantive pullback in office attendance.
December has long followed a different in-office rhythm than the rest of the year – and despite return-to-office mandates, many companies likely relax on-site expectations during the holidays, allowing employees to work remotely while traveling or spending time with family. Much like the TGIF workweek, which sees a consistent drop-off in office activity on Fridays despite RTO pushes, the December dip may simply reflect the solidification of a new post-COVID seasonal norm.
Local Factors Shape the December Dip
Local factors also appear to have impacted December office attendance. Miami saw a visit gap of just 10.9% versus 2019, followed by Dallas at 18.8%. As warm-weather cities that also see the highest Friday office attendance among the analyzed markets, both may be less susceptible to holiday-adjacent work-from-home behavior.
New York City, by contrast, recorded a 19.6% visit gap, likely weighed down by harsher winter weather and an early, severe flu season. And Chicago trailed the pack with a 47.6% visit gap, pointing to a sharper seasonal pullback that may have been amplified by winter conditions, elevated flu activity, and workers opting to travel to warmer destinations during the holidays.
Year-Over-Year Momentum Still Points Up – Especially for SF
The year-over-year (YoY) analysis further reinforces that December’s softness is seasonal rather than a reflection of a true RTO slowdown. Even after adjusting for the number of working days, nationwide office visits rose 4.9% YoY, and every tracked market posted gains.
That said, growth remained uneven across major cities. San Francisco posted the strongest YoY gains, even as it continued to trail most other analyzed markets in overall office recovery – reflecting an ongoing vibe shift in a city once defined by post-pandemic pessimism. And with the city’s AI-driven leasing boom showing no signs of slowing, that momentum appears likely to carry into 2026.
Elsewhere, YoY gains were smaller than in San Francisco but still meaningful, pointing to steady progress across markets even as recovery paths vary by city.
A New Year, New Mandates
The data suggests that December’s softening reflects predictable holiday-season flexibility rather than weakening momentum. And with several high-profile return-to-office mandates set to take effect in early 2026 – and other employers continuing to nudge attendance higher through quieter forms of “hybrid creep”– the broader office recovery appears poised to reassert itself in the new year.
For more data-driven office insights follow Placer.ai/anchor.
Placer.ai leverages a panel of tens of millions of devices and utilizes machine learning to make estimations for visits to locations across the US. The data is trusted by thousands of industry leaders who leverage Placer.ai for insights into foot traffic, demographic breakdowns, retail sale predictions, migration trends, site selection, and more.

Limited-service restaurants faced a challenging landscape in 2025, with many price-sensitive consumers pulling back on dining out in favor of grocery prepared meals and brown-bag lunches. Traffic was harder to come by, and everyday demand softened across much of the category.
Even so, chains found creative ways to stand out. We dug into the data behind the busiest weeks of the year for quick-service and fast-casual restaurants to understand what actually moved traffic – and which strategies are most likely to help brands compete in what’s shaping up to be another value-conscious year.
1. Eye-Catching Discounts That Cut Through the Noise
Everyday value became table stakes across limited service in 2025, with $5 meals, bundles, and loyalty pricing no longer serving as clear differentiators. Yet unsurprisingly, freebies and truly memorable discounts still drew crowds.
The chains featured in the chart below all saw their highest weekly traffic peaks during promotions that felt distinctive, easy to understand, and clearly worth acting on. Some – like Dairy Queen’s Free Cone Day and Dave’s Hot Chicken’s Free Slider Day – involved no-purchase-necessary giveaways. Others relied on steep, attention-grabbing discounts, such as Whataburger’s Anniversary 75-cent burger and Pizza Hut’s $2 Tuesday promo, or culturally timed activations like Chipotle’s Stanley Cup–inspired hockey jersey BOGO.
For 2026, the takeaway is clear: Discounting still works, but the offers likely to truly motivate consumers are the ones that stand out from the everyday value they already expect.
2. Culture Can Rival Free
Fortunately for restaurants, however, deep discounts and giveaways aren’t the only way to draw crowds - if they were, the economics wouldn’t be sustainable for long. In 2025, culture-driven moments came surprisingly close to matching the power of freebies, without the same margin trade-offs.
Take Krispy Kreme, for example. The chain’s annual National Donut Day promotion – including a no-purchase-necessary free donut and a $2 dozen with the purchase of 12 more – produced the chain’s largest single-day visit spike of the year (+219.7% versus an average day on June 6th, 2025) and helped push weekly visits to a yearly high.
But Krispy Kreme’s Back to Hogwarts collection which launched on August 18, 2025, generated a more sustained lift that nearly matched National Donut Day’s impact at the weekly level. While the campaign did include a free donut giveaway on Saturday, August 23rd for fans representing their favorite house, the data shows the surge wasn’t driven by the freebie alone: Traffic jumped 40.7% above an average Monday on launch day, compared with a 30.9% lift over an average Saturday on the day of the giveaway.
At McDonald’s and Burger King, too, pop-culture tie-ins dominated the promotional calendar. For both chains, the week of December 1st emerged as the busiest week of 2025, and also delivered the largest YoY weekly visit increase.
At Burger King, the lift came from the chain’s SpongeBob Movie Menu – starring the Krabby Whopper – launched on December 1st ahead of the film’s December 19th release. The promotion drove an 18.4% YoY traffic increase, with traffic – largely flat or down since September – remaining elevated in the weeks that followed.
At McDonald’s, momentum was fueled by a holiday-themed Grinched Menu, which arrived on the heels of the fast food leader’s highly successful Boo Bucket merchandise drop in October. The Boo Buckets drove McDonald’s second- and third-largest year-over-year visit spikes during the weeks of October 20 and 27, and the Grinch Meal built on that lift, pushing visits higher yet during the week of December 1st and sustaining momentum through the rest of the month.
The lesson here is twofold: Well-timed promotions tied to widely recognized cultural moments can still drive outsized traffic on their own, as Krispy Kreme and Burger King’s activations showed. But McDonald’s performance also underscores the value of sequencing – using one successful launch to carry momentum into the next.
3. Bearista: Storytelling and Scarcity
Speaking of timing and sequencing, Starbucks’ viral Bearista offering, launched strategically just before the Brand’s iconic Red Cup Day, shows how well-timed promotions can compound impact.
Red Cup Day during the week of November 10th was Starbucks’ busiest day of 2025. But the week of Bearista (November 3rd) came awfully close – and delivered the brand’s largest YoY weekly visit increase of 2025. Just as importantly, the Bearista launch helped build visit momentum, setting the stage for what ultimately became Starbucks’ biggest Red Cup Day ever.
Consumers lining up to pay $30 for the Bearista also challenged another long-held assumption about QSR traffic in 2025: that offerings have to be cheap to deliver results. What makes this especially notable is that Bearista wasn’t tied to a movie release or external cultural IP. It was brand-first, premium-priced merchandise that still drove traffic at scale. And while not easily replicated, Starbucks’ Bearista success shows that scarcity, storytelling, and timing can unlock value beyond low-price promotions.
4. Ummm… What About Food?
If you’ve gotten this far, you might be wondering: What about food? Don’t people still go to restaurants to eat – and aren’t craveable menu items supposed to drive traffic?
The answer is yes. Amid all the noise around discounts, collaborations, and merchandise, food still mattered in 2025. At Popeyes, the June 2nd launch of Chicken Wraps, priced accessibly at $3.99, drove the chain’s busiest week of the year. While wraps weren’t totally new to Popeyes’ menu, this rollout was framed as a value-forward, easy-to-understand innovation at a moment when affordability mattered – and consumers responded.
At Taco Bell and KFC, food-driven traffic spikes leaned more heavily on nostalgia. Taco Bell’s limited-time revival of Cheesy Street Chalupas and Quesaritos lifted visits roughly 8% above average, while KFC saw an even larger jump (11.4%) with the return of Potato Wedges and Hot & Spicy Wings. These weren’t experimental launches, but deliberate re-releases of proven favorites, giving diners something familiar and a reason to act quickly.
Together, these examples show that even in a crowded promotional landscape, menu remains a core traffic lever – and that clearly positioned items can rise above the noise without flashy add-ons.
Lessons for 2026
The busiest weeks of 2025 show that even in a tough, value-conscious environment, limited-service restaurants still have multiple, proven ways to drive traffic. From clear deep discounts that rise above the noise to culture-led moments, narrative-driven merchandise, and well-timed menu strategies also delivered some of the year’s strongest results.
As QSRs and fast-casual chains look ahead to 2026, the data suggests that winning won’t hinge on any single tactic, but on choosing the right lever for the right moment, and executing it clearly enough to cut through a crowded landscape.
For more data-driven dining insights, follow Placer.a/anchor.
Placer.ai leverages a panel of tens of millions of devices and utilizes machine learning to make estimations for visits to locations across the US. The data is trusted by thousands of industry leaders who leverage Placer.ai for insights into foot traffic, demographic breakdowns, retail sale predictions, migration trends, site selection, and more.
The Sacramento-Roseville-Folsom metro area is emerging as one of California’s most resilient growth stories. Between 2021 and 2023, the region added residents at a steady, if modest, pace, even as the state overall faced declining or stagnant population trends. And by 2024, the CBSA pulled ahead of the national metro average for year-over-year (YoY) population growth, outpacing major California peers including Los Angeles, San Francisco, and San Diego.
What’s driving this momentum? And how is Sacramento’s rise shaping local retail and dining trends?
People Powering Progress
One factor behind Sacramento’s rise may be its economic diversity. The metro area is over-indexed for a broad cross-section of audience segments, ranging from wealthy and upper suburban families earning more than $100K to young urban singles and professionals bringing in less than $75K. And though the area’s median household income (HHI) sits below the California baseline, the diversity of household types – each contributing different spending patterns – creates a strong foundation for continued economic growth.
Retail on a Roll
Location analytics also show that Sacramento’s expanding, economically diverse population is fueling a flourishing retail scene. From May through October 2025, overall retail visits in the CBSA rose YoY, outperforming California’s state average and keeping pace with national trends. In several key categories – including discount and dollar stores, home furnishings, superstores, and traditional apparel – the metro area exceeded both state and national benchmarks, underscoring Sacramento’s rising consumer strength and regional momentum.
Dining Finds Its Groove
Greater Sacramento’s dining scene is also thriving. Fast-casual and quick-service chains overperformed during the analyzed period, reflecting the region’s growing base of young professionals, urban singles, and families who may favor convenient, affordable dining choices. And while full-service chain visits dipped slightly below 2024 levels, they represented only 12.2% of total traffic across the three dining segments for the period.
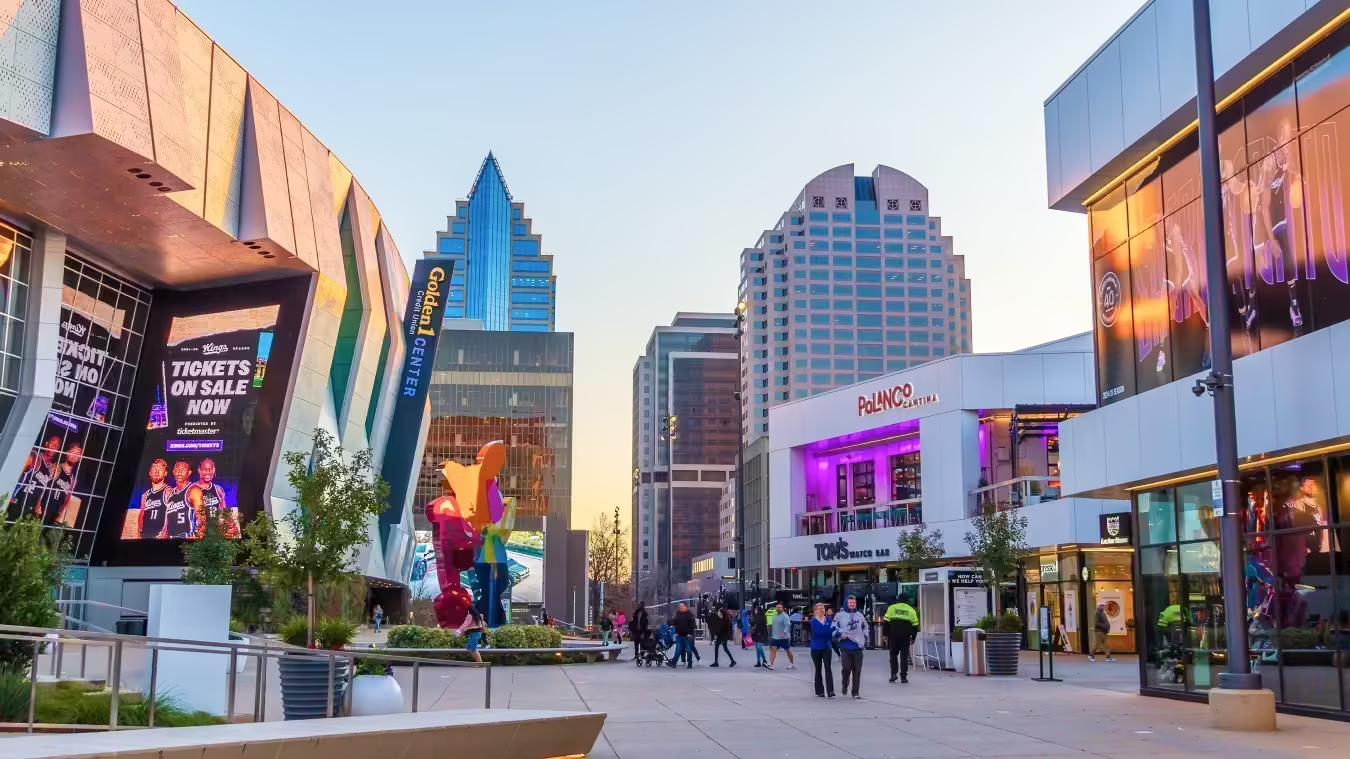
A City at the Center
Sacramento’s broader rise is also closely tied to the vitality of the city itself. The chart below shows that out-of-market visits – defined here as visits by people who neither live nor work in the city – rose 3.5% YoY over the past 6 months. This influx includes visitors from across the metro and beyond – and HHI data indicates that, on average, they tend to be more affluent than local residents.
These visitors are drawn to Sacramento’s concentration of independent restaurants, bars, retail, and cultural hubs, including its bustling Midtown neighborhood. And a growing calendar of major annual events, from Aftershock to Farm to Fork, is also helping to supercharge local tourism and cement the city’s regional appeal.
Sacramento’s Upward Arc
Bolstered by investments in major new semiconductor plants and medical centers, the Sacramento CBSA was recently ranked among LinkedIn’s 25 fastest-growing U.S. metro areas for jobs and new talent. And the region’s demographic breadth, strong retail and dining performance, and increasingly magnetic urban core position it for continued growth.
For more data-driven analyses of the trends shaping America’s cities follow Placer.ai/anchor.

Home-cooked meals may anchor the holidays, yet dining out remains a key part of the seasonal rhythm. Examining how visits trended last year helps illuminate which segments could gain the most traction this December and where holiday dining demand may concentrate.
Fine Dining Leads the Holiday Charge
While the holiday season is a major period for retail, some dining segments also experience a notable lift. Visits to the coffee category outperformed their 2024 weekly average in November, likely boosted by the appeal of leading chains' holiday menu and the popularity of Starbucks' Red Cup Day. The category saw another surge the week before Christmas, as shoppers sought out caffeine to power through last-minute errands.
Full-service restaurants tend to see visitation build towards the end of the holiday season – visits were 7.1% higher than average the week of December 16th, 2024, and remained elevated during the week of Christmas, even as other dining categories experienced slight dips. This likely reflects the shift from workday and errand-driven routines to family gatherings, out-of-town guests, and special-occasion meals. Meanwhile, categories like QSR, fast casual, and coffee tend to soften as commuting, shopping, and other everyday behaviors pause for the holiday.
Meanwhile, fast-casual and quick-service segments trended lower during holidays than they did during the rest of the year – though the week before Christmas bucked the trend, likely lifted by shoppers stopping for quick meals amid last-minute errands.
Upscale Dining Leads Full-Service Growth
Within full-service dining, upscale and fine-dining concepts were the clear standouts of the season. The segment saw steady gains throughout December, culminating in a 33.7% jump the week of December 16th and remaining elevated into Christmas week – a pattern likely supported by companies and large groups booking higher-end restaurants for end-of-year celebrations.
Breakfast-first chains, by contrast, showed softer performance for most of the period and only saw meaningful lifts during family-focused holiday weeks, when out-of-town visitors and holiday traditions drove more morning and brunch outings.
Casual dining and eatertainment concepts also experienced holiday-related bumps, but in distinct ways. Casual dining saw a brief boost the week of November 11th, likely tied to Veterans Day promotions, and then a more meaningful lift the week before Christmas as consumers grabbed convenient meals while running last-minute errands. Eatertainment venues, on the other hand, peaked during Christmas week, benefiting from families seeking activity-based outings once holiday gatherings were underway. While neither category matched the sustained strength of upscale dining, each captured demand consistent with the role they play in the holiday dining cycle.
Lead-up To The Holidays
Looking ahead to this year’s holiday season, the year-over-year dining patterns point to a dining landscape led once again by upscale and fine dining. This segment is the only one showing consistent momentum heading into November, with steady gains that suggest another strong December for premium full-service concepts.
The rest of the full-service category is entering the season on more uneven footing. Breakfast-first chains, eatertainment venues, and casual dining brands are all tracking close to or below last year’s levels, with several weeks of declines and only brief periods of improvement. While the weeks of November 10th and 17th offer early signs of stabilization for some segments, the broader picture remains mixed.
Still, holiday dining behaviors typically shift sharply as Thanksgiving, Christmas travel, and family gatherings come into focus. If past patterns hold, all four segments may see meaningful late-season lifts – but upscale dining is the category best positioned to outperform as the holidays accelerate.
Ready, Set, Dine!
Upscale and fine dining, coffee, and breakfast-first chains demonstrated clear seasonal lifts last year. As December approaches, will these patterns re-emerge, or will consumer caution lead to wider pull-backs among the dining segment?
For the most up-to-date dining data, check out Placer.ai’s free tools.
Placer.ai leverages a panel of tens of millions of devices and utilizes machine learning to make estimations for visits to locations across the US. The data is trusted by thousands of industry leaders who leverage Placer.ai for insights into foot traffic, demographic breakdowns, retail sale predictions, migration trends, site selection, and more.

