


.svg)


Overall visits to U.S. grocery stores rose 1.7% year over year (YoY) in Q1 2026, extending a streak of growth that now spans four consecutive quarters. At the category level, most of this growth was driven by expansion, as the average number of visits per location remained essentially flat YoY.
Still, a deeper look at the data reveals meaningful variation across segments and regions, shedding light on the dynamics shaping grocery traffic in 2026.
New Stores Are Doing the Heavy Lifting
Grocery visit growth has been positive in every quarter over the past year, peaking at 3.3% YoY in Q4 before moderating to 1.7% in Q1 2026. Per-location visits, however, lagged overall growth throughout the analyzed period, increasing just 0.2% YoY in Q1 2026.
The takeaway? New store openings, rather than stronger performance from existing locations, are accounting for most of the category's recent visit gains.
That said, the combination of ongoing expansion and steady performance at existing locations points to resilient underlying demand. Even as mass merchandisers, wholesale clubs, and e-commerce players compete for share, dedicated grocery stores remain a fundamentally durable format.
Regional Variation
The relatively flat nationwide per-location performance also masks some regional variation. Several statewide markets – including Montana, Colorado, Maine, Kansas, Texas, New Mexico, Rhode Island, and Indiana – saw per-location visit growth exceeding 2.0% YoY in Q1 2026.
This divergence suggests that local dynamics, ranging from population growth and suburban expansion to competitive intensity and store rollout strategies, are playing a role in shaping performance. In other words, while national trends appear stable, grocery remains a highly localized business where market-specific factors can drive outperformance.
Fresh Format Leads on Volume, Traditional Grocery on Per-Location
A closer look at different grocery segments reveals further variation.
Fresh-format grocers like Trader Joe's and Sprouts led in overall visit growth, highlighting a rapidly expanding segment that is capturing a growing share of traffic while also maintaining solid YoY visit performance at existing stores. Value grocers also saw expansion-driven gains, though per-location traffic was softer at -2.8% YoY. And though traditional grocery chains have not been on an expansion trajectory, they slightly outperformed fresh-format players on a per-location basis, with visits up 1.5% YoY. For a segment that has lagged peers for several quarters, this represents notable improvement.
Traditional Grocers Are Winning the Short-Trip Battle
What's behind traditional groceries’ emerging store-level strength?
One explanation may be traditional grocers' success in capturing the short trip – the fastest-growing type of grocery visit. Whether driven by curbside pickup or quick fill-in runs for a few missing items or an inexpensive prepared lunch, these visits are becoming increasingly common. And a look at relative category-wide visit share shows that traditional grocers are the only grocery segment over-indexing on sub-10 minute visits, capturing a greater share of short visits than of overall grocery traffic in Q1 2026.
This suggests that habit, proximity, and assortment breadth may matter more than price positioning when a shopper just needs a few items fast. Traditional grocery shoppers may also be more likely than value-oriented shoppers to use curbside pickup – a service that may come with markups or additional fees – while fresh and specialty shoppers may be more inclined to browse in-store.
Where Grocery Goes From Here
The Q1 2026 grocery landscape is defined by steady but uneven growth. New store expansion is fueling topline gains, while performance varies across regions and formats. At the same time, the rise of short, convenience-driven trips is subtly reshaping the competitive landscape – favoring retailers that can deliver speed, accessibility, and consistency over those competing primarily on price or experiential differentiation.
So is traditional grocery making a comeback? Not in the sense of reclaiming overall growth leadership. But in some of the areas that increasingly matter, traditional grocers are carving out a durable and defensible role.
Will traditional grocery retailers continue to thrive as the year wears on? Follow Placer.ai/anchor to find out.
Placer.ai leverages a panel of tens of millions of devices and utilizes machine learning to make estimations for visits to locations across the US. The data is trusted by thousands of industry leaders who leverage Placer.ai for insights into foot traffic, demographic breakdowns, retail sale predictions, migration trends, site selection, and more.
%20(3).avif)
In April 2026, Home Depot's five-day return-to-office mandate took effect for corporate employees – the latest addition to a growing list of major employers requiring more in-person presence. What does the latest data reveal about the pace of recovery on the ground?
A Recovery Pulled in Two Directions
Nationwide office visits landed 29.1% below April 2019 levels in April 2026 – a slight improvement compared to April 2025. While this marks continued progress, the pace of recovery was more measured than in March, which saw a 4.2 percentage point gain when controlling for the number of working days. (April 2025 and April 2026 had the same number of working days, offering a clean basis for comparison).
Alongside the growing wave of mandates, a survey from MyPerfectResume early this year found that just 7% of employees would quit outright over a mandatory RTO policy in 2026 – down from 51% in January 2025. The shift reflects a labor market that has continued to soften, leaving workers with less leverage to push back on policies they might have resisted just a year ago.
On the other side of the ledger, rising gas prices introduced a meaningful counterweight in April, with the national average surpassing $4.00 per gallon for the first time since 2022. For daily commuters already reassessing the cost of in-office work, a jump of more than $1.00 per gallon in a single month is a significant headwind – and likely one factor behind the slower pace of gains.
Regional Roundup
Looking across eleven major office markets, nearly all posted modest YoY visit growth, led again by West Coast hubs Los Angeles and San Francisco. Once viewed as a persistent laggard, San Francisco’s AI-powered recovery has helped it avoid the bottom spot for several months running. And as the city’s narrative continues shifting from “doom loop” to “boom loop,” it is likely to keep gaining ground in the months ahead.
Denver, on the other hand, finished last in April across both measures – down 45.3% versus April 2019 and 1.1% from a year ago. With one of the most remote-friendly labor markets in the country and downtown office vacancy still hovering around 38%, the city is increasingly leaning on alternative strategies such as office-to-residential conversions to revive its urban core. Still, prime and Class A buildings remain a bright spot, as employers look to draw workers back with higher-quality spaces and perks rather than mandates alone – and as these efforts gain traction, Denver could begin to narrow the gap.
Progress with Friction
April’s data reinforces a familiar theme: The return to office remains non-linear, marked by steady but uneven progress. Mandates continue to accumulate and employer leverage has strengthened compared to last year, helping push attendance higher. But rising gas prices are adding friction – and the gap between the nation’s strongest and weakest office markets remains wide.
For more data-driven RTO reports follow Placer.ai/anchor.
.avif)
The home improvement category has faced sustained headwinds in recent years – from elevated mortgage rates to sluggish existing-home sales and a consumer base hesitant to take on major remodeling projects. But after a prolonged stretch of year-over-year (YoY) visit declines, both Home Depot and Lowe’s have returned to growth – and the foot traffic data suggests this shift is more than just a seasonal uptick.
A Turn Long in the Making
Both home improvement leaders closed Q1 2026 with YoY visit gains – Home Depot up 1.9% and Lowe’s up 2.0% – building on the stabilization seen in Q4 2025. This improvement aligns with their latest financial results: Home Depot reported U.S. comparable sales growth of 0.3%, while Lowe’s posted a stronger 1.3%. And for both chains, the return to positive territory suggests a long-awaited recovery may finally be underway.
Continued Resilience Into April
Monthly data also suggests that while inclement weather contributed to the segment's strong performance in January, the underlying recovery is genuine. Home improvement benefits from unusual weather events, and January's strong gains for both chains – Home Depot +2.5%, Lowe's +3.9% – were partly fueled by Winter Storm Fern, which impacted communities across more than thirty states. But the momentum carried into February, and while growth moderated in March – and for Home Depot again in April – neither brand slipped into negative territory.
That resilience is an encouraging signal for the category during the critical spring home improvement season, particularly given renewed headwinds like rising gas prices and softening consumer sentiment. Lowe's stronger performance in April 2026, supported by easier comparisons, may also reflect its greater exposure to DIY customers tackling smaller repairs and at-home projects as consumers redirect spending closer to home.
The Thaw Begins
Interest rates remain elevated and the housing market sluggish – but those same forces may now be working in the category's favor, as homeowners staying put begin to tackle a growing backlog of deferred repairs and maintenance. The bigger question is whether that momentum eventually unlocks the large discretionary projects both retailers say consumers are still holding back on – especially amid continued tariff uncertainty and elevated prices at the pump.
For more data-driven retail insights, follow Placer.ai/anchor.
Placer.ai leverages a panel of tens of millions of devices and utilizes machine learning to make estimations for visits to locations across the US. The data is trusted by thousands of industry leaders who leverage Placer.ai for insights into foot traffic, demographic breakdowns, retail sale predictions, migration trends, site selection, and more.
.avif)
With roughly one in eight Americans now using GLP-1 medications for weight loss, their rapid adoption is shaping up to be one of the most consequential behavioral shifts in recent memory – with wide-ranging implications for businesses tied to how people spend their time and money.
We analyzed the data to understand how GLP-1 usage may be influencing real-world retail and dining foot traffic. How is grocery store visitation changing? What’s happening in limited-service dining? And which other categories are gaining from a heightened focus on health and wellness – further accelerating trends that began to take hold after the pandemic?
Groceries Get a Health Makeover
Research from Cornell University shows that GLP-1 users reduce household grocery spending by an average of 5.3% within six months of starting a medication, with the most significant pullbacks concentrated in calorie-dense, processed categories. At the same time, a handful of health-oriented foods – including yogurt, fresh fruit, nutrition bars, and meat snacks – are seeing increased spend.
And foot traffic data points to a parallel shift in where consumers are shopping, with a growing share of grocery visits flowing toward fresh-format stores like Trader Joe’s and Sprouts Farmers Market that emphasize high-quality perishables, curated health-oriented assortments, and an elevated in-store experience. While this pivot has been underway for several years, reflecting a broader post-pandemic focus on health and wellness, its recent acceleration coincides with the rise in GLP-1 use.
From Q1 2022 to Q1 2026, these chains steadily expanded their share of overall grocery foot traffic, with momentum accelerating beginning in Q1 2024, even as some experienced per-store softness amid a challenging consumer environment. Over the same period, the median household income within fresh-format chains’ captured markets, which had remained largely stable through early 2024, began to decline. This trend suggests a broadening customer base, as households across income brackets increasingly prioritize higher-quality food and allocate a larger share of their grocery trips to fresh formats.
Dining Traffic Realigns Around Health
The reallocation of spending also extends beyond the grocery aisle. Foot traffic data points to a meaningful reordering of food-away-from-home visits over the past three years, with healthier dining segments outperforming more indulgent ones – underscoring a broader shift toward more nutritious options that GLP-1 adoption may be helping to reinforce.
Frozen yogurt chains outpaced ice cream shops in year-over-year visit growth in both 2024 and 2025, as consumers gravitated toward lighter frozen treats. Smoothie and juice chains also captured growing demand, buoyed by expanding footprints from brands like Tropical Smoothie Cafe, Smoothie King, and Playa Bowls, while fast-casual similarly pulled ahead of QSR.
Gym Visits Are Getting More Frequent
Fitness participation has been on the rise since the pandemic, and the data suggests gym habits are becoming more consistent over time – a trend that GLP-1 users, who often incorporate structured exercise into their routines, may be helping to reinforce.
Between Q1 2023 and Q1 2026, the share of visitors to leading gyms stopping by at least three times in an average month rose from 44.8% to 46.8%, while the share visiting at least four times rose from 37.3% to 39.1%. For a growing segment of the population, going to the gym has become a regular part of the weekly routine – with implications for fitness brands and the broader ecosystem of health-oriented businesses competing for this newly routine-driven consumer.
Apparel Pulls Away From Discretionary Retail
As consumers deepen their focus on health and fitness, the body transformations associated with GLP-1 use are also reshaping apparel demand. Alongside a growing need for wardrobe replenishment, GLP-1 users are investing more in their appearance and rediscovering the experience of shopping for clothes.
And this trend aligns with recent foot traffic data. Even as discretionary spending continues to face headwinds in a challenging macroeconomic environment, clothing retailers are seeing consistent year-over-year visit growth, driven in large part by the off-price sector – with each year outpacing the broader discretionary retail category by a widening margin. Apparel is pulling away from the pack, likely driven in part by a consumer whose relationship with their body – and with shopping – has fundamentally changed.
A Behavioral Shift Worth Watching
The GLP-1 era is still in its early stages – but as programs like Amazon’s new GLP-1 management program expand access, these drugs are likely to continue reshaping shopping behavior in the months and years ahead. The data points to a consumer who is eating differently, moving more, and spending in ways that reflect a new set of priorities, further amplifying the focus on health and wellness that has emerged over the past several years.
For more data-driven retail and dining insights, visit Placer.ai/anchor.
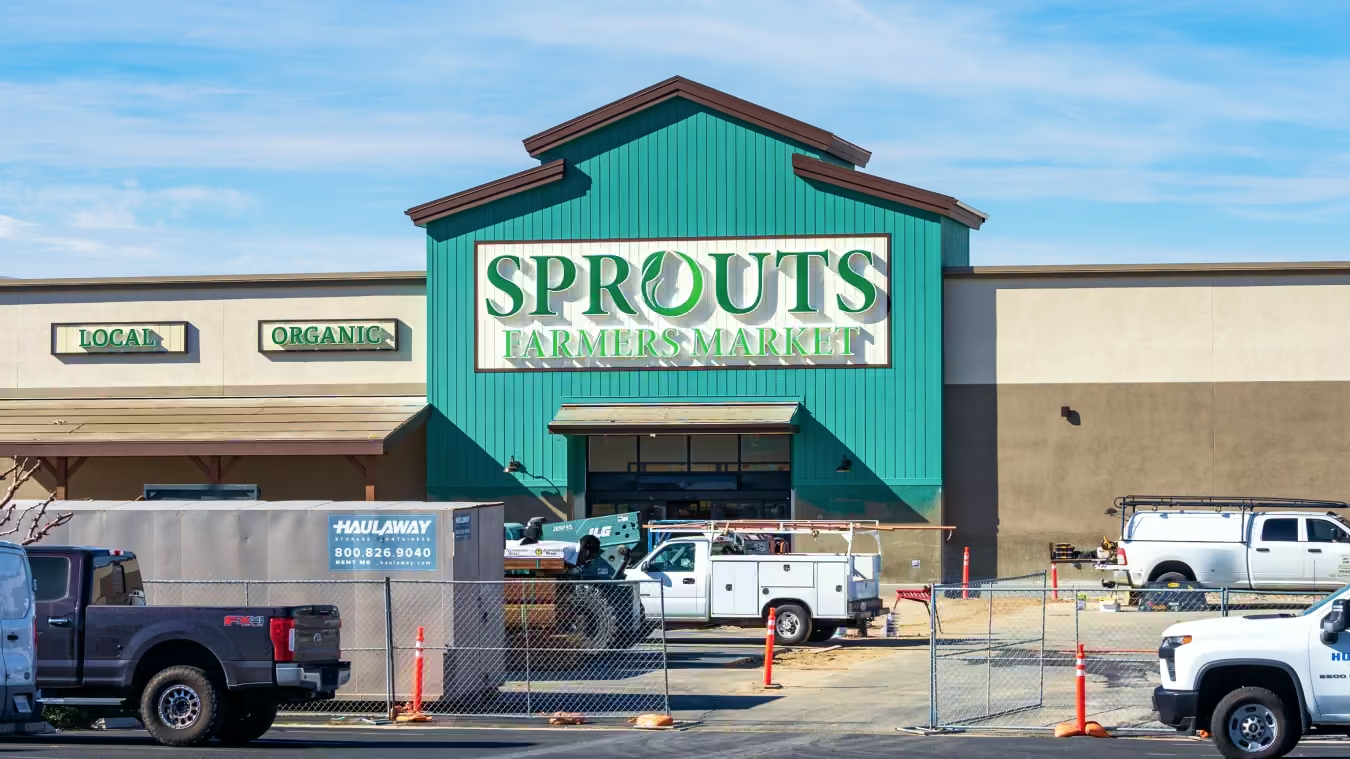
Lapping a Strong Q1 2025
Sprouts Farmers Market entered 2026 expecting a challenging quarter – and Q1 foot traffic trends bore that out. Against a Q1 2025 comparison where comps surged 11.7% year over year (YoY), the company guided Q1 2026 comparable sales to decline between -3.0% and -1.0%, citing both the tough lap and continued pressure on grocery shoppers from elevated food prices. And same-store visits also dropped, falling between -3.0% and -6.0% YoY in Q1.
Still, overall foot traffic rose 1.8%, supported by the 37 stores opened in fiscal 2025 and additional locations added in early 2026, which helped offset softness at existing stores.
The Road Ahead
Against this backdrop, Sprouts is making several forward-looking investments that could support a traffic recovery later this year. Continued expansion, a new loyalty program launched in 2025, and ongoing merchandising innovation – alongside its transition to self-distribution for fresh meat – all position the company to compete on both quality and value as macro conditions evolve.
Will Sprouts return to same-store visit growth in Q2?
Visit Placer.ai/anchor to find out.
Placer.ai leverages a panel of tens of millions of devices and utilizes machine learning to make estimations for visits to locations across the US. The data is trusted by thousands of industry leaders who leverage Placer.ai for insights into foot traffic, demographic breakdowns, retail sale predictions, migration trends, site selection, and more.
After a strong Q4 2025 that delivered record single-day sales and one of the largest digital acquisition events in McDonald's history, Q1 2026 posed a harder test. Severe weather, pressure on lower-income consumers, and rising gas prices all weighed on the QSR category. So how did McDonald’s perform in Q1? We dove into the data to find out.
Value, Marketing, and Menu
Q1 2026 visits to McDonald’s rose 0.6% year over year (YoY), with average visits per location essentially flat at 0.1%. Given Winter Storm Fern’s outsized impact on January traffic and a consumer environment that grew more selective as the quarter progressed, finishing Q1 in positive territory is a meaningful result.
That resilience reflects momentum built in Q4 2025, when McDonald’s delivered across all three of the pillars the company has identified as central to the brand's recovery: value, marketing, and menu. The September 2025 relaunch of Extra Value Meals helped reestablish McDonald’s value positioning, while MONOPOLY – returning to U.S. restaurants for the first time in nearly a decade – became one of the brand’s largest digital customer acquisition events ever. Meanwhile, the December 2025 Grinch Meal, featuring Dill Pickle McShaker Fries and collectible holiday socks, drove the highest single sales day in company history.
McDonald’s carried that strategy into Q1, bringing back the Shamrock Shake in February and launching the Big Arch Burger nationally in March. But in a quarter shaped by weather disruption and more cautious consumer spending, these initiatives generated more muted traffic responses than Q4’s record-setting activations.
A Stop Start Quarter
The chart below illustrates McDonald’s uneven performance throughout the quarter. January same-store visits fell 1.3% YoY, due in part to Winter Storm Fern, which swept across more than 30 states late in the month, disrupting operations and driving temporary restaurant closures. February rebounded to +3.8% YoY, supported by pent-up demand and the return of the Shamrock Shake, which delivered a modest but discernable lift during its launch week. March, however, slipped back to -1.2% – reflecting the Big Arch Burger's more muted traffic response and possibly also the tightening of consumer purse strings in the face of rising gas prices.
K Pop Collab Cuts Through the Noise
But despite this consumer caution, the response to McDonald's latest pop-culture collab shows that even in a more demanding environment, the right promotion can still cut through.
On March 31 – the launch date of McDonald's collaboration with Netflix's Oscar-winning animated film KPop Demon Hunters – Tuesday visits reached 11.1% above the year-to-date Tuesday average, the highest single Tuesday reading of the entire first quarter. The promotion featured two dueling adult meals inspired by the film's rival groups, HUNTR/X and the Saja Boys, along with limited-time Korean-inspired items like Ramyeon McShaker Fries. And traffic stayed elevated in the days that followed, contributing to the chain's busiest week of the year so far.
Momentum Requires More Than One Lever
Q1 data shows that McDonald’s can still drive traffic at scale, even in a softer environment. But success increasingly depends on executing consistently across value, marketing, and menu – while also delivering the kind of culturally relevant moments that give consumers a compelling reason to visit. How will the chain perform in Q2 as it rolls out its revamped McValue menu?
Follow Placer.ai/anchor to find out.
Placer.ai leverages a panel of tens of millions of devices and utilizes machine learning to make estimations for visits to locations across the US. The data is trusted by thousands of industry leaders who leverage Placer.ai for insights into foot traffic, demographic breakdowns, retail sale predictions, migration trends, site selection, and more.

