


.svg)


.avif)
In a macroeconomic environment that continues to challenge dining chains, Shake Shack’s performance offers a clear signal of what consumers prioritize in 2026 – familiarity, convenience, and affordable indulgences.
Stacked and Scaling
Over the past several years, Shake Shack has expanded its footprint while maintaining solid performance at existing locations. In Q4 2025, total revenue rose nearly 22% year over year, while same-store sales increased 2.1%, driven primarily by pricing alongside a modest (+0.5%) lift in traffic – marking the brand’s 20th consecutive quarter of positive comparable growth. Restaurant-level margins also improved, pointing to stronger execution at the unit level.
And that momentum carried into Q1 2026. Overall visits rose 19.9% YoY, with average visits per location increasing in every month except January, when severe weather – including Winter Storm Fern – likely contributed to a slight 0.4% YoY dip.

Quick-service restaurants have faced significant headwinds, even as value offerings and limited-time promotions have helped stabilize traffic across the segment. Still, the largest restaurant groups are finding ways to outperform.
The latest visit data shows Yum! Brands and Restaurant Brands International (RBI) pulling ahead of the category – with growth in both cases driven by their leading brands and supported by the strength of their fast-casual concepts.
Beating the Baseline
In Q1 2026, traffic to QSRs rose just 0.1% year over year (YoY), as increasingly cautious consumers pulled back on dining out. Against this backdrop, Yum! Brands’ 2.1% increase in overall portfolio traffic and 3.0% rise in average visits per location represent meaningful outperformance. While RBI lagged slightly in overall traffic, it still modestly outpaced the segment average in per-location traffic.
Yum! Growth Driven by Taco Bell
Diving into brand-level data, Taco Bell – which accounted for nearly three quarters of total Yum! visits in Q1 2026 – remained the company’s clear growth engine. A combination of strategic value pricing, ongoing menu innovation, and a strong digital loyalty program continued to drive same-store traffic growth and broaden the brand’s appeal across income cohorts – including higher-income consumers, families, and younger diners alike.
The Habit Burger Grill, Yum!’s fast-casual concept, also performed well in Q1, with same-store visits up in the mid- to high-single digits throughout the quarter. KFC, meanwhile, in the midst of a turnaround, saw mixed same-store visit trends – as did Pizza Hut, currently the subject of a strategic review.
Burger King Drives RBI Growth as Turnaround Gains Traction
On the RBI side, QSR leader Burger King continued to lead performance. After reporting a 2.6% same-store sales increase in Q4 2025, the chain delivered a 1.4% YoY rise in overall traffic in Q1 2026, with same-store visits increasing in both February and March. This momentum likely reflects ongoing execution of RBI’s “Reclaim the Flame” strategy, alongside ongoing menu innovation – including the January launch of the Ultimate Steakhouse Whopper, which was met with strong consumer response.
Fast-casual Firehouse Subs, which similarly posted a 2.4% increase in same-store sales in Q4 2025, also remained a bright spot in Q1, with positive same-store visit growth in January and February, and March performance roughly in line with the prior year.
By contrast, Tim Hortons continued to see traffic softness in the U.S., though ongoing expansion plans suggest confidence in its long-term opportunity. And Popeyes faced continued pressure, with RBI actively working to reposition the brand.
Outperformance in a Tough Market
Both Yum! and RBI are successfully navigating a challenging QSR environment, driven by the strength of their flagship brands, solid performance in fast-casual concepts, and ongoing investments to stabilize underperforming chains. Will the companies be able to sustain this momentum in the coming months?
Follow Placer.ai/anchor to find out.
Placer.ai leverages a panel of tens of millions of devices and utilizes machine learning to make estimations for visits to locations across the US. The data is trusted by thousands of industry leaders who leverage Placer.ai for insights into foot traffic, demographic breakdowns, retail sale predictions, migration trends, site selection, and more.
.avif)
After a weather-disrupted start to the year, March delivered a clear signal that the office recovery is once again moving forward. The latest data points to a seasonal rebound alongside tightening workplace policies translating into sustained return-to-office (RTO) gains.
A Spring Rebound
March 2026 marked the busiest March for office visits since the onset of COVID, with traffic just 26.5% below 2019 levels.
Part of this strength was calendar-driven, as the month included 22 working days compared to 21 in both 2019 and 2025. But even after adjusting for this difference, the underlying trend remained firmly positive. Average visits per working day were 29.8% below 2019 levels and 6.4% higher than March 2025, pointing to real and continuing momentum in the market.
Regional Laggards Closing the Gap
On a regional basis, substantive year-over-year (YoY) gains were seen across every major market but Washington, D.C., where adjusting for working days revealed a 3.4% YoY visit gap – possibly influenced by a mid-month severe storm event that may have kept some workers home in a region relatively unaccustomed to such disruptions.
Miami and New York remained at the top of the recovery curve, with office visits exceeding 90% of pre-COVID baselines.
But the more interesting story is unfolding on the West Coast, where some of the nation’s biggest recovery laggards are making steady progress. Los Angeles recorded the strongest YoY growth of any analyzed market, supported in part by the comparison to early 2025, when the city was still reeling from January’s wildfires. San Francisco, where an AI-driven recovery remains in full swing, also continued to build momentum, with visits up 15.4% YoY. The city is steadily climbing the post-pandemic recovery rankings – after avoiding the bottom spot since September 2025, it edged up to third from last for the second month in a row.
More Growth Ahead
As hybrid policies continue to tighten and companies like Stellantis join the growing list of employers requiring five-day-a-week attendance, workplace behavior is shifting slowly but surely toward more in-person work. And While office attendance is unlikely to return to pre-COVID norms, additional mandates set to take effect later this year at organizations ranging from Home Depot to the California state government point to continued gains in office utilization in the months ahead.
For more data-driven RTO analyses, follow Placer.ai/anchor.
Placer.ai leverages a panel of tens of millions of devices and utilizes machine learning to make estimations for visits to locations across the US. The data is trusted by thousands of industry leaders who leverage Placer.ai for insights into foot traffic, demographic breakdowns, retail sale predictions, migration trends, site selection, and more.
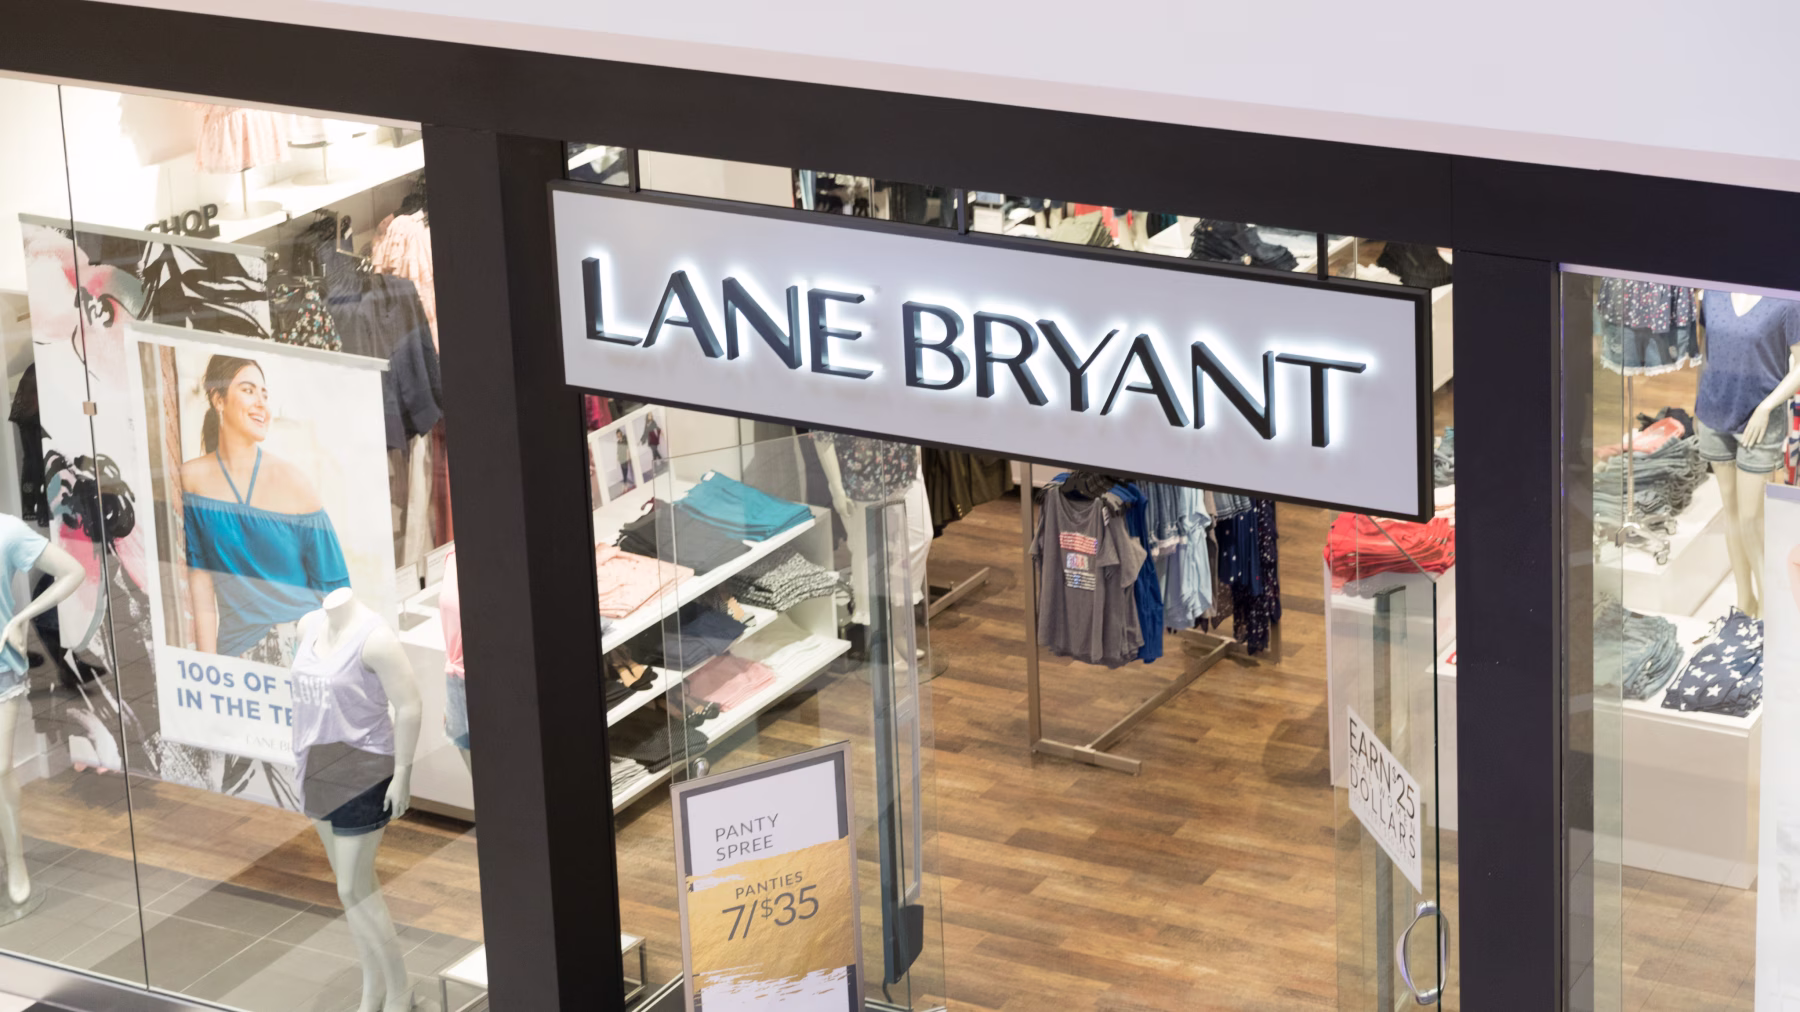
Lane Bryant faced significant challenges during the pandemic and has continued to gradually shrink its store fleet in the years since. And now, with nearly one in eight U.S. consumers using GLP-1 medications, plus-size apparel demand is beginning to shift in meaningful ways – introducing a new layer of complexity for the legacy retailer.
How is Lane Bryant navigating these challenges, and what does its customer base reveal about its ability to adapt?
Rightsized Fleet Finds Its Rhythm
In July 2020, Lane Bryant’s parent company filed for bankruptcy and closed more than 150 stores. But following its acquisition later that year by Sycamore Partners, the brand began to regain its footing – and recent location analytics suggest those stabilization efforts are taking hold.
While the reduced footprint has, unsurprisingly, led to lower overall traffic, average annual visits per location remain above 2019 levels, suggesting that demand has been successfully consolidated into existing locations. Average visits per location also held steady between 2024 and 2025, even as the company continued to quietly trim its unit count. The result is a smaller but more productive fleet, with steady activity supported by fewer, better-aligned stores.
Family Core Anchors Demand with Room to Expand
Still, as Lane Bryant continues to stabilize, the question becomes how it can further increase store-level productivity. And analyzing the demographic profile of its trade areas offers insight into both its core strengths and where the next phase of optimization may emerge.
One of the brand’s clearest advantages is Lane Bryant’s strong reach among family-oriented segments, which are overrepresented in its captured market – the areas within its trade area generating the highest share of visits – compared both to its overall trade area (its potential market) and to the national baseline. These segments, including parents of young children and households with teenagers at home, tend to skew younger than peak GLP-1 users, potentially offering the chain some near-term insulation from rapid GLP-1-driven disruption. Still, these cohorts are also seeing growing adoption – and as usage expands within this demographic, Lane Bryant will need to increasingly support customers through evolving size needs rather than rely on demand tied to a stable size identity.
At the same time, the data points to opportunities to expand reach across other segments. Among older households, Lane Bryant’s captured audience aligns with its trade area but falls below the nationwide average, highlighting potential whitespace that could be unlocked through footprint adjustments or more targeted engagement in markets where this segment is more concentrated.
Among younger “Contemporary Households,” by contrast – a segment that includes singles, non-family households, and married couples without children – the brand under-indexes relative to its trade area while slightly outperforming the national benchmark. This suggests Lane Bryant has geographic access to a larger pool of these consumers but has yet to fully capture their demand, pointing to an opportunity for growth through more targeted marketing and merchandising.
Challenges and Opportunities Ahead
GLP-1 adoption is disrupting traditional plus-size apparel demand, while also creating new opportunities as consumers undergoing weight loss journeys increase spend while moving through sizes. Retailers that can support customers across these transitions with more flexible assortments will be better positioned to capture this shift. And Lane Bryant’s steady operational footing and well-defined core audience provide it with a solid foundation to compete in this next phase of growth.
For more data-driven retail insights, visit placer.ai/anchor.
Placer.ai leverages a panel of tens of millions of devices and utilizes machine learning to make estimations for visits to locations across the US. The data is trusted by thousands of industry leaders who leverage Placer.ai for insights into foot traffic, demographic breakdowns, retail sale predictions, migration trends, site selection, and more.
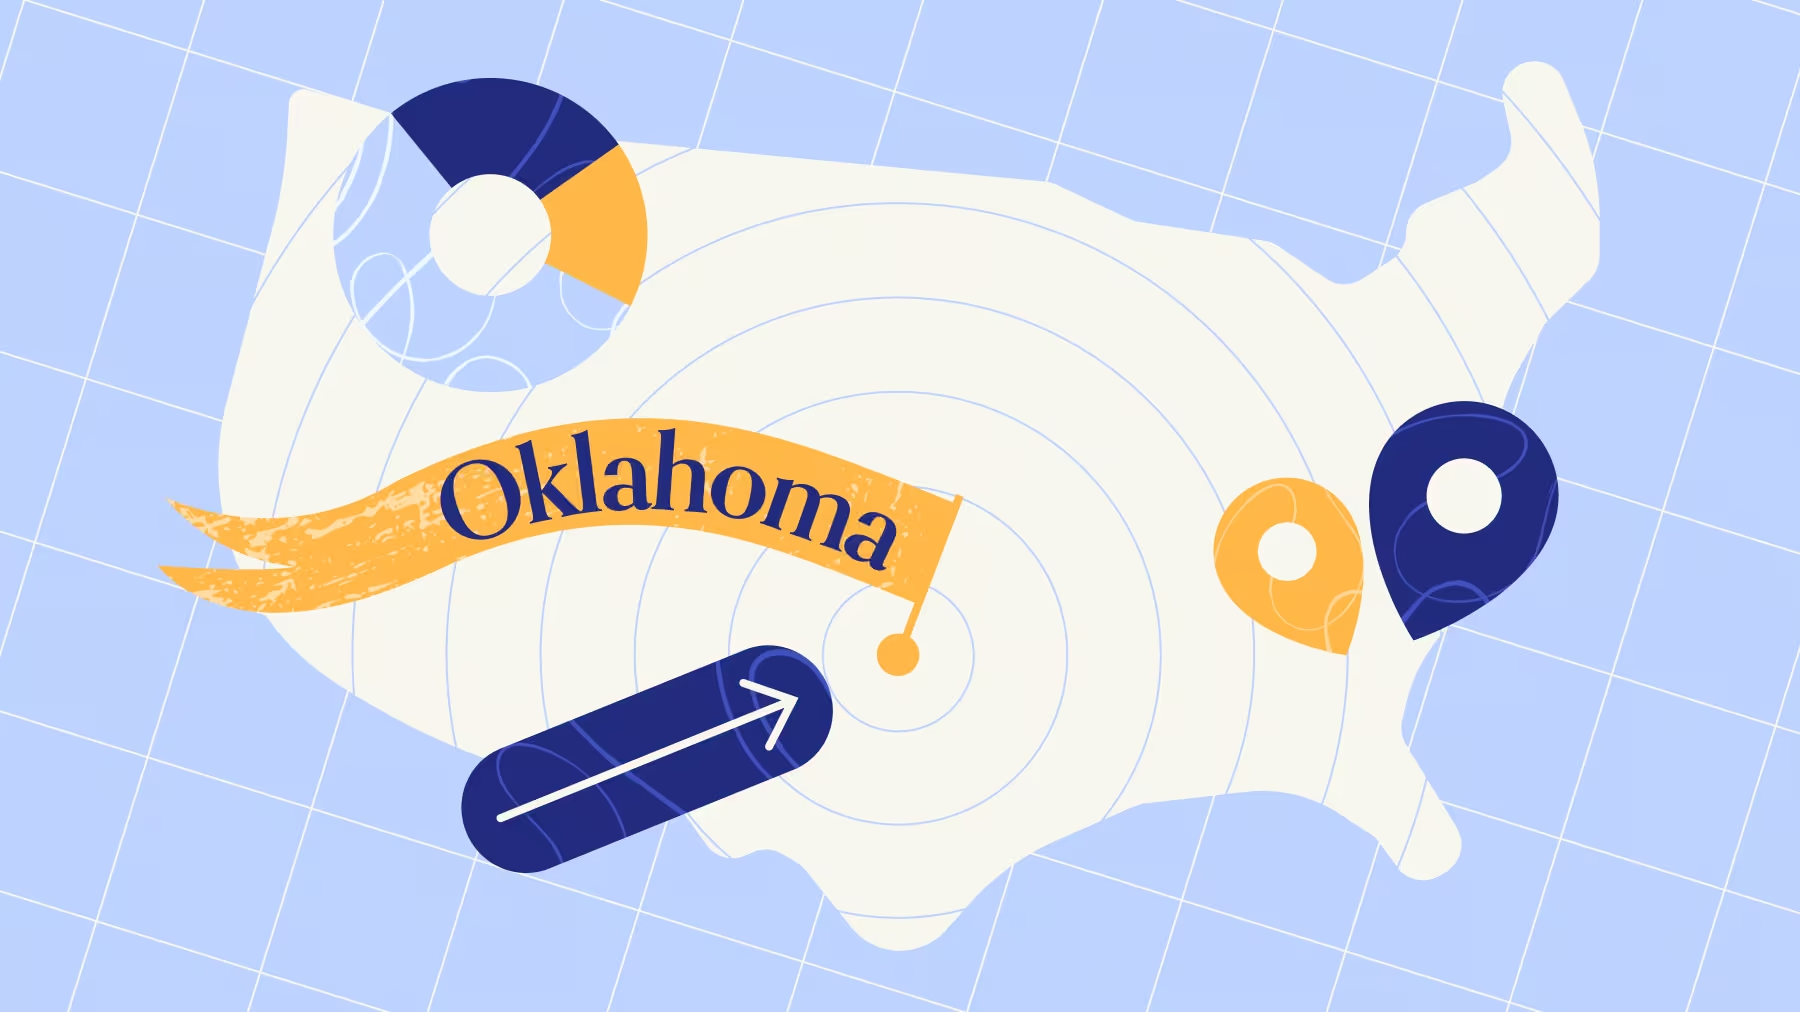
IKEA’s recent decision to open a store in Tulsa, OK may seem surprising at first glance. But a closer look at the location analytics reveals a market with a compelling mix of inbound migration, rising incomes, and retail momentum – a combination that is putting the state of Oklahoma on the map as a next-tier retail destination.
So what do location analytics reveal about the trends shaping Oklahoma’s largest markets – and why did IKEA choose Tulsa, the state’s second-largest CBSA, over its biggest, Oklahoma City? We dug into the data to find out.
Migration Momentum Puts Oklahoma on the Map
Population growth is often one of the first signals retailers look for. And while states like California, New York, and Illinois have continued to see domestic outflows in recent years, Oklahoma has been quietly gaining ground. Between January 2023 and January 2026, the state saw an influx of relocators equal to 0.3% of its 2023 population.
Both Oklahoma City and Tulsa have benefited from this trend – but Tulsa holds a slight edge, one factor that may be contributing to IKEA’s decision. The gap may seem modest, but in a mid-sized metro context, even small differences in migration can translate into meaningful increases in demand.
Income Tailwinds Strengthen the Case
Another factor likely shaping IKEA’s decision is the quality of inbound migration. Data shows that newcomers across Oklahoma bring significantly higher median household incomes (HHIs) than existing residents.
And while Oklahoma City’s overall median HHI remains slightly higher than Tulsa’s, the income lift from new residents is more pronounced in Tulsa. Incoming households there earn about 7.1% more than local residents, compared to a 4.8% premium in Oklahoma City.
This stronger income differential points to a greater influx of higher-earning households – consumers who are more likely to drive discretionary spending. As they settle into new homes, these households often trigger immediate, high-value purchasing cycles, particularly in categories like home furnishings.
Retail Traffic Clinches It
And these demographic tailwinds appear to be translating into real-world retail performance. Since 2024, year-over-year retail visits across Oklahoma have outpaced the national average.
At the metro level, both Tulsa and Oklahoma City have seen retail activity grow since 2023 – but only Tulsa has consistently outperformed the U.S. benchmark, and in 2025, it also surpassed the state as a whole.
The convergence of these factors – stronger migration, a more pronounced income uplift, and sustained retail outperformance – may help explain IKEA’s strategic choice.
Oklahoma!
IKEA stores are long-term investments, often serving as regional anchors for decades. Choosing Tulsa signals confidence not just in current demand, but in the market’s future trajectory.
And the data supports that bet. With stronger inbound migration, a greater concentration of higher-income newcomers, and above-average retail momentum, Tulsa is emerging as a quietly attractive growth market – one that may be flying under the radar, but increasingly checks all the right boxes.
For more data-driven retail analysis, follow Placer.ai/anchor.
Placer.ai leverages a panel of tens of millions of devices and utilizes machine learning to make estimations for visits to locations across the US. The data is trusted by thousands of industry leaders who leverage Placer.ai for insights into foot traffic, demographic breakdowns, retail sale predictions, migration trends, site selection, and more.
Chick-fil-A continues to carve out a distinctive growth story in the quick-service restaurant (QSR) space, pairing steady physical expansion with consistent gains in foot traffic. The latest data highlights a brand strengthening its position through operational efficiency, disciplined growth, and a loyal customer base that values quality and experience over aggressive promotions.
Growing Footprint, Growing Throughput
Supported by industry-leading average unit volumes, Chick-fil-A has successfully expanded its physical footprint without sacrificing store-level performance.
Recent traffic data from September 2025 through February 2026 illustrates this efficient scaling, as total visits rose consistently year-over-year throughout the entire six-month period while average visits per location remained elevated in four of those six months.
Standing Out in a Competitive Set
In addition, since September 2025, Chick-fil-A has largely outpaced other limited-service restaurants in per-location traffic growth, lagging behind QSR and fast-casual competitors only in October and November.
Notably, November’s sharp decline can be attributed to calendar dynamics rather than a drop in consumer interest – Chick-fil-A is famously closed on Sundays, and November 2025 had one more Sunday than November 2024, which could have placed the chain at a disadvantage relative to other restaurants.
A Customer Base That Supports Consistency
Chick-fil-A’s resilience may be rooted in part in the strong alignment between its operating model and its customer base. Positioned as a premium QSR brand straddling the line between fast food and fast casual, the chain emphasizes consistency, menu simplicity, and high-touch service rather than heavy discounting.
This approach has helped Chick-fil-A maintain a top ranking for QSR customer satisfaction for over a decade. At the same time, its trade areas skew more affluent than those of traditional QSR competitors, providing a degree of insulation from macroeconomic pressures and supporting a willingness to pay for a reliable, higher-quality dining experience.
Steady Climb, Strong Positioning
Chick-fil-A’s recent performance highlights a brand executing with discipline – expanding its footprint while maintaining strong unit-level productivity and outperforming key competitors. With a stable operating model and a customer base that supports its offerings, the chain appears well positioned to sustain its upward trajectory.
For more data-driven dining insights, follow Placer.ai/anchor.
Placer.ai leverages a panel of tens of millions of devices and utilizes machine learning to make estimations for visits to locations across the US. The data is trusted by thousands of industry leaders who leverage Placer.ai for insights into foot traffic, demographic breakdowns, retail sale predictions, migration trends, site selection, and more.

