


.svg)


Darden Restaurants, Inc. operates a portfolio that includes some of the biggest names in full-service dining, including Olive Garden, LongHorn Steakhouse, Cheddar’s Scratch Kitchen, Yard House, Ruth’s Chris Steak House, Bahama Breeze, and Eddie V’s Prime Seafood.
How are these restaurants performing as Q3 2024 approaches? We took a closer look at the location analytics to find out which restaurant chains are thriving in today’s challenging economic climate.
Getting Back to the Garden
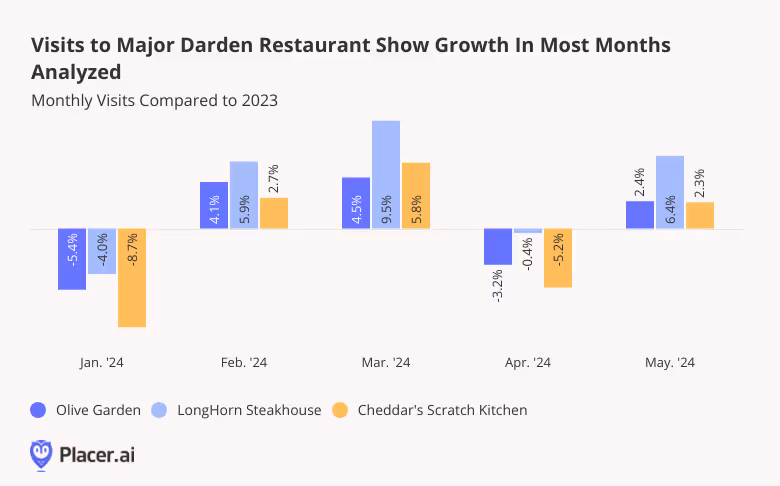
Darden’s three largest restaurant chains – Olive Garden, LongHorn Steakhouse, and Cheddar’s Scratch Kitchen – are some of the best-known names in casual, full-service dining. These chains have a strong presence across the country and have experienced mainly positive YoY foot traffic this year so far.
Although foot traffic was lower YoY in January and April 2024, these dips can be attributed to external factors, such as January’s inclement weather and an April calendar shift (i.e. the timing of Easter, as well as the extra Saturday in April 2023). And in May the three chains quickly rebounded, ending the month with respective YoY visit increases of 2.4%, 6.4%, and 2.3%.
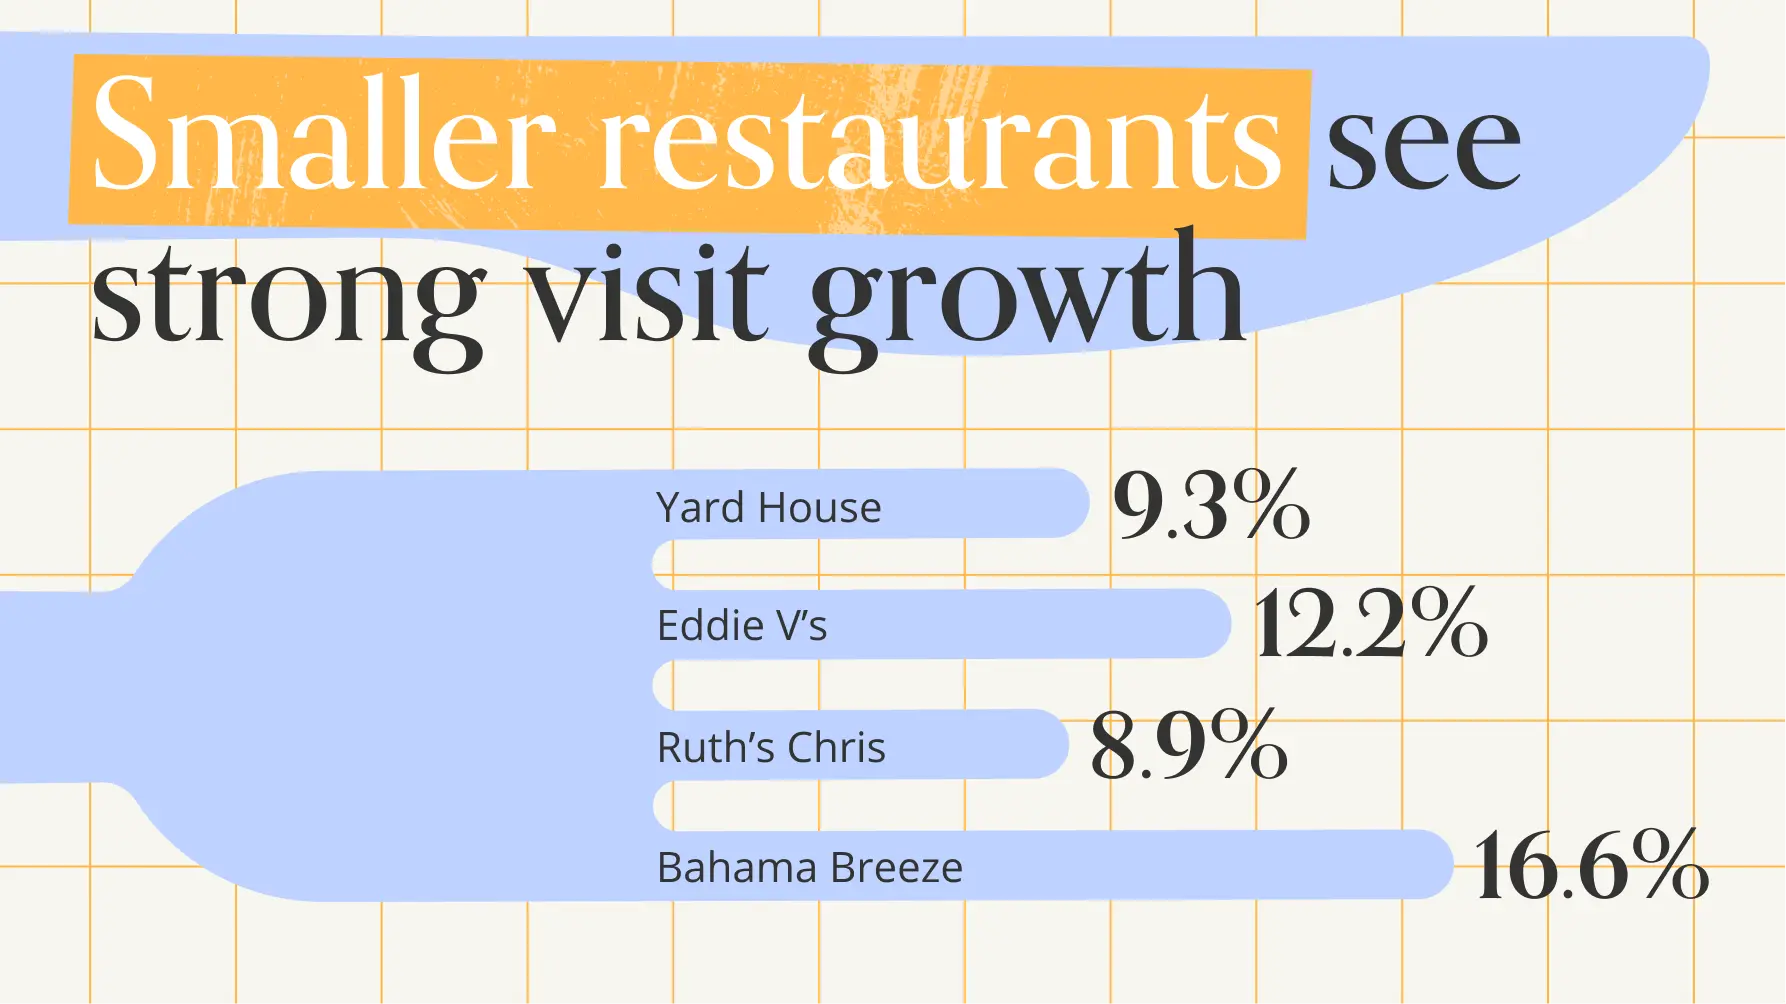
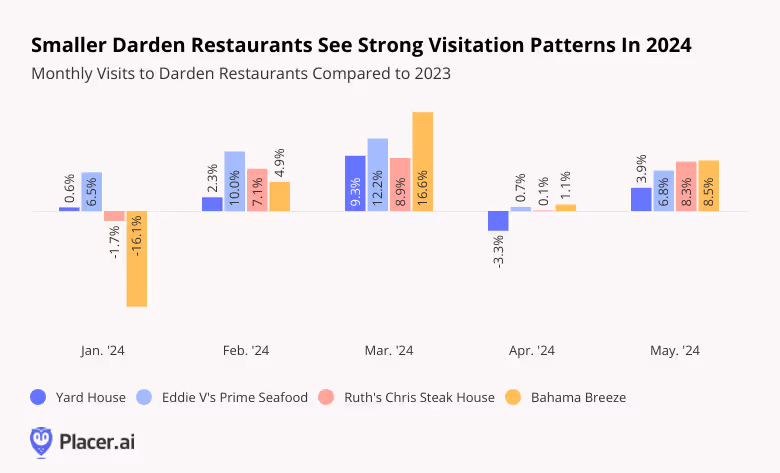
Smaller Brands Showing Visit Strength
Darden operates various smaller brands offering different dining styles and price points, ranging from upscale options like Eddie V’s and Ruth’s Chris Steakhouse to more casual spots like Bahama Breeze and Yard House. These smaller chains also experienced strong visitation patterns in early 2024 – with May YoY visits up between 3.9% and 8.5%.
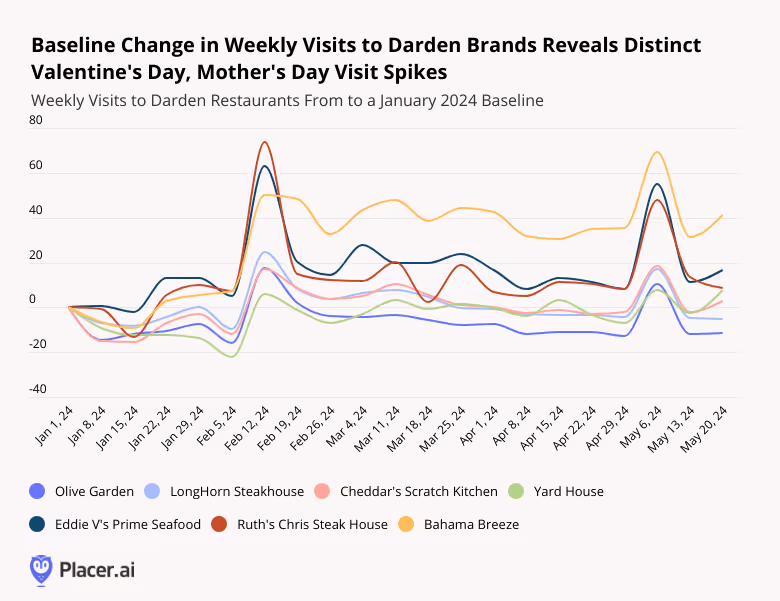
Special Calendar Days Drive Visits
Darden’s strong February and May showings were likely fueled, in part, by two distinctly important days on the Darden restaurant calendar: Valentine’s Day and Mother’s Day.
In absolute terms, Olive Garden – Darden’s largest chain by far – drew the most visits on both holidays as compared to a January 1, 2024 baseline, claiming the top spot this year as America’s favorite Mother’s Day destination. But on a relative basis, Darden’s premium brands Eddie V’s and Ruth Chris experienced the biggest visit spikes, as people splurged on celebratory outings. And laid-back chain Bahama Breeze saw a sustained visit boost from Valentine’s Day through Mother’s Day, likely owing to its strong presence in Florida – making it an attractive destination for the snowbirds and vacationers who visit the state during the winter.
And surprisingly, even casual dining venue Yard House – known for its beer and sports atmosphere rather than romantic setting – experienced a Valentine’s Day visit boost. This suggests that there is a tangible benefit from these holidays across a wide range of dining styles – and restaurant operators can use these insights to encourage visits on such occasions.
No Missed-Steaks Here
Darden continues to attract customers to its restaurants in spite of a challenging economy by offering a variety of dining choices and capitalizing on popular dining-out occasions such as Mother’s Day and Valentine’s Day.
Will the company’s visit growth continue to trend upward as 2024 wears on?
Follow Placer.ai for the latest data-driven dining insights.

Hilton Hotels & Resorts and InterContinental Hotels Group (IHG) are two of the biggest names in lodging. The two companies operate a wide range of hotel brands, ranging from luxury chains to budget options. And falling in the middle of this range are two midscale hotel chains: TRU by Hilton and avid Hotels, operated by IHG.
What can foot traffic and demographic data reveal about the preferences of visitors to these chains? We took a closer look.
Visit Growth Year Over Year
TRU by Hilton and avid Hotels both opened their first locations in 2017, with the goal of offering travelers modern and comfortable accommodations while eschewing the amenities typically associated with more luxurious hotel categories. By streamlining services, these hotels can appeal to a diverse range of travelers while maintaining a lower price point.
The two hotel chains have expanded since their openings, with TRU operating 279 locations and avid operating 70 nationwide as of May 2024. And this expansion seems to be paying off for both brands, helping drive YoY monthly visit increases. Since June 2023, visits to the two chains have been consistently elevated YoY, save for a few minor visit lags at TRU.
Hilton and IHG both hope to continue expanding their midscale hotel concepts, with projects in the pipeline for 2024 and beyond. And diving into the demographics can help the hotels identify their strengths and plan out marketing strategies more effectively.

Appealing Across The Board
Analyzing the psychographic makeup of TRU and avid’s trade areas by layering Spatial.ai’s PersonaLive dataset onto the two chains’ captured markets reveals that despite their budget offerings, both hotels appeal to economically diverse audiences.
Between June 2023 and May 2024, TRU and avid both attracted visitors from areas with higher-than-average shares of both “Ultra Wealthy Families” and “Blue Collar Suburbs.” The chains’ ability to appeal to both groups shows that their no-frills offerings are appreciated not just by the most price-conscious customers, but also by those with more room in their budgets to splurge.

Singles or Families?
Still, TRU drew a greater share of visitors over the analyzed period from areas over-indexed for “Ultra Wealthy Families'' – while avid drew slightly more customers from areas over-indexed for “Blue Collar Suburbs.” And diving deeper into the demographic and psychographic characteristics of TRU’s and avid’s captured markets shows that though both chains have broad appeal, there are some differences between their customer bases.
The median household income (HHI) of TRU’s captured market stood at $79.4K during the analyzed period – above the nationwide median – while that of avid remained slightly below it. And while avid’s captured market included a higher-than-average share of “Young Urban Singles” (also from Spatial.ai’s PersonaLive dataset), TRU was more likely to attract “Suburban Boomers.” So while TRU draws a wealthier and more settled clientele, avid tends to attract younger, less established guests.
These differences serve as a reminder of the differences that exist even within similar accommodation categories, and may help the two chains when deciding how to market to their respective customer bases.

Final Thoughts
Both TRU and avid seem similar enough on paper – two midscale hotel chains, geared towards a traveler that prioritizes value and convenience. And while both chains attract a wide range of households to their venues, TRU tends to see a more affluent, established visitor, while avid seems to attract more guests who are starting out in life.
For more data-driven travel & leisure insights, visit Placer.ai.

Discretionary retail has faced its fair share of headwinds over the past few years, from pandemic-related restrictions to inflation. And while prices have stabilized, subdued consumer confidence continues to weigh on non-essential segments. But even in this challenging environment, some companies, like Ulta Beauty, are continuing to see visit growth, while others, like Gap Inc. and its portfolio of apparel brands, are making a comeback.
With Q2 2024 well underway, we take a look at the foot traffic patterns for these companies to see how they are faring.
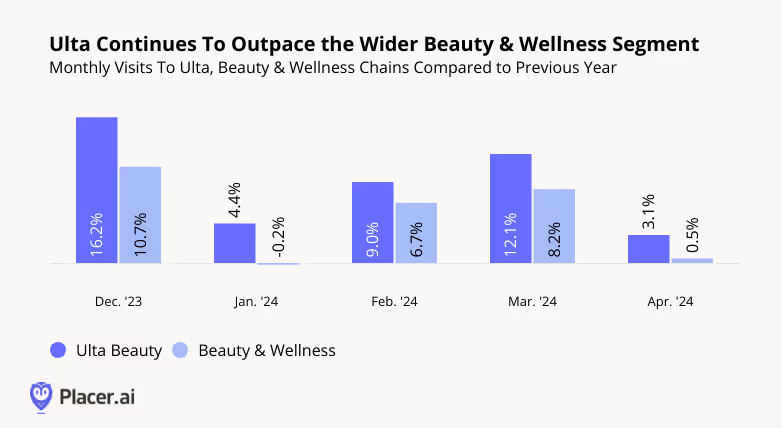
Ulta: The Beauty Powerhouse Sees YoY Visit Growth
In 2020, Placer.ai predicted that Ulta Beauty would be an unstoppable force in beauty retail – and the chain has impressed ever since. Over the past several years, Ulta has been on a consistent upward visit trajectory, propelled by strong demand for affordable luxuries (the so-called “Lipstick Effect”), and consumer interest in self-care.
And though the pace of Ulta’s tremendous YoY visit growth has moderated somewhat in recent months, the beauty giant continues to thrive – drawing even more visitors in early 2024 than during the equivalent period of last year. Between January and April 2024, YoY visits to the beauty retailer remained consistently elevated, outperforming the wider Beauty & Wellness space.
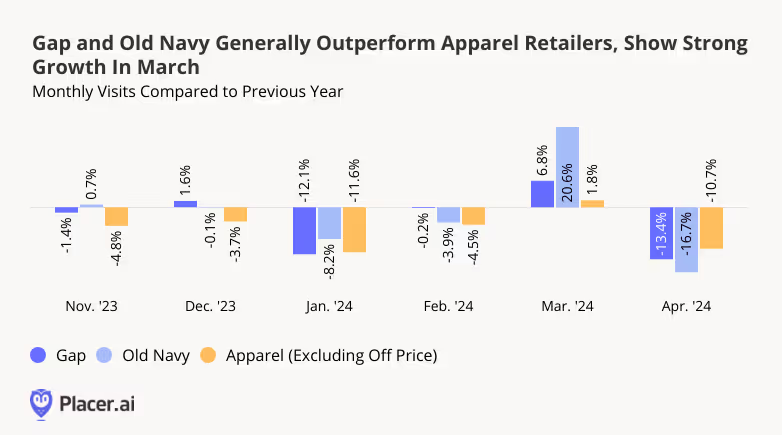
Gap Brands: A Retail Revival
The fashion segment has experienced rising prices and persistent inflation over the past few years, leading to a new era of discount and thrift shopping. And iconic apparel retailers like Gap Inc – operator of Gap, Old Navy, Athleta, and Banana Republic – have not been immune to the challenges facing the category.
But through a combination of high-profile hirings and revitalized branding efforts, Gap Inc. has been readying itself for a comeback. In Q4 2023, the retailer announced stronger-than-expected results, driven primarily by Gap and Old Navy. And recent foot traffic to the company’s largest brands provides further evidence that its turnaround efforts may be starting to bear fruit.
During the all-important November and December shopping season last year, Gap and Old Navy saw YoY visits hold steady or increase, outpacing the wider Apparel space. In January 2024, visits to the two chains declined in the wake of an Arctic blast that kept many shoppers at home. But in February, Gap enjoyed a 0.7% YoY visit bump, while Old Navy saw just a mild drop – less than that of the overall Apparel category. In March 2024, both Gap and Old Navy enjoyed strong YoY visit growth, far outperforming overall Apparel – likely driven by sales events held by each brand. And though April saw YoY visits decline once again, with the two chains falling behind Apparel, drilling down into weekly data offers a different perspective.
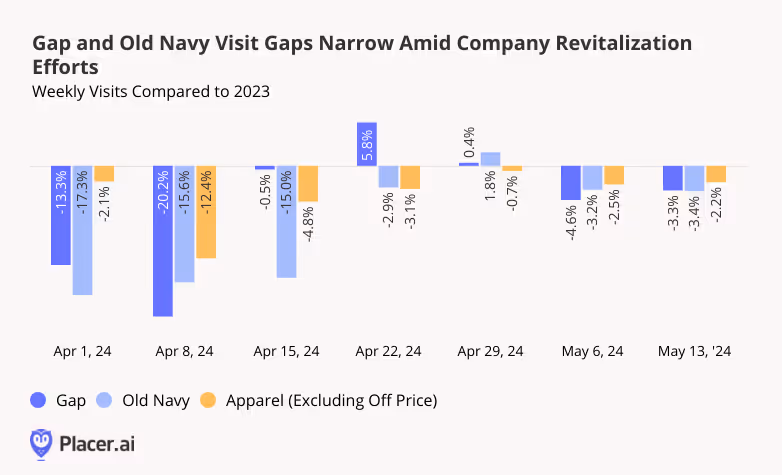
Both Gap and Old Navy started off April with lackluster YoY performance, perhaps due in part to the comparison to an early April 2023 that included Easter weekend. But towards the end of April and beginning of May, Gap and Old Navy’s’ visit gaps narrowed – with some weeks seeing positive YoY visit growth, and with the two chains once again either nearly on par with, or outperforming, overall Apparel.
Gap Inc. itself is bullish about what the next year holds in store, with big names like Zak Posen joining the Gap family in hopes of propelling the company forward. Though it may be premature to declare an end to the troubles that have plagued the clothier in recent years, early 2024 foot traffic provides further evidence that the company is heading in the right direction.
Final Thoughts
Ulta continues to experience visit growth, highlighting Beauty’s enduring appeal. Meanwhile, Gap and Old Navy are witnessing narrowed visit gaps and some weekly visit growth.
Is the Apparel segment making a comeback? Can the Beauty segment sustain its positive momentum indefinitely?
Visit Placer.ai to keep up to date with the latest retail developments.

DICK’S Sporting Goods is one of the best-known names in the sportswear and sporting goods retail segment, with more than 700 stores across the country. The company, which also operates several smaller banners including its interactive House of Sport, has thrived in recent years, buoyed by a continued interest in health and wellness.
How is the chain faring into 2024? We took a look at the latest location intelligence to find out.
DICK’S Holds Onto Gains – Outperforming Apparel and Sportswear
DICK'S was a major pandemic-era winner, sustaining visit gains through 2021 and 2022 and into early 2023. And though YoY visits slowed as 2023 wore on, DICK’s ended last year in a strong position, reporting the largest sales quarter of its history in Q4 2023.
And in early 2024, DICK’s largely held on to its gains. Like many retailers, DICK’S saw YoY foot traffic fall in January, as unusually cold and stormy weather kept many shoppers at home. But in February and March, the chain’s YoY visit gap narrowed considerably, with foot traffic hovering just under 2023 levels – no small feat for a discretionary chain in an environment marked by stubbornly elevated prices and flagging consumer confidence.
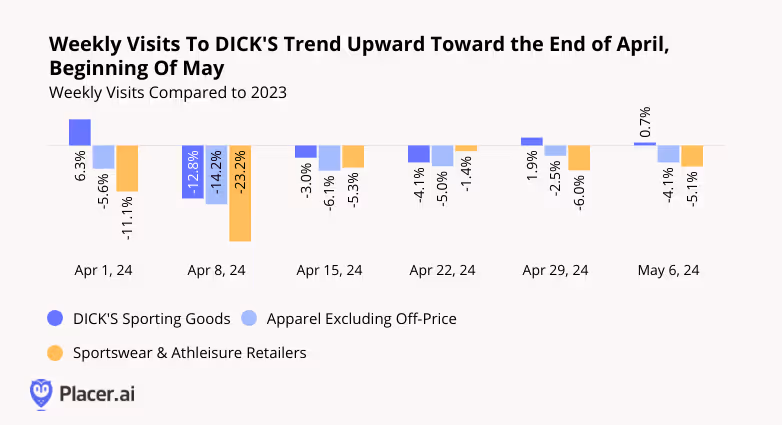
During most analyzed months, DICK’S outperformed both traditional Apparel and Sportswear & Athleisure retailers. And though the chain saw monthly YoY foot traffic drop once again in April, an analysis of weekly data shows that it entered May on an upswing.
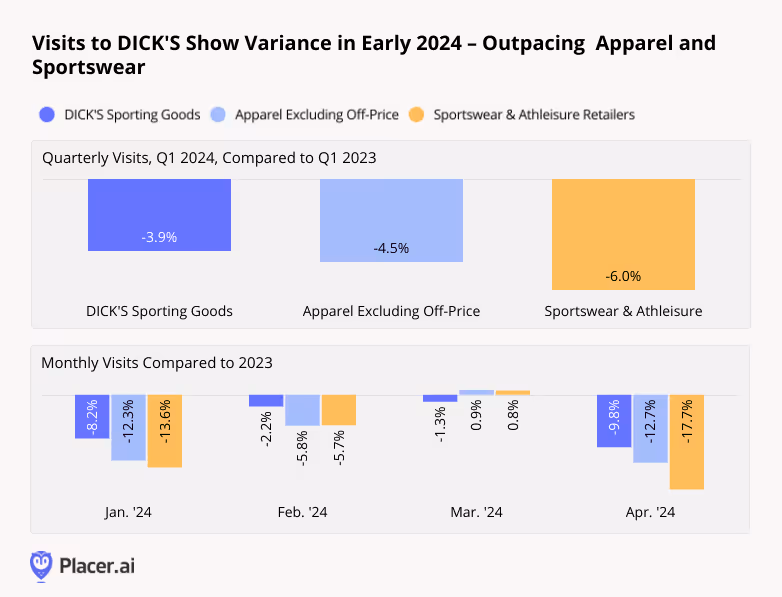
Weekly Visits Rally
Indeed, zooming into weekly visits to DICK’S shows that only during the week of April 8th, 2024 did the chain experience a large visit gap. And visits to the sportswear company began to trend upward towards the end of April and beginning of May – with YoY visits growing by 1.9% during the week of April 29th, and by 0.7% in the week of May 6th. The company also outperformed the Apparel and Sportswear segments in all but one of the analyzed weeks – Sportswear retailers had a slightly stronger showing than DICK’S did for the week of April 22.
Visitors Linger at House Of Sport
Experiential retail has emerged as a significant success story in recent years, and DICK’S has enthusiastically embraced the trend. In 2021, the company introduced its House Of Sport concept, offering visitors the opportunity to browse athletic gear or try their hand at a climbing wall or a batting cage.
The concept quickly gained traction, expanding to fourteen locations, with several more slated to open in 2024 alone. And an analysis of visitation patterns at DICK’S House Of Sport locations shows why the model is such a powerful one.
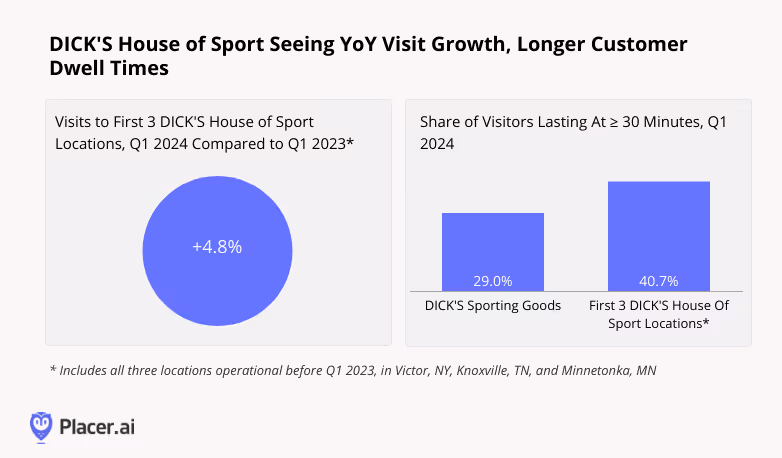
In Q1 2024, YoY visits to the three original House of Sport locations in Victor, NY, Minnetonka, MN, and Knoxville TN – the only ones operational at the start of 2023 – increased by 4.8%. So as DICK’S continues to expand its portfolio of House of Sport locations, existing ones are also drawing bigger crowds.
The original House of Sport locations also drew more extended visits in Q1 2024 than other DICK’s locations – with a remarkable 40.7% of visits lasting more than 30 minutes. With the success of House of Sport under its belt, DICK’S has begun further diversifying its fleet with a new store format that brings an interactive retail experience to the chain’s traditional store type.
Last Thoughts
DICK’S continues to outperform the wider Apparel and Sportswear retail segments, and its expanding House of Sport concept is meeting healthy and growing demand. As the company continues to lean into its experiential offerings, will the chain’s positive momentum accelerate further?
Visit placer.ai for the latest data-driven retail insights.

How did the home improvement and decor segments fare in the first months of 2024? We checked in with some of the categories’ biggest names – including Home Depot, Lowe’s, Tractor Supply Co., Harbor Freight Tools, Homesense, HomeGoods, and At Home – to see what Q1 portends for their performance the rest of the year.
Tide Turning For Major Home Improvement Chains
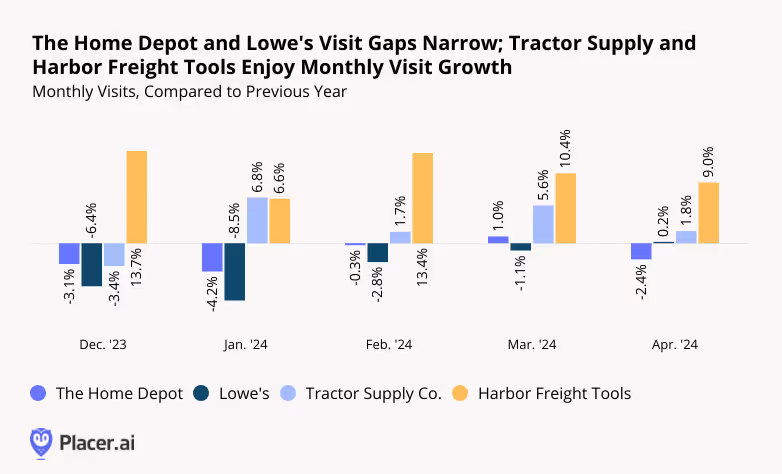
Last year was a challenging one for the home improvement space – as consumers cut back on discretionary spending and put pricey renovations on hold. But Q1 2024 visit data suggests that the category may be ready for a comeback. Throughout Q1 2024, Lowe’s saw its monthly visit gap narrow steadily – and in April 2024 saw the first YoY visit uptick the chain has experienced since 2021. And YoY visits to Home Depot were down just 0.3% in February 2024 and up 1.0% in March. Though Home Depot saw a minor visit gap emerge once again in April, the home improvement powerhouse appears to be on solid footing heading into the spring season.
While Home Depot and Lowe’s are rebounding, other home improvement chains are thriving. Discount chain Harbor Freight Tools continued to grow its footprint – and its visits – by expanding into new markets and cementing its role as a go-to destination for inexpensive home maintenance supplies. And farming essentials retailer Tractor Supply Co. also increased its store count together with its traffic. By occupying somewhat less discretionary niches, these two retailers have managed to avoid some of the headwinds plaguing the category.
More Decor
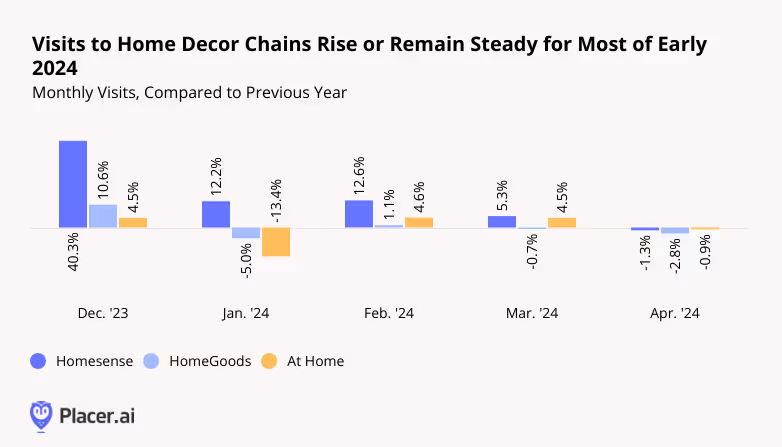
The home decor segment, including brands like Homesense, HomeGoods (both owned by parent company TJX Companies), and At Home, offers consumers a way to enhance their living spaces while avoiding the high costs associated with renovations or moving. And in Q1 2024, shoppers leaned into the category’s offerings.
Despite lapping a strong 2023, Homesense – which recently decided to close its ecommerce channel and focus on offline expansion – saw YoY visit growth throughout Q1. And though inclement weather weighed on HomeGoods’ and At Home’s January performance, YoY visits to the two brands increased or remained stable in February and March. In April 2024, all three chains held steady with slight YoY visit gaps – no small feat given the category’s largely discretionary nature.
Home Decor: An Affluent Consumer Base
Indeed, diving into the demographics of visitors to Homesense, HomeGoods, and At Home reveals that it is more affluent consumers that are driving visits to the three chains. Each chain's potential market* boasts a median household income (HHI) close to or above the nationwide median of $76.1K/year. But the median HHI of each chain’s captured market is notably higher – suggesting it is the wealthiest consumer segments in each chain’s trade area that are visiting the brands.
*A chain’s potential market refers to the population residing in a given trade area, where the Census Block Groups (CBGs) making up the trade area are weighted to reflect the number of households in each CBG. A chain’s captured market weighs each CBG according to the actual number of visits originating to the chain from that CBG.
.avif)
Final Thoughts
Home improvement and decor chains have seen their shares of ups and downs over the past few years, from pandemic highs to inflationary lows. And while some players thrived in Q1 2024, others weathered headwinds while maintaining their equilibrium. How will the space continue to fare as 2024 progresses?
Follow Placer.ai to find out.

The fitness industry has experienced steady growth in recent years, propelled by consumers’ prioritization of health and wellness – and gyms across the country are benefiting.
So with 2024 underway, we dove into the data to examine the segment’s performance during the first months of the year. Did Fitness’ strong January showing persist beyond the season of new year’s resolutions? And how did major gym chains – including Planet Fitness, Life Time, Crunch Fitness, and EōS – perform in Q1 2024 relative to last year?
Let’s Get Physical
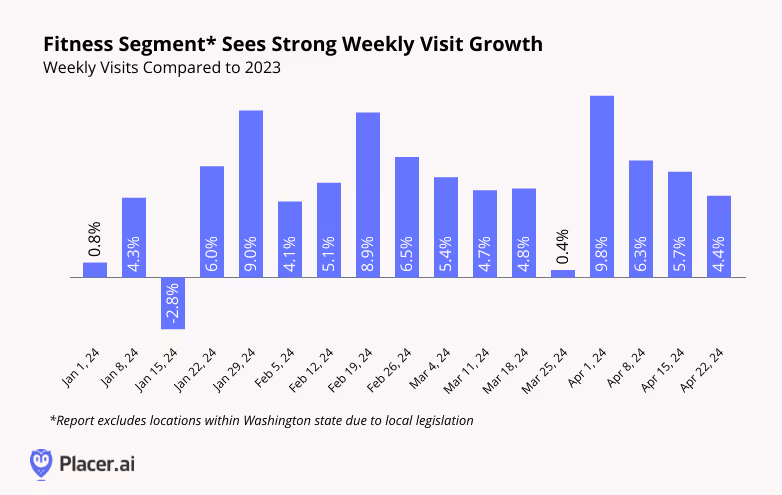
Fitness has been a consistent success story over the past few years, and the category is showing no signs of slowing down. Year-over-year (YoY) visits to the industry were up nearly every week between January and April 2024, with the sole exception of the week of January 15th, when an Arctic blast saw many people hunkering down indoors. And visits remained slightly elevated even during the week of March 25th, when Easter celebrations likely distracted many people from their gym goals – an impressive feat given the comparison to a non-holiday week in 2023.
Flexing Into 2024
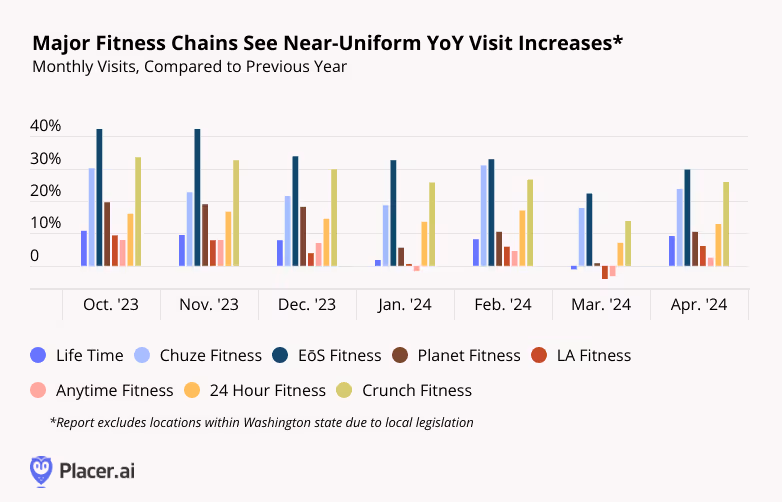
Drilling down into visit trends for eight major fitness chains shows that in today’s robust fitness environment, there’s enough demand to sustain a variety of chains: Both premium and mid-range options like Life Time and LA Fitness as well as more affordable choices like Planet Fitness and Crunch Fitness saw visits increase or remain steady for most of Q1 – and all saw YoY visit bumps in April.
Getting Pumped
Some gym-goers hit the gym several times a week and spend hours working out, while others have a more relaxed get-in-shape schedule. And analyzing leading chains’ visitation patterns shows that gyms are finding success by catering to fitness buffs’ varying preferences.
Perhaps unsurprisingly, the data reveals a strong correlation between a chain’s share of frequent visitors (i.e. those visiting the gym eight or more times in a month), and a chain’s share of visitors staying longer than 90 minutes. While some clubs, including Life Time and EōS appear to attract highly dedicated gym-goers, others, including Planet Fitness and Anytime Fitness, seem to draw more casual visitors.
The fact that both fitness chains attracting frequent visitors for longer workouts and gyms that cater to more casual exercisers who spend less time in the gym during each session are seeing positive visitation trends indicates that there are plenty of models for fitness success in 2024.

The Final Weigh-In
One thing seems clear – interest in gyms is not going away anytime soon. Visits continue to show YoY growth, and the industry is full of options for every kind of fitness enthusiast. Whether opting for occasional visits or adhering to a structured workout regimen – there’s something for everyone.
To stay ahead of the latest retail and fitness developments, visit placer.ai/blog.

