


.svg)


Warby Parker continues to impress. The company got its start as an online eyewear retailer before opening its first brick-and-mortar location in 2013, and has since expanded rapidly to operate over 200 stores nationwide.
What is driving its success? We dove into the data to find out.
Year-Over-Year Performance: Strong Growth Vision
Warby Parker debuted its innovative retail model in 2010, disrupting an eyewear industry dominated by legacy brands. The company’s direct-to-consumer model and online try-on options proved highly popular, and as the brand moved offline, its physical stores flourished.
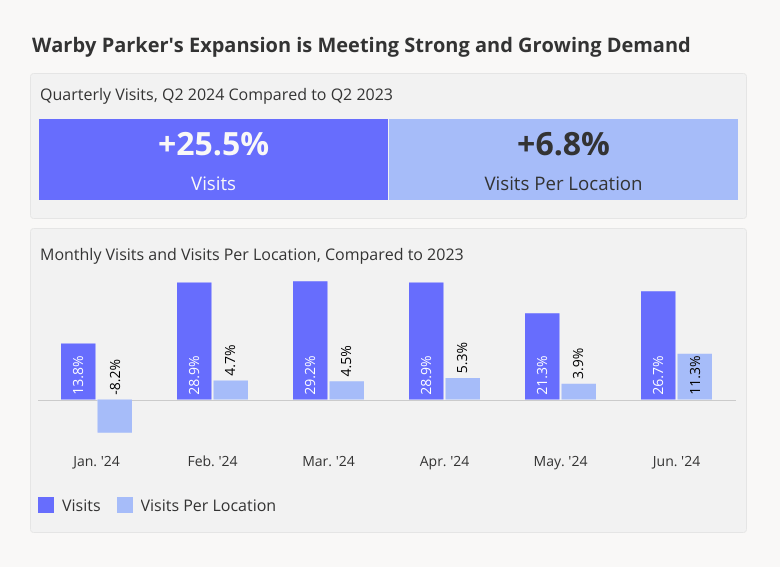
And more than decade after Warby Parker opened its first brick-and-mortar store, the chain’s offline locations continue to thrive. Between January and June 2024, YoY visits to Warby Parker increased significantly as the chain continued to expand – growing from 204 U.S. locations at the end of Q1 2023 to over 250 today. Over the same period, the average number of visits to each Warby Parker store also rose (except in January, when retail was hard hit by inclement weather) – showing that the brand’s growing footprint is meeting robust demand.
Seeing Success During Peak Seasons
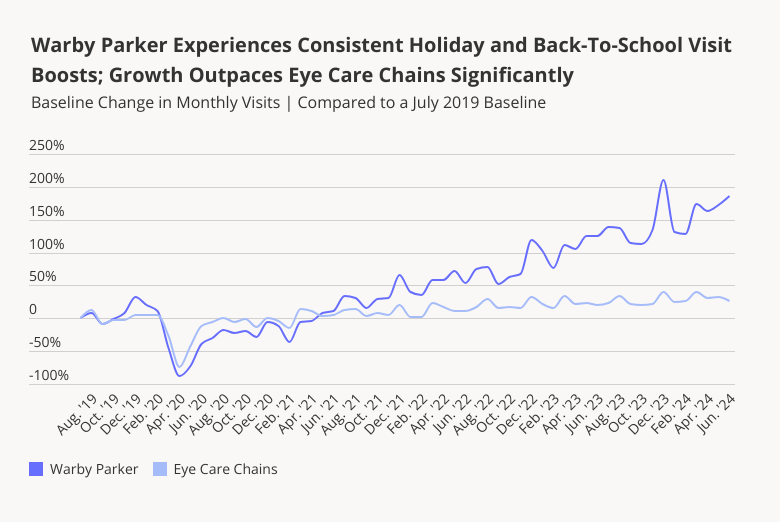
Zooming out on Warby Parker’s monthly visit trajectory – compared to a July 2019 baseline – reveals just how well-positioned the company is heading into the summer. Aside from a brief dip during the early days of the pandemic, the company’s visits have been on a remarkable upward trend, outpacing visits to eye care retailers by a wide margin.
The baseline trend analysis also shows that Warby Parker is particularly prone to seasonal visit fluctuations – with notable foot traffic boosts during the December holiday season. And like other eye care chains, Warby Parker also experiences smaller visit increases during the summer months, as back-to-school shopping gets underway. Given Warby Parker’s strong June 2024 performance, the chain appears poised to enjoy a strong July and August this year.
Attracting Collegians
Warby Parker’s robust positioning heading into the summer may be driven, in part, by its special appeal to college students. Analyzing Warby Parker’s captured market with demographics and psychographics from STI’s PopStats and Landscape datasets shows that the eyewear brand draws customers from trade areas with significantly higher shares of this coveted demographic than the wider eyewear segment: Between January and June 2024 STI: Landscape’s Collegian segment made up 4.2% of Warby Parker’s captured market, compared to just 1.2% for the wider eyewear category. As back-to-college shopping picks up steam, college students may flock to the chain to upgrade their wardrobes with trendy eyeglasses.
And though Warby Parker’s captured market features a lower share of families with children than the category average, parents – who may also get their kids fitted for new glasses before the start of the school year – make up a significant portion of the brand’s visitor base.

20/20 Vision For The Future
Warby Parker has successfully transitioned from an online retailer to a brick-and-mortar powerhouse. Will the chain continue to meet with success as it expands even further?
Visit Placer.ai to keep up with the latest data-driven retail insights.

Albertsons Companies, Inc. is one of the country’s largest grocery holding companies. The company operates various well-known grocery banners, including Albertsons, Safeway, Jewel-Osco, and Shaw's Supermarket.
We examined the visit performance of some of the brand’s major banners to see how they are faring as the second half of the year gets underway.
Key Takeaways:
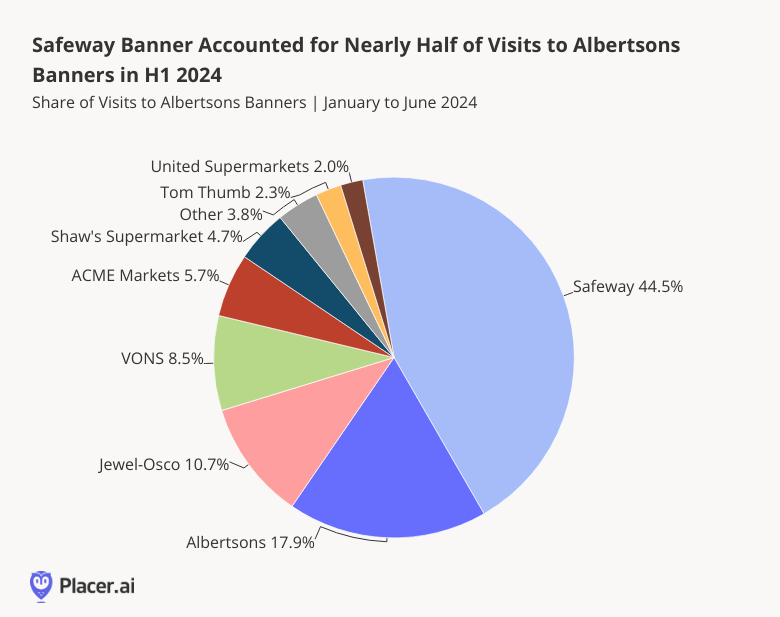
- Between January and June 2024, Safeway accounted for 44.5% of visits to the Albertsons grocery portfolio – followed by Albertsons (17.9%), Jewel-Osco (10.7%), VONS (8.5%), ACME Markets (5.7%), Shaw’s Supermarket (4.7%), Tom Thumb (2.3%), and United Supermarkets (2.0%).
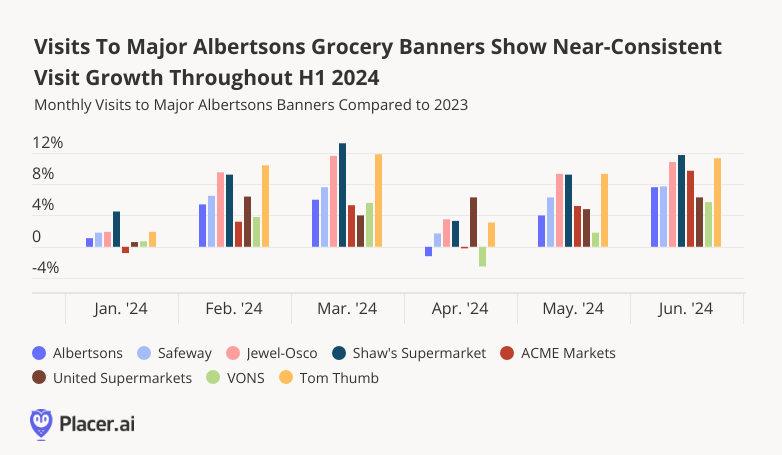
- In June 2024, visits to major Albertsons banners showed strong year-over-year (YoY) visitation patterns, including Safeway (7.7%), Jewel-Osco (10.8%), VONS (5.7%), and Tom Thumb (11.3%)
- The percentage of shoppers visiting the same Albertsons brand at least four times in a month increased between June 2022 and June 2024, against the backdrop of Albertsons’ revamped loyalty program.
Top Performers By Visit Share
Albertsons Companies, Inc. operates over 2,200 stores across 36 states, and Safeway, with 918 stores, is the company’s largest banner by far. Unsurprisingly, Safeway also pulls in the greatest share of visits, accounting for 44.5% of foot traffic to Albertsons brands between January and June 2024. Albertsons and Jewel-Osco banners, with 379 and 188 stores, respectively, accounted for 17.9% and 10.7% of all visits to the company’s portfolio in H1 2024. The remaining 27.6% of visits went to smaller brands, including VONS (8.5%), ACME Markets (5.7%), and Shaw’s Supermarket (4.7%).
Visits Growing Consistently
A look at recent visits to some of Albertsons' major banners shows that the brand has fared well in a period noted for value grocery dominance. Though Albertsons brands fall squarely into the traditional grocery store category, its banners experienced near-consistent YoY visit growth in H1 2024, with June 2024 visits between 5.7% and 11.7% higher than they were in June 2023.
Yearly Loyalty Growth
Recognizing the increased focus among grocery shoppers on value, Albertsons has been enhancing its loyalty program, initially launched in 2021 and revamped in April 2024. The new "Albertsons for U" program unified its points currency while adding new perks, including discounts on groceries and gas for enrolled members. And the program seems to be spurring shoppers to do their weekly shopping at the company’s various banners.
The percentage of visits to Albertsons banners made by customers visiting a chain at least four times in a month increased each year analyzed. For example, in June 2022, 54.8% of Safeway visits came from shoppers who visited the chain at least four times during the month; by June 2024, that number increased to 56.3%. Similarly, the share of visits to Jewel-Osco from weekly shoppers increased from 54.8% to 57.1% over the same period. These patterns repeated at Shaw's Supermarket, ACME Markets, United Supermarkets, VONS, and Tom Thumb.
The rise in loyalty rates across all banners indicates that Albertsons’ focus on enhancing customer experience and engagement has paid off. As the chain continues to lay the groundwork for its planned merger with Kroger, its increasingly loyal customer base will remain a powerful asset.

Grocery Giant Gains
Albertsons remains one of the most dominant grocery holding companies in the country, and its banners have maintained strong yearly growth, both in terms of visits and loyalty.
Will visits to Albertsons brands continue to grow into the second half of the year?
Visit Placer.ai to keep on top of the latest grocery insights.

As inflation continues to squeeze household budgets, restaurants are turning to limited-time offers (LTOs) to attract cost-conscious consumers. These promotions help create buzz among patrons and drive foot traffic.
We take a closer look at several dining chains – Buffalo Wild Wings, Starbucks, Chili’s, and McDonald’s – to see how their recent LTOs were received by diners.
Buffalo Wild Wings: Unlimited Boneless Wings
Buffalo Wild Wings is no stranger to limited-time offers – the chicken-centric restaurant gave away free chicken wings after this year’s Superbowl went into overtime, marked National Beer Day with $5 beers, and offered a whole slew of March Madness deals.
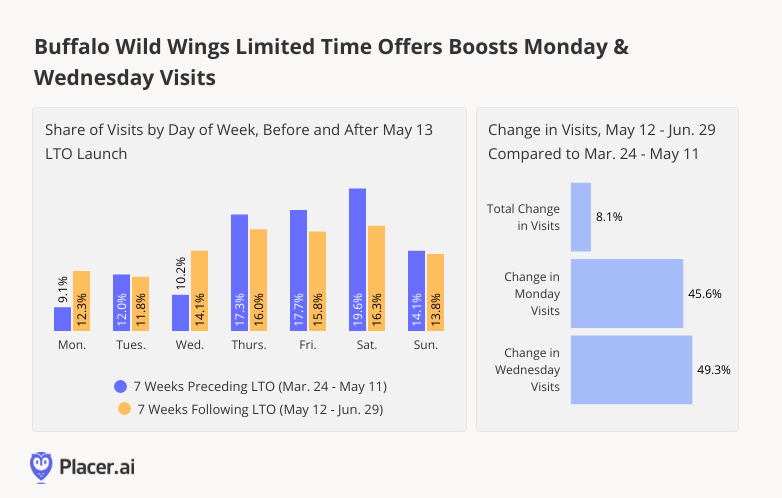
The chain’s recently introduced LTO – unlimited boneless wings every Monday and Wednesday for just $19.99 – launched on May 13th, and is slated to run through July 10th, 2024. And comparing visitation patterns during the seven-week period immediately following the launch (May 12th - June 29th, 2024) to those during the seven-week period preceding the launch (March 24th - May 11th, 2024), shows just how well-received this LTO has been.
Foot traffic to Buffalo Wild Wings rose 8.1% immediately after the launch, largely due to outsized Monday and Wednesday visit increases of 45.6% and 49.3%, respectively. And during the seven-week period following the introduction of the LTO, the chain’s share of Monday visits shot up from 9.1% to 12.3%, while its share of Wednesday visits increased from 10.2% to 14.1%.
Starbucks: Discount Fridays Boost Foot Traffic
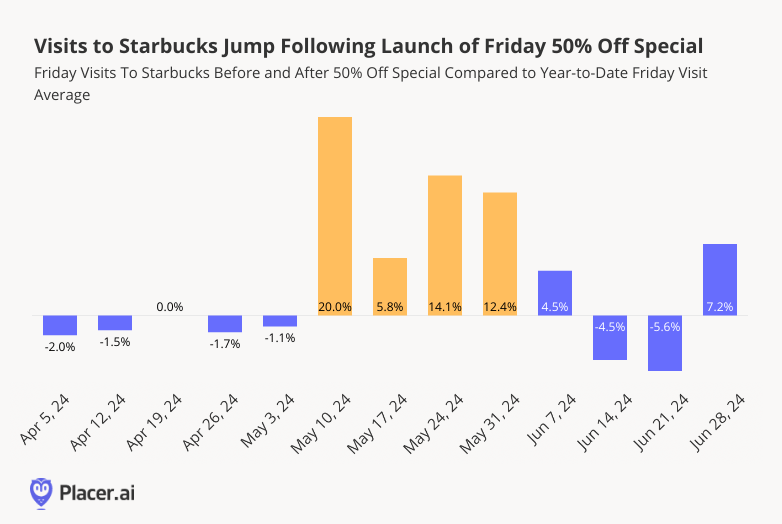
Starbucks has been leaning into value offerings – and in addition to its new “pairings” menu, the coffee giant also rolled out a limited-time 50% Friday discount exclusively for app users, which began on May 10th, 2024 and lasted through the month. Analyzing Starbucks’ visitation patterns shows that the promotion led to a significant increase in Friday foot traffic at Starbucks locations nationwide.
Compared to the year-to-date average, visits to Starbucks on Fridays following the launch experienced a noticeable increase in visits. Where the visits to Starbucks on Friday May 3rd, before the promotion launched, were 1.1% lower than the year-to-date (YtD) Friday visit average, visits on May 10th – when the promotion launched – jumped by 20.0% above the YTD visit average.
This special, which excluded hot brewed coffee and tea, seems to have met people’s desires for a refreshing afternoon or pre-weekend pick-me-up.
Chili’s Chicken Sandwich Captivates Customers
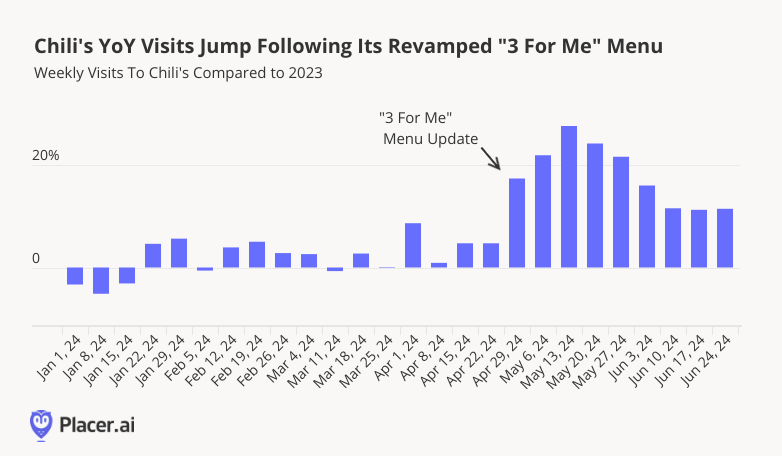
On April 29th, 2024, Chili's Grill & Bar revamped its "3 for Me" menu, which offers customers a customizable three-course meal at a value price – and weekly YoY visits to Chili’s have been strongly elevated ever since. Even before the updated menu roll out, YoY foot traffic to Chili’s was largely positive, reaching 8.6% in the week of April 1st, 2024. But since the kickoff, YoY visits have remained consistently higher – and have yet to taper off.
In addition to Chili’s new Big Smasher Burger, another menu item that seems to be driving excitement is its chicken sandwich – an offering that tends to increase foot traffic wherever it shows up.
McDonald’s Meal Deals Bring In The Visits
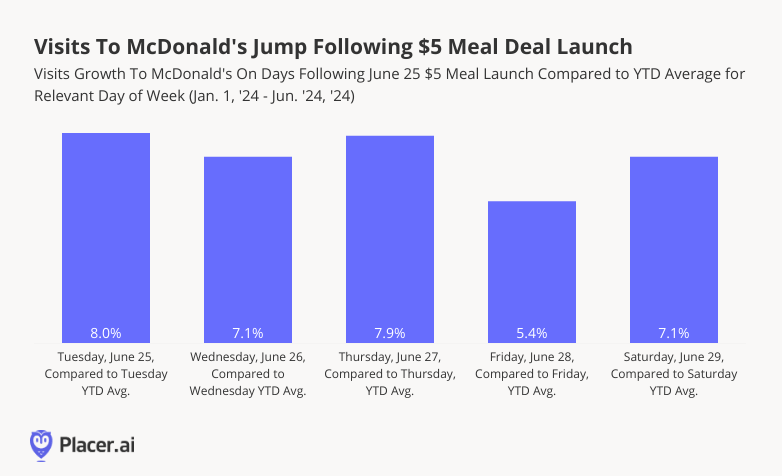
McDonald’s has also been a leader at boosting visits by offering limited edition sauces, drinks, and deals. And the chain’s most recent LTO leans hard on consumers’ recent affinity for value. On June 25th, 2024, the chain announced a $5 Meal Deal, which includes a McDouble or McChicken, 4-piece Chicken McNuggets, small fries, and a small soft drink.
These deeply discounted prices are likely to be particularly appealing to customers against the backdrop of McDonald’s rising menu prices, which have been significantly impacted by inflation. Indeed, foot traffic to the chain jumped following the $5 special launch, with visits to McDonald’s exceeding year-to-date daily visit averages.
The Tuesday of the launch – June 25th – was McDonald’s busiest Tuesday of the year thus far (outpaced since by July 2nd), drawing 8.0% more visits than the year-to-date Tuesday average. And similar patterns repeated across all days following the launch, signifying how well-received this special has been among McDonald’s fans.
Limited Time Deals & Steals
The foot traffic boosts provided by these limited-time-offers prove that, in times of inflationary pressure, a good deal can continue to bring visitors into a fast-food spot.
How will the dining value wars continue to play out in the months ahead?
Visit Placer.ai to find out.

Barnes & Noble has undergone a transformation in recent years – with new leadership and a strategic shift towards smaller, more localized book stores.
But how have these changes impacted the chain’s performance? We dove into the data to find out.
Title Page: A Solid Visit Performance
Since November 2023, Barnes & Noble has experienced consistent YoY visit growth. Only in January did foot traffic dip into the red – likely a result of the unusual cold snap that weighed on retailers nationwide.
Like many booksellers, Barnes & Noble does a significant share of its yearly business during the holiday shopping season, when people flock to bookstores to buy gifts for loved ones. So the chain’s impressive YoY performance in November and December 2023 offers an especially promising sign of its positioning going forward.

Foreword: Turning A New Page In Denver and Chicago
Barnes & Noble boasts more than 600 stores across the country, and after several years during which it shuttered locations, the chain has begun to expand once again. The company recently acquired Tattered Cover – a Denver-based independent bookseller, which Barnes & Noble will continue to operate under its existing name. And the Chicago area is getting five new Barnes & Noble locations this year.
Examining the visitation patterns and characteristics of Barnes & Noble’s existing visitor base in these CBSAs highlights the bookseller’s growth potential in these regions. In both CBSAs, the chain experienced positive YoY foot traffic growth in early 2024. Barnes & Noble locations in both CBSAs also drew customers from areas with higher median household incomes (HHIs) and greater shares of families with children than the chain’s nationwide baseline – two groups that may be particularly likely to frequent bookstores.

Chapter One: Nationwide Presence, Local Flavor
One key factor that has powered Barnes & Noble’s growth trajectory is its emphasis on curating local, independent bookstore feel in its stores. This approach allows individual store managers autonomy in decision-making, and emphasizes stocking local authors and hosting community events.
And diving into the psychographic characteristics of Barnes & Noble’s visitor base in these two expansion markets reveals that, while visitors share some similarities across different geographical regions, they also have unique characteristics.
For example, the Experian: Mosaic dataset identified higher shares of “Singles and Starters” and “Promising Families” in the trade areas that feed visitors to Denver-Aurora-Lakewood Barnes & Noble locations. Meanwhile, stores in the Chicago-Naperville-Elgin tended to attract visitors coming from trade areas with higher shares of “Power Elite” residents.
Local stores can harness these insights to effectively curate a retail experience that resonates with their customer bases: Denver-area Barnes & Noble locations can actively court young families with children or singles who are starting out in their careers. On the flip side, Chicago-area stores can curate offerings to resonate with their more affluent customer base.

Epilogue: Bookstores Are Still Thriving
Barnes & Noble is demonstrating how to maintain relevance in a world dominated by Amazon. By creating an experience that satisfies book lovers' craving for an independent bookstore atmosphere, the company is thriving.
Will Barnes & Noble sustain strong visitor numbers while maintaining its local charm?
Visit Placer.ai to keep up with the latest data-driven retail insights.

Thrifting is on the rise. Whether fueled by a desire to shop more sustainably, find unique pieces, or save money, consumers have been increasingly turning to secondhand clothing stores for their new threads. And interest in thrift shopping is only expected to grow over the next few years – with some estimates putting the U.S. secondhand market at $73 billion by 2028.
With 2024 nearly at the midway point, we dove into the data to take a closer look at the segment.
Key Takeaways:
- Thrift stores showed consistent monthly year-over-year (YoY) visit growth between January and May 2024 – and are drawing significantly more visits than before COVID.
- Diving into individual secondhand chains reveals strength across brands: Goodwill, Crossroads Trading Co., and Savers all enjoyed consistent YoY visit growth in early 2024.
- Thrift stores in 2024 also serve an economically diverse customer base – Goodwill draws visitors from areas with median household incomes (HHIs) below the nationwide median, while Crossroads Trading Co. attracts more affluent consumers and Savers attracts average-income shoppers.
- Still, thrift shoppers place a high premium on bargains. Between January and May 2024, visitors to Crossroads Trading Co. and Savers were more likely to visit Goodwill than any other clothing chain, and all thrift store shoppers displayed a strong affinity for off-price retailers.
Thrift Is A Winner
The past few years have seen a growing interest among consumers in all things value, and thrift shops have been reaping the benefits. Between January and May 2024, the segment experienced strong monthly year-over-year (YoY) foot traffic growth. And compared to pre-COVID, too, thrift stores drew 29.6% more foot traffic in Q1 2024 than in Q1 2019.
Secondhand Stars
Diving into the visit performance of individual thrift store chains reveals strength across a variety of brands. YoY visits to Goodwill, Crossroads Trading Co., and Savers were consistently elevated between January and May 2024.
Thrifty Business
Who are the shoppers driving thrift shop visit growth? Analyzing the demographics of thrift store visitors’ trade areas reveals that in 2024, thrift stores serve an economically diverse customer base. Data from the STI: PopStats dataset combined with Placer.ai captured market data shows that Goodwill draws customers from areas with a median household income (HHI) below the nationwide median $76.1K. Savers, for its part, draws shoppers from average-income areas, while Crossroad Trading Co. attracts a high-HHI customer base – likely due to the chain’s strong presence in affluent California and focus on high-end items.
Favoring Other Thrift, Off-Price Chains
Still, a look at the wider apparel shopping habits of thrift store visitors shows that these shoppers tend to be bargain hunters: Between January and May 2024, visitors to Crossroads Trading Co. and Savers were more likely to visit Goodwill than any other clothing chain. But they – together with Goodwill visitors – also did plenty of shopping at off-price chains like Ross Dress For Less, Marshall’s, and T.J. Maxx. (Crossroad Trading Co., which places a strong emphasis on selling on-trend, high-end items, also saw many of its customers shopping at Macy’s, while Savers visitors were more likely to frequent Kohl’s).
This consistent interest in budget-friendly venues underscores the strong preference for value among the growing ranks of thrift store shoppers
Thrift Store Gold Rush
Thrifting is proving its staying power, with visits to major thrift stores outpacing those of other apparel categories. Will the secondhand market continue on its upward trajectory?
Follow Placer.ai to keep up with the latest data-driven retail trends.

Limited-assortment value grocery stores like Aldi and Grocery Outlet Bargain Market have thrived in recent years, as inflation-wary consumers sought out ways to save money at the till.
But how are these chains faring in 2024? Have cooling inflation and increased consumer confidence put a dent in their performance? We dove into the data to find out.
Limited-Assortment Value Grocers Outperform
As the name suggests, limited-assortment grocery stores are known for carrying fewer products than traditional grocery stores in a bid to cut down on overhead costs and pass savings on to consumers. These chains also utilize other methods, such as private label brands, opportunistic merchandising, and fewer in-store amenities, to keep prices low.
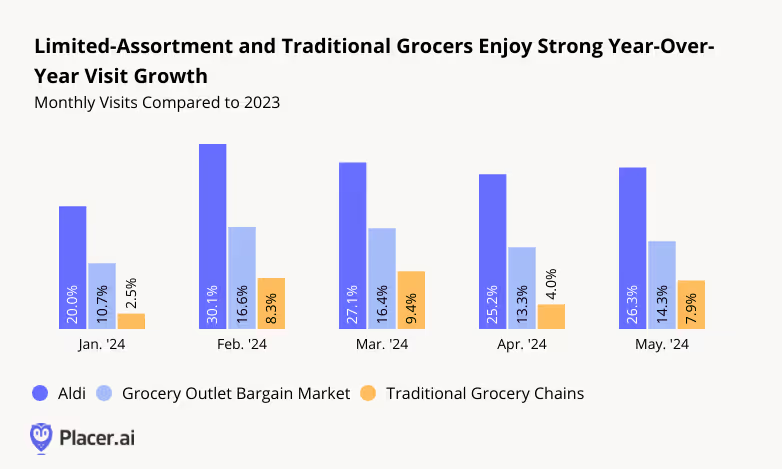
And foot traffic data shows that in the first part of 2024, consumers continued flocking to these brands to grab groceries at a discount – driving year-over-year (YoY) foot traffic growth that far outperformed that of traditional grocery stores. In May 2024, for example, visits to the overall grocery segment grew by 7.9% YoY, while Aldi and Grocery Outlet Bargain Market experienced YoY growth of 26.3%, 14.3%, and respectively.
Visits Per Location Increases
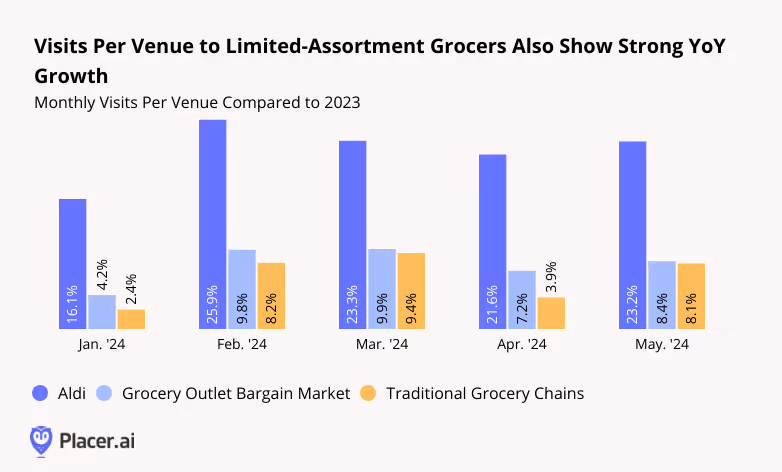
Some of this foot traffic growth can be attributed to the two chains’ continued expansion: Aldi added dozens of new stores in 2023 – with hundreds more in the pipeline – and Grocery Outlet Bargain Market also significantly grew its footprint. But the average number of visits to both brands’ individual locations also increased, again outpacing traditional grocery, showing that their expansion is meeting robust demand.
No Limitation On Loyalty
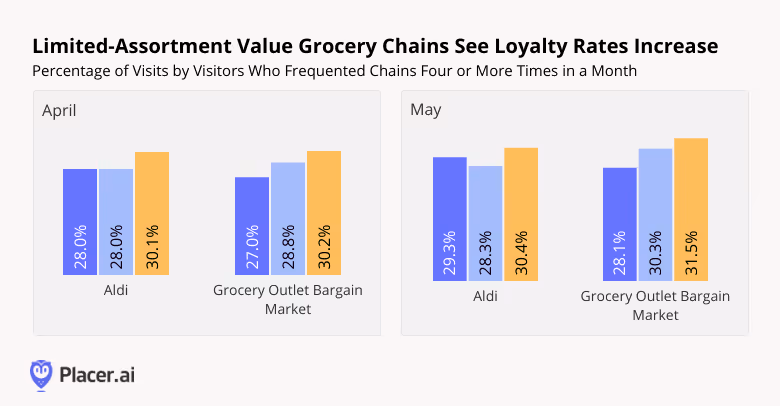
Looking into the loyalty rates of visitors to these limited-assortment value chains provides more reason for optimism for the sector: Over the past three years, Aldi and Grocery Outlet Bargain Market both saw an increase in loyal visits – defined as those made by people who frequented the chains at least four times in a month.
In April 2022, for example, 28.0% of visits to Aldi and 27.0% of visits to Grocery Outlet Bargain Market were made by people who visited the chains at least four times during the month – but by 2024, these shares grew to 30.1% and 30.2%, respectively. A similar trend was observed in May 2024.
Increasingly, it seems, people are doing at least part of their routine weekly grocery shopping at these limited-assortment chains. And with consumers continuing to seek ways to save money, these grocers are well-positioned to continue growing their visit shares.
Grocery Gains
The limited-assortment, value grocery model continues to prove its staying power, with impressive foot traffic, visits per location, and loyalty rates.
Will the segment continue on its upward trajectory?
Visit Placer.ai to find out.

