Expanding Engagement Beyond the Stadium
It’s been decades since the U.S. last hosted the World Cup, and anticipation continues to build. While the matches themselves will deliver thrilling moments for fans inside the stadium, a far broader audience is expected to engage from beyond the gates – gathering at bars, watch parties, and living rooms across the country.
Drawing on insights from recent sporting and cultural events, this analysis examines how the World Cup may impact consumer behavior and audiences across stadiums, host cities, and nationwide.
1. World Cup Audiences Will Be Unique – Even Among Major Events
There is No Typical Concert and Sports Audience
In 2025, MetLife Stadium in East Rutherford, NJ hosted a wide range of concerts and sporting events. And an examination of three – Kendrick Lamar & SZA’s tour stop, the FIFA Club World Cup Final, and a Week 17 New York Jets matchup against division rivals and the Super Bowl-bound New England Patriots – reveals clear differences in audience composition across event types.
Trade area analysis showed that the 2025 FIFA Club World Cup Final drew the largest share of single visitors and the highest median household income (HHI) of the three events – a pattern that could reflect the premium tickets and travel typically associated with a quadrennial championship match.
With the 2026 World Cup elevating the level of global competition, stadiums set to host matches this summer – including MetLife – may see even more dramatic shifts in their audience relative to other events.
Later-stage matches will draw more affluent audiences.
While spectators attending World Cup matches are likely to differ from those drawn to other events throughout the year, audience shifts are likely to occur also within the tournament itself. As the competition progresses and the stakes rise, the visitor profile at host stadiums may trend progressively higher-income, as suggested by an analysis of Levi’s Stadium in Santa Clara, CA during the recent NFL season and Super Bowl.
During the Super Bowl, the stadium’s captured market median HHI surpassed that of every 49ers home game during the 2025-26 season – a pattern consistent with the event’s premium ticket pricing, national draw, and high levels of out-of-market travel.
And since the World Cup only takes place every four years, and necessitates international travel for die-hard fans, attendees are likely to be even more affluent than Super Bowl go-ers. Moreover, as the tournament reaches its later stages, each match becomes more significant and carries the potential to drive an even more affluent in-person audience.
2. World Cup Will Generate Significant Opportunities for Nearby Dining and Entertainment
Tailgaters Expand the Opportunity Beyond Ticketed Guests
Diving deeper into last year’s FIFA Club World Cup Final and Semifinal matches at MetLife Stadium provides further insight into the significance of the in-person audience that doesn’t make it into the stands. While FIFA generally places restrictions on tailgating, the behavior was still observed at MetLife and several other tournament venues in 2025. To put the phenomenon into perspective, location intelligence indicates that on the day of the Club World Cup final, combined visits to MetLife and its parking lots were 24.8% higher than visits to the stadium alone.
AI-powered trade area analysis further contextualizes the economic significance of this audience. During the semifinal matches, MetLife Stadium’s captured market median HHI remained nearly identical – just over $100K – with and without parking lot visitors. A similar pattern held for the Final, where median HHI for both the stadium-only and combined stadium-plus-parking visitors both rose above $115K, with the stadium-only figure only marginally higher.
This suggests that tailgaters represent a significant cohort with discretionary income to spend on the broader match-day experience, even if they opt out of spending big money on tickets.
With tailgating during the 2026 World Cup likely to remain limited due to FIFA regulations, the spending power of fans just outside the stadiums could create opportunities for alternative forms of engagement. Fan zones and other nearby hospitality events may offer effective ways to capture demand.
Strong demand for stadium-adjacent dining and entertainment.
Nearby dining and entertainment venues are among the most accessible experiences for fans in the stadium area, and these stand to benefit significantly from elevated game-day foot traffic.
Analysis of recent FIFA Club World Cup matches reveals the impact of match-day activity on local businesses. Visitor journey data from the June 25th, 2025 matchup between Inter Milan and River Plate at Seattle’s Lumen Field, and the June 28th, 2025 meeting between Palmeiras and Botafogo at Lincoln Financial Field in Philadelphia reveals that a significant share of stadium visitors also stopped at nearby dining and recreation venues on the day. Location intelligence also shows that, on the day of the match, each stadium-adjacent venue received a significant visit boost compared to its 2025 daily average.
This pattern underscores the potential impact of the World Cup on the surrounding commercial ecosystem. The stadium may anchor the experience, but fan engagement will likely spill into adjacent areas – creating opportunities for both organizers and local businesses. To take full advantage, restaurants and bars can position themselves as fan-friendly destinations through watch parties, extended hours, and even mobile or outdoor offerings in stadium corridors.
3. Host Regions Will See Broad Economic Impact
Dining demand will rise as fans converge.
Previous major sporting events – including the Super Bowl – demonstrate that the impact of large-scale sporting moments often extends beyond the immediate stadium vicinity into the broader regional economy.
In the weeks leading up to the latest Super Bowl in Santa Clara, CA on February 8th, 2026, both the San Francisco-Oakland-Berkley and San Jose-Sunnyvale-Santa Clara CBSAs saw a notable uptick in year-over-year dining traffic – outperforming the nationwide average. The timing suggests that early-arriving travellers combined with locals enjoying pre-event concerts and events helped fuel demand. In contrast, nationwide dining traffic saw a more pronounced lift the following week – likely tied to Valentine’s Day on February 14.
This pattern indicates that regions hosting – or located near – World Cup 2026 matches could experience similar pre-event dining tailwinds. As out-of-town visitors arrive and local engagement builds in the days and weeks leading up to key matches, restaurants and hospitality may benefit from elevated demand – particularly when supported by ancillary events and fan experiences.
Matches will drive high-value tourism to host cities.
Other recent examples suggest that cities hosting major events like the World Cup stand to benefit from an influx of out-of-town visitors – particularly those with higher spending power.
Since the beginning of 2025, New Orleans has hosted a series of popular events that drove significant non-local traffic. AI-powered trade area data indicates that during these periods, out-of-market visitors consistently exhibited a higher median HHI than both local residents and typical commuters into the city.
As expected, the 2025 Super Bowl generated the most pronounced spike in out-of-market visitor median HHI among the events analyzed, but the pattern extends beyond one-time spectacles. Recurring events like Mardi Gras and major music festivals also attracted high-income visitors to the city – likely benefitting the local hospitality, dining, and retail industries.
Looking ahead to the 2026 World Cup, host cities are likely to experience a similar dynamic. The tournament’s global draw will likely bring affluent travelers with discretionary dollars to the host regions – visitors that will spend not only on match tickets, but also on accommodation, dining, and shopping. By sponsoring tournament-related festivals, concerts, and experiences in or near retail corridors, cities can amplify the economic impact of the World Cup beyond the stadium.
4. The World Cup’s Impact Will Extend Nationwide
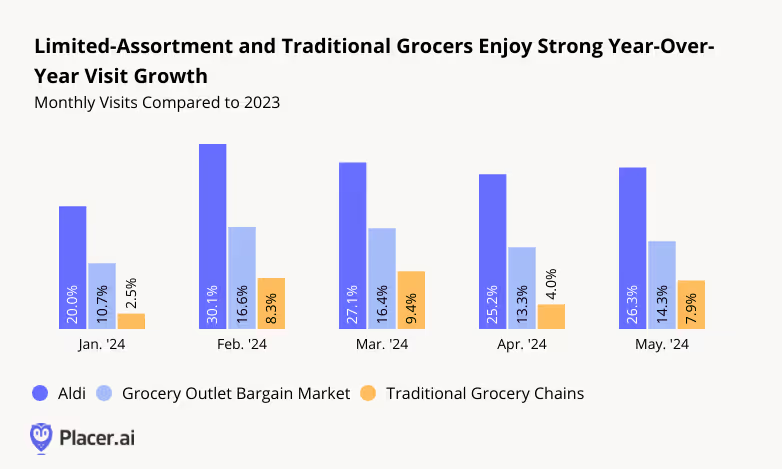
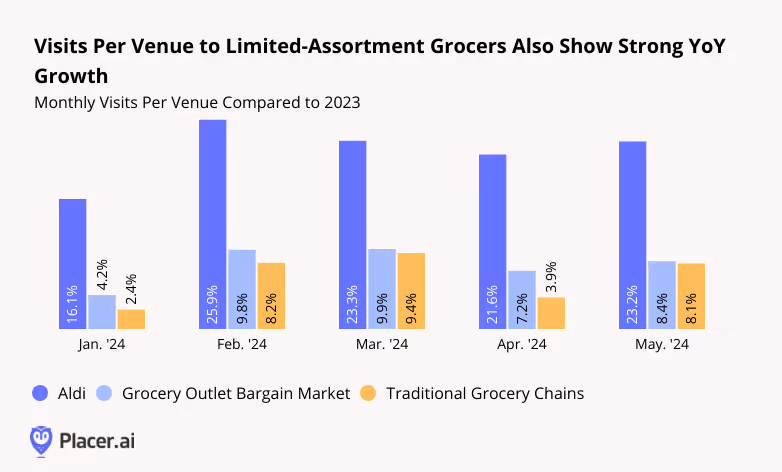
Grocery and party food chains will see repeat visit spikes.
The impact of the 2026 World Cup is unlikely to be confined to the select cities hosting matches. Major sporting events drive large-scale at-home viewership, generating ripple effects nationwide.
The Super Bowl offers a useful benchmark. In the days leading up to February 8th, 2026, visits to grocery stores and pizza chains rose above day-of-week averages for 2025, ultimately peaking on the day of the big game day as households appeared to pick up last-minute fixings and takeout for their watch parties.
This pattern indicates that the World Cup – with its extended schedule and multiple high-stakes matchups – could drive repeated waves of elevated grocery and take-out demand as fans gather together throughout the tournament.
Sports bars will experience elevated match-day traffic.
Of course, at-home viewing is just one piece of the match-day equation. Many fans opt for a more communal experience – gathering at sports bars across the country to watch the game alongside fellow supporters.
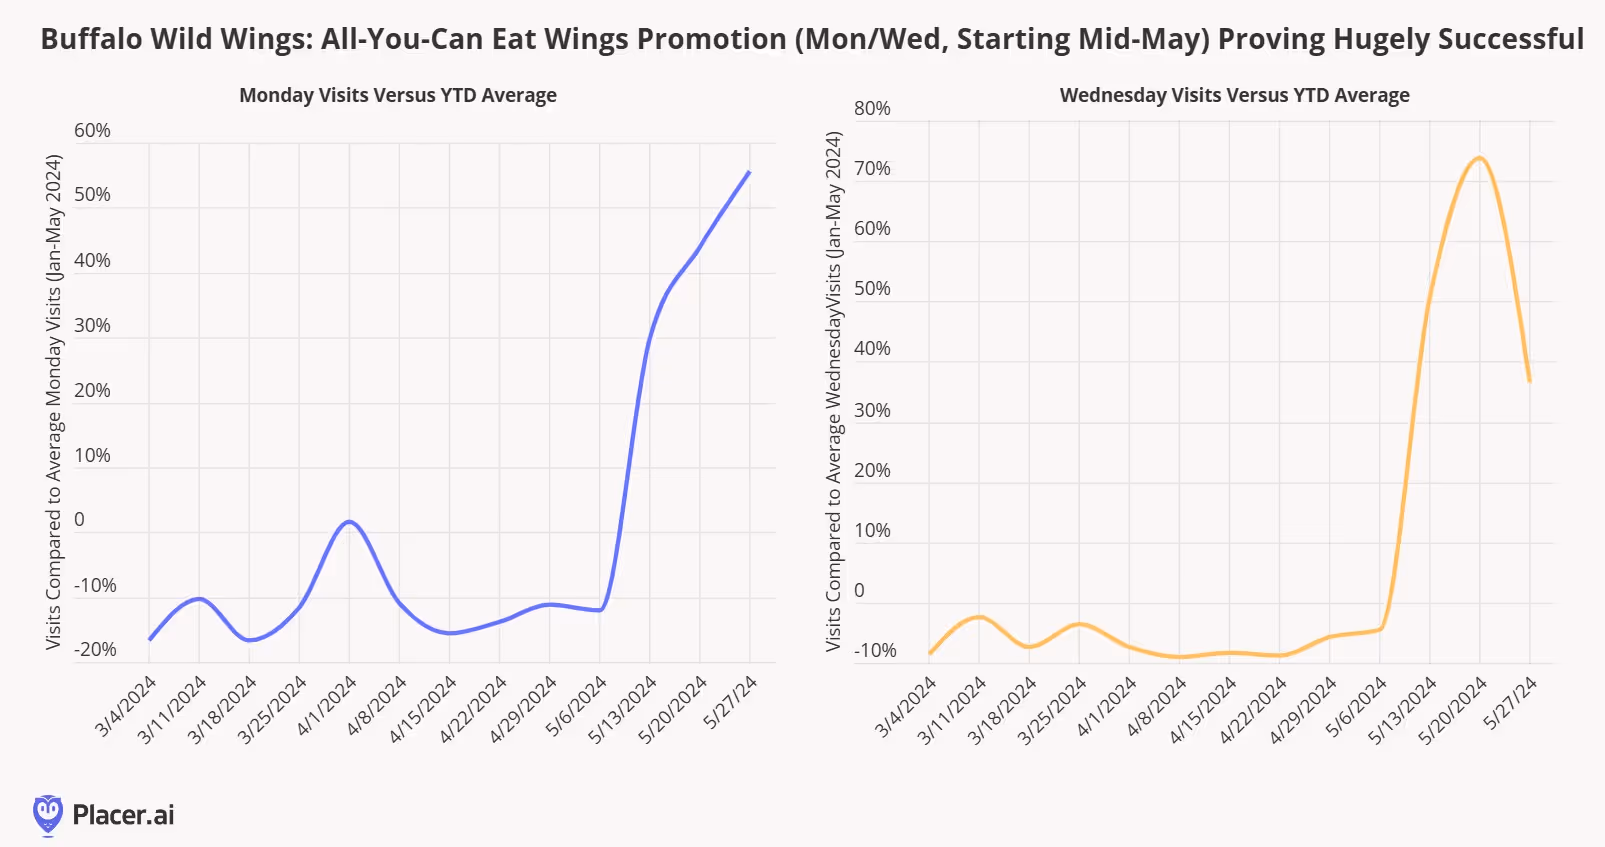
Recent highly-anticipated soccer matches offer a clear signal of this behavior. During the recent Allstate Continental Clásico, MLS Cup Final, and SheBelieves Cup Final, top sports bars in key markets like Los Angeles and Miami recorded visit spikes above day-of-week averages.
Not every World Cup fan will be able to attend in-person or travel to a host city, but previous match-day lifts in sports bar traffic demonstrate that fans nationwide will participate in the tournament experience.
One Tournament, Multiple Touchpoints
The 2026 FIFA World Cup is set to engage a wide spectrum of fans – from casual viewers at home to dedicated supporters traveling to stadiums – shaping how and where demand emerges.
As a result, the tournament’s impact will be felt across multiple layers of retail, dining, and tourism. Stadium-centered spending, activity in surrounding corridors, host-city consumer demand, and gatherings of spectators nationwide all point to a broad and interconnected World Cup effect that is likely to shape both audience composition and behavior at scale.


.svg)


.avif)
.avif)


