How do Waldorf Astoria and Ritz-Carlton guests differ, and where are they similar? Dive into the data to find out.
Bracha Arnold
Mar 28, 2024
3 minutes
Exploring Luxury Hotel Brands’ Guest Segmentation
The Waldorf Astoria and Ritz-Carlton hotels are two of the most recognizable names in luxury lodging. Both opened in New York City – the Waldorf Astoria in 1893 and the Ritz-Carlton in 1911 – and are owned by two major hotel corporations: the Waldorf Astoria is part the Hilton Hotels & Resorts portfolio of brands, while the Ritz-Carlton is part of Marriott International, Inc’s portfolio.
Who is most likely to visit each brand? What are the similarities – and differences – between the two hotels’ guest segmentations? We take a closer look at the demographic and psychographic data to find out.
Waldorf Astoria and Ritz-Carlton Attract High-Income Guests from Smaller Households
Analyzing the demographic makeup of the Waldorf Astoria and Ritz-Carlton’s trade areas by layering the STI: Popstats dataset onto captured market trade areas revealed that the Waldorf Astoria’s trade area has a higher share of households with children compared to that of the Ritz-Carlton (25.6% compared to 23.6%). But both chains had a smaller share of households with children in their trade areas relative to the nationwide average (27.6%). It seems, then, that singles or empty nesters may be more likely to book a luxury getaway than consumers with heavier parenting responsibilities.
Unsurprisingly, the chains also attract a particularly high-income clientele: The median household income (HHI) in both brands’ trade areas is over 50% higher than the nationwide median ($108.4K and $104.5K for the trade areas of the Waldorf Astoria and Ritz Carlton, respectively, compared to a nationwide median of $69.5K). The data also showed that Waldorf Astoria’s trade area is slightly more affluent than that of the Ritz-Carlton – perhaps due in part to the Ritz-Carlton’s recent attempts to court younger guests.
Families Prefer the Waldorf Astoria, Smaller Households Go to the Ritz-Carlton
Leveraging the Spatial.ai: PersonaLive dataset to explore the psychographic composition of the hotel chains’ trade area further supports the distinctions between the brands highlighted in the demographic analysis.
The psychographic analysis showed that the Waldorf Astoria had more family segments in its trade area than the Ritz-Carlton, while the Ritz-Carlton catered to more single and empty-nester households – as expected given the demographic composition of the chains’ trade areas.
Dining and Leisure Preferences
Luxury hotels are known for their impeccable service – and to curate the ideal guest experience, these brands need to accurately predict their visitors' dining and leisure preferences. Hoteliers can leverage the Placer.ai Marketplace and combine trade area data with various datasets – including data on consumers’ social media activity with tools like the Spatial.ai: FollowGraph dataset – to pinpoint their guests’ tastes and preferences.
Analyzing the preferences for certain types of foods or entertainment within the hotel chains’ trade areas revealed – once again – similarities and differences between the brands. Both chains’ trade areas included larger shares of “Farm-to-Table Cooking Enthusiasts”, “Asian Food Enthusiasts”, and “Craft Coffee At-Home Enthusiasts,” as well as more “Opera Lovers” and “Salsa Music Fans” than the nationwide average. But the foodie segments were slightly more over-indexed within the Waldorf’s trade area, while residents of the Ritz-Carlton’s trade area seemed a little more keen on Opera and Salsa. These hotel chains can leverage this data to determine the type of dining or entertainment options that will set these brands apart from the competition and best attract their specific audience.
Customer Segmentation and Loyalty
The Waldorf Astoria and Ritz-Carlton continue to define luxury lodging in the country while attracting some of the nation's most discerning guests. Understanding the demographic and psychographic guest segmentation of each chain can help inform your loyalty strategy.
For more data-driven travel & leisure insights, visit placer.ai/blog.
This blog includes data from Placer.ai Data Version 2.0, which implements improvements to our extrapolation capabilities, adds short visit monitoring, and enhances visit detection.
St. Patrick's Day is a day for bar crawls, green makeup, and drinks with friends. Cities host major celebrations, a draw to their downtown areas. What kind of a lift do bars and pubs get on the big day? And what other retail categories stand to benefit from the occasion?
Lila Margalit
Mar 27, 2024
3 minutes
St. Patrick’s Day, which falls each year on March 17th, is a day for bar crawls, green makeup, and drinks with friends. Cities like New York and Chicago host major celebrations, drawing big crowds to their downtown areas. And bars and pubs fill up with revelers eager to mark the occasion with a green cocktail or a taste of corned beef and cabbage.
There’s plenty of joy to go around – and towns across the country are getting in on the St. Paddy’s Day action with parades and family-friendly events. What kind of a lift do traditional St. Patrick’s Day destinations like bars and pubs get on the big day? And what other retail categories stand to benefit from the occasion?
A Lucky Day for Bars and Pubs, of Course
Unsurprisingly, bars and pubs get major boosts on the week of St. Patrick’s Day, as club hoppers and other celebrants converge on their local watering holes for drinks and fun. Chains like The Brass Tap and Bar Louie offer special deals and parties, with everything from green beer to Irish whiskey. And on the week of March 11th, 2024, visits to the two chains were up 15.7% and 21.1%, respectively, compared to an early October baseline – slightly outpacing even the busy Christmas season.
Pharmacies and Grocery Stores: Hold my Beer
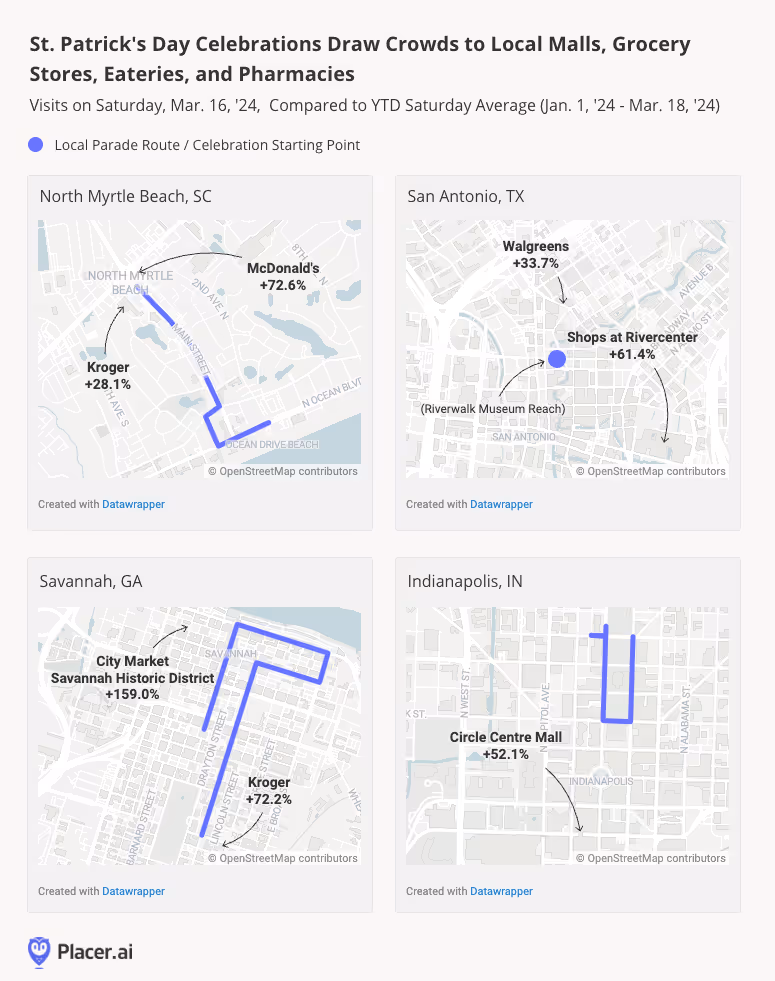
But St. Patrick’s Day isn’t just for bar crawling. And although the festivities are usually associated with major metropolises like New York City and Chicago, cities like Myrtle Beach, SC, San Antonio, TX. Indianapolis, IN, and Savannah, GA also come to life mid-March with parades and parties rivaling those of their bigger counterparts.
On Saturday, March 16th 2024 at 11:00 A.M., San Antonio, TX kicked off its annual St. Patrick’s Day festivities with the traditional dyeing of the San Antonio River. Throughout the weekend, parades and celebrations drew crowds to the city’s famed River Walk – and while bars and clubs undoubtedly benefited from the excitement, they weren’t the only ones to do so. San Antonio’s Shops at Rivercenter enjoyed its busiest day since 2019, drawing 61.4% more foot traffic on March 16th than on an average Saturday this year.
Savannah, GA, North Myrtle Beach, SC, and Indianapolis, IN also hosted big St. Patrick’s Day events, bringing foot traffic – and business – to local retailers. For Savannah, March 16th, 2024 marked the 200th anniversary of the city’s famous St. Patrick’s Day Parade, and the town was positively booming. City Market, the iconic shopping corridor located in the heart of Savannah’s Historic District, was the most crowded it’s been since at least January 2023, with March 17th 2023 (the day of last year’s parade) coming in a close second.
Malls and shopping districts weren’t the only places to get significant leprechaun-inspired visit bumps. Grocery stores, pharmacies, and eateries located in proximity to the festivities also reaped the benefits of the hubbub, as parade-goers likely dropped in to snag some essentials or fuel up for the long day.
Leprechauns Have to Sleep Somewhere… Hotels Get a Boost
And it isn’t just locals turning out for all these events. A look at hotel foot traffic patterns nationwide shows that the week of St. Patrick’s Day kicks off the hospitality industry’s spring season – with cities hosting special events seeing even more significant visit spikes. During the week of March 11th, 2024, hotel venues in the analyzed cities drew many more visits than usual, showcasing the power of St. Paddy’s Day to supercharge the tourism sector.
Plenty of Green to Go Around
St. Patrick’s Day is about a lot more than bars and pubs. And in recent years, the popular green-themed holiday has emerged as an important driver of tourism and retail activity across the U.S.
What other local celebrations are fueling foot traffic spikes in cities nationwide? Does your city know the impact of location celebrations on local businesses? Are local businesses prepared for the increase in foot traffic and revenue opportunities during local celebrations?
This blog includes data from Placer.ai Data Version 2.0, which implements improvements to our extrapolation capabilities, adds short visit monitoring, and enhances visit detection.
JOANN recently announced that it had filed for bankruptcy, and the company expects to go private as early as next month. Can the retailer still make a comeback? We dove into the data to find out.
Shira Petrack
Mar 26, 2024
3 minutes
JOANN recently announced that it had filed for bankruptcy, and the company expects to go private as early as next month. Can the retailer still make a comeback? We dove into the data to find out.
JOANN’s Rollercoaster Trajectory Since 2019
JOANN went public in March 2021 – at the height of the pandemic – following a particularly strong 2020. The COVID-era crafting boom had put the company on a growth trajectory, with visits during the first year of the pandemic barely lower than in 2019 despite the lockdowns and movement restrictions. But as the country reopened and people’s schedules filled back up – leaving less time for sewing and knitting – visits began to fall. Foot traffic in 2021 was lower than in 2020, and by 2022, overall visits to the chain were 11.8% lower than they had been in 2019
But now, recent foot traffic data indicates that demand for fabric-related crafting supplies may be rebounding. In 2023, visits to the chain grew relative to 2022 and the visit gap relative to 2019 narrowed. Sewing appears to be making a comeback, with both millennials and Gen-Z exhibiting a newfound interest in the craft. And although the resurgence of interest in fiber arts was not strong enough to prevent JOANN’s recent bankruptcy filing, the YoY visit growth in 2023 indicates that the company should not be written off just yet.
JOANN is Pulling Ahead of the Competition
According to C.F.O. Scott Sekella, 95% of JOANN’s stores are cash-flow positive. The company is also committed to maintaining usual operations during the court-supervised procedure. And this year as well – especially since the end of early 2024’s cold spell – JOANN’s year-over-year (YoY) visits have trended positive, even outperforming YoY foot traffic to other leading crafting retailers.
Focusing on Growth Dayparts May Help JOANN Optimize In-Store Operations
The unique nature of JOANN’s products give the company’s brick-and-mortar stores an advantage over digital counterparts: Crafters like to get a feel for the material before purchasing, and amateur DIY-ers who visit physical stores can consult with expert salespeople to receive guidance for ongoing projects. And although foot traffic to JOANN’s stores is not what it was at the height of the pandemic, the YoY visit growth in 2023 indicates that the brand is still serving many committed sewers and knitters who are choosing to shop in-person. So how can JOANN maintain its store fleet while optimizing in-store operations?
Analyzing the change in hourly visits between 2022 and 2023 reveals that the YoY growth is not evenly distributed across dayparts. Morning and early afternoon visits saw modest increases, but traffic growth really ramped up in the afternoon and evening – peaking between 6:00 and 6:59 PM – and visits actually decreased between 7:00 and 8:59 PM. Should the company try to streamline its logistics without sacrificing its large store fleet, JOANN may focus its staffing and operational costs on the dayparts with the most growth potential and reduce expenditure during the less popular timeslots.
JOANN Well-Positioned To Thrive Post-Bankruptcy
Despite the crafting retailer’s current rough patch, location intelligence suggests that the company is a strong contender for a post-bankruptcy comeback. And the positive YoY trends also indicate that – despite the ongoing headwinds and contraction in discretionary spending – there is still demand for hobby-driven retail in 2024.
How will the bankruptcy proceedings impact foot traffic to JOANN? What does the rest of 2024 hold for the brand?
This blog includes data from Placer.ai Data Version 2.0, which implements improvements to our extrapolation capabilities, adds short visit monitoring, and enhances visit detection.
With rumors swirling of a potential Panera Bread IPO in 2024, we dove into the data to find out how the St. Louis, Missouri-based company is performing – and what sets Panera apart from its competition.
Shira Petrack
Mar 25, 2024
4 minutes
With rumors swirling of a potential Panera Bread IPO in 2024, we dove into the data to find out how the St. Louis, Missouri-based company is performing – and what sets Panera apart from its competition.
Panera Bread’s Foot Traffic on the Rise
Panera Bread has been on a growth spurt recently, with monthly visits over the past 12 months consistently exceeding 2022/2023 levels. Part of the traffic increase may be due to the brand’s larger store fleet – Panera expanded into urban and non-traditional markets with small-format locations focused on pick-up and digital ordering. And the company is not resting on its laurels, with Panera revamping its menu to compete more directly with meal-focussed fast casual concepts.
Panera Plays a Unique Role Within the QSR/Fast Casual Landscape
Because Panera straddles the line of coffee QSR and fast-casual lunch spot, there is no one dining chain that directly competes with Panera on all fronts. Instead, Panera plays a unique role in the QSR/fast casual landscape: The chain has a strong café feel, with the company’s “Sip Club” membership program seems specifically designed to appeal to customers looking for frequent coffee fixes. But Panera also offers more substantial fare, and the upcoming menu overhaul promises to add even more hearty salads and affordable sandwiches to its array of options.
The new menu may be aimed towards attracting more budget-conscious diners thanks to a focus on larger portions and the addition of several items priced at under $10. Some speculate that the changes are also part of the company’s broader refocusing towards the lunchtime daypart. Comparing Panera to Starbucks, which competes with Panera on the coffee shop and affordable foods front, and to Sweetgreen, a strong presence in the fast-casual lunch market, can shed light on Panera’s role within the increasingly competitive dining landscape.
Panera’s Visit Trends Reveal Its Appeal During All Day Parts
Panera’s hourly visitation pattern highlights its unique place within the wider QSR-fast casual landscape. Like Sweetgreen, Panera experiences a lunchtime foot traffic rush – 30.8% of daily visits to the chain take place between 12 PM and 2 PM. But Panera also receives almost a third of its visits before noon – 30.2% of visits to the chain take between 6 AM and 11 AM, compared to just 13.2% of visits to Sweetgreen. Between 9 AM and 11 AM, Panera’s hourly visit share of 20.8% is almost on par with Starbucks’ 25.3%. (The small number of morning Sweetgreen visits is likely also driven by a difference in opening hours, with most Sweetgreen locations only opening at around 10:30 AM).
Meanwhile, Panera also seems to be a strong dinner contender. Although Panera’s evening performance may not be quite as strong as Sweetgreen’s, the St. Louis-based dining chain still sees 17.3% of its daily visits between 6 PM and 8 PM – almost double Starbucks’ 9.8.%.
These hourly visitation patterns indicate that while a significant contingent of Panera patrons treat the chain as their go-to coffee shop, many others tend to consider Panera as a lunch or early dinner destination.
Demographically, Panera’s Visitor Base is Most Similar to Starbucks’
Although analyzing hourly visitation patterns highlight similarities between Panera and Sweetgreen, focusing on the three chains’ visitor bases reveals many more similarities between Starbucks and Panera.
The median HHIs in Panera and Starbucks’ trade areas stand at $79.2K/year and $76.4K/year, respectively. Around 34% of both chains’ trade areas consist of non-family and one-person households and 28% consist of households with children. Meanwhile, Sweetgreen tends to attract a much larger share of affluent singles – 42.9% of households in Sweetgreen’s trade area are non-family and one person households, and the salad and grain-bowl focused chain has a trade area median HHI stands at $102K/year.
It seems, then, that although Panera appears to compete with Sweetgreen for the lunch rush – and to a lesser extent, for dinner visits as well – the two brands’ audience bases are substantially different. On the other hand, Panera’s visitor base seems to overlap significantly with that of Starbucks – which may explain Panera’s move towards enhanced portion sizes and affordable meal options, which may set it even further apart from the Seattle-based coffee giant.
Bright Future Ahead
Panera Bread is one of 2024’s most anticipated IPOs – and location intelligence metrics suggest that the buzz is well substantiated.
For more data-driven dining insights, visit our blog at placer.ai.
This blog includes data from Placer.ai Data Version 2.0, which implements improvements to our extrapolation capabilities, adds short visit monitoring, and enhances visit detection.
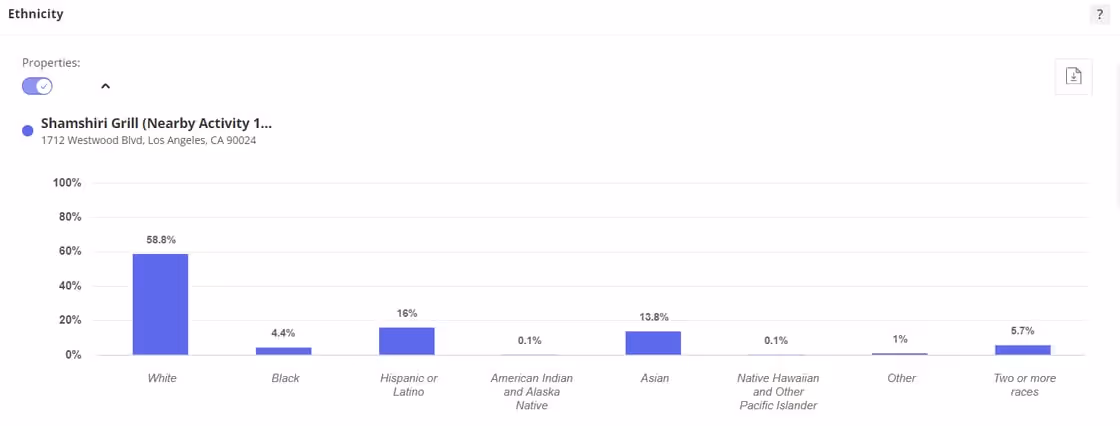
Nowruz took place on March 20 this year, and this celebration of the spring equinox dates back over three thousand years. Westwood Blvd, just south of UCLA, is home to a profusion of Persian restaurants, markets, bookstores, and ice-cream stores with flavors not found in your typical Baskin-Robbins. Hence, the affectionate moniker Tehrangeles for this little pocket where an Iranian diaspora has settled.
Restaurants like Shamshiri Grill, with its juicy beef koobideh kebab broiled to perfection and tomatoes that burst in your mouth, proves to be a hit with a wide cross-section of Angelenos. For dessert, be sure to stop at nearby Saffron & Rose for their namesake flavors or Mashti Malone’s for a uniquely Persian faloodeh shirazi, similar to a rosewater sorbet, topped with cherry sauce and rice starch vermicelli.
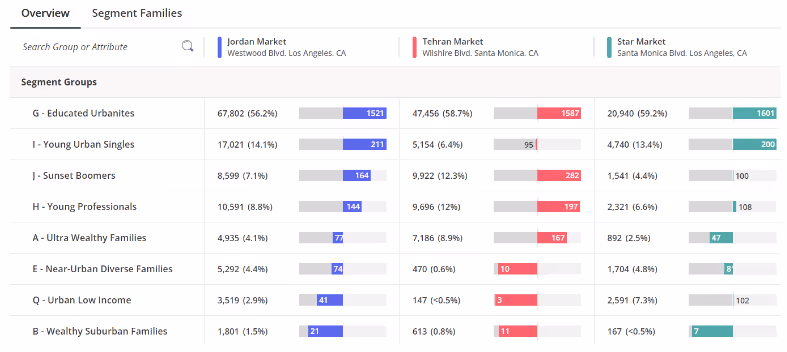
There are also numerous Persian markets in the area should you want to buy groceries and try cooking yourself. Jordan Market, Tehran Market, and Star Market all see over half their clientele come from the segment of Educated Urbanites.
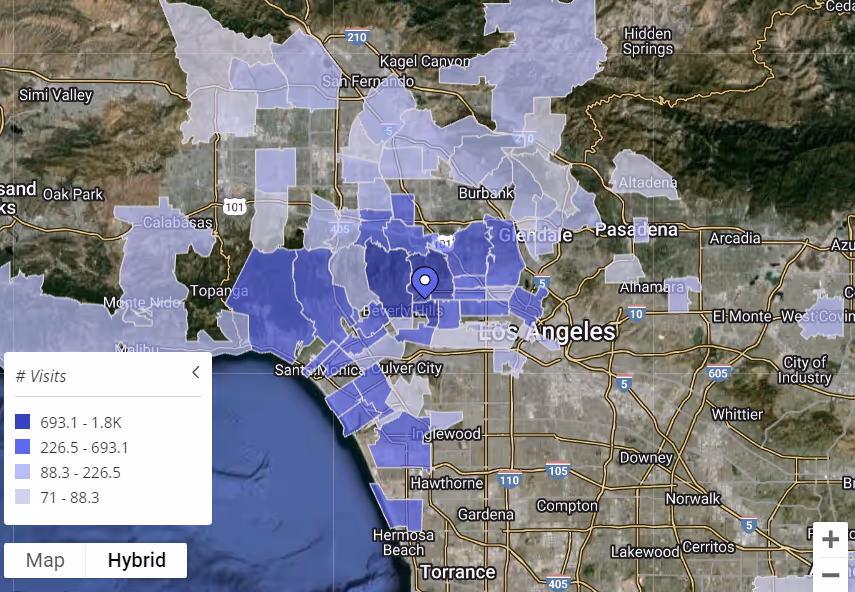
If you’d like to simultaneously celebrate Women’s History Month and buy yourself a little something for the New Year, then look no further than Cult Gaia, just a short drive away in West Hollywood. Founded by Jasmin Larian Hekmat in 2012, its Ark bag reached cult status within just a few years. Oozing a vacation-ready vibe and cool-girl aesthetic, the LA-based designer has most recently opened up a new store on the ritzy island of St. Barths. While the majority of visits to the West Hollywood store come from metro LA, there are still quite a few fans coming from further afield to shop.
Family Dollar will be dramatically rightsizing its store fleet, with 600 stores slated for closure in 2024. We dove into the location intelligence for Family Dollar and three other leading value-forward retailers to understand which chain stands to benefit most from Family Dollar’s contraction.
Shira Petrack
Mar 21, 2024
5 minutes
Family Dollar’s parent company Dollar Tree recently announced plans to dramatically rightsize the discount chain’s store fleet, with 600 stores slated for closure in 2024 and more to follow in upcoming years for a total of almost 1000 closures. We dove into the location intelligence for Family Dollar and three other leading value-forward retailers to understand which chain stands to benefit most from Family Dollar’s contraction.
Discount & Dollar Store Growth Bypassed Family Dollar
Dollar Tree’s plans to close almost 1000 Family Dollar stores did not surprise retail analysts. Discount & Dollar Stores have been on the rise in recent years, driven in part by significant expansions – visits to the industry up 25.4% in Q1 2023 and up 55.8% in Q4 2023 relative to pre-pandemic Q1 2019. But this growth seems to have bypassed Family Dollar. Q1 2023 visits to the brand were up just 0.8% and traffic during the critical holiday-driven Q4 2023 was up just 9.8% since Q1 2019.
Meanwhile, the eponymous banner of Family Dollar’s parent company Dollar Tree outperformed the wider industry during the same period, with a 28.4% increase in Q1 2023 visits and a 72.1% increase in Q4 2023 visits relative to a Q1 2019 baseline.
Competition for the Visitor Base of Shuttered Family Dollars
The Discount & Dollar Store space includes major players like Dollar General and the Dollar Tree banner that can fill the voids left by shuttering Family Dollar Venues. Walmart also may step into some of the newly created gaps. Analyzing the demographic and psychographic composition of the trade areas of these four chains – Family Dollar, Dollar General, Dollar Tree, and Walmart – may reveal the chain(s) best positioned to cater to Family Dollar’s current visitor base.
Family Dollar and Dollar General Share Hourly Visitation Patterns
Most people have set daily shopping habits, and chains will likely have more success vying for Family Dollar’s visitor base if they can accommodate the current visitation patterns of Family Dollar shoppers.
Family Dollar and Dollar General respectively receive 37.0% and 37.9% of their daily visits between the hours of 5:00 PM and 8:59 PM. Meanwhile, only 31.2% of Dollar Tree’s visitors and 34.3% of Walmart visitors visited those chains in the late afternoon and evening. The similarities between Dollar General and Family Dollar’s visitation patterns may mean that Dollar General’s staffing and opening schedule is suited to handle the influx of former Family Dollar visitors without making these visitors modify their current shopping behavior.
Family Dollar Serves a Distinct Demographic Base
Analyzing the four chains by trade area median household income (HHI) also shows that Family Dollar is closer to Dollar General than to Walmart or Dollar Tree – but the data also reveals that Family Dollar serves a distinct demographic base. The chain has a potential market median HHI of $62.1K and a captured market median HHI of $48.3K – in both cases, the lowest trade area median HHI of the four chains analyzed.
Potential market analysis weighs the Census Block Groups (CBG) making up a trade area according to the number of residents in each CBG. The low median HHI in Family Dollar’s potential market means that the chain’s venues tend to be located in lower-income areas compared to the other chains’ store fleets.
Captured market median HHI reflects the median HHI in the CBGs making up a trade area weighted according to the number of visits to the chain from each CBG. And comparing the four chains indicates that the gap between Family Dollar and the other three chains is even larger when looking at the captured market median HHI, with Family Dollar serving the lowest income households within its potential market.
Still, Dollar General’s trade area median HHI is closest to that of Family Dollar – although Family Dollar’s trade area median HHI is still significantly lower than that of Dollar General – which could mean that Dollar General will be most attractive to Family Dollar’s former visitors.
But looking at other metrics suggests differences in household composition between Family Dollar and Dollar General. Although the potential market share of households with children is similar for the two chains, Family Dollar’s captured market share is higher while Dollar General’s captured market share of households with children is lower.
Family Dollar’s popularity among lower-income households with children may explain why the chain has been struggling in recent years, as this demographic has been particularly hard-hit by the recent economic headwinds. And this distinct demographic base may also mean that Dollar General might want to make some merchandising, pricing, or marketing adjustments to best serve Family Dollar’s former visitors.
Psychographic Similarities between Family Dollar and Other Discounters’ Visitor Base
Although the demographic composition of Family Dollar’s trade areas sets the chain’s visitor base apart, diving into the psychographic segmentation of the chain’s captured and potential market highlights similarities with other value-forward retailers.
All four chains analyzed seem particularly popular with rural audiences – specifically with the Rural Average Income and Rural Low Income segments as defined by the Spatial.ai: PersonaLive dataset. (Dollar General and Walmart also see a disproportionate number of visits from the Rural High Income segment within their potential markets.) So some of Family Dollar’s rural shoppers may already be visiting Walmart or Discount & Dollar Stores – and these other retailers may choose to open in areas where Family Dollar is closing and where no other discounter currently operates.
The massive rightsizing of Family Dollar’s store fleet creates major opportunities for other value-driven retailers to expand their reach. Who will end up benefiting most from these shifts?
This blog includes data from Placer.ai Data Version 2.0, which implements improvements to our extrapolation capabilities, adds short visit monitoring, and enhances visit detection.
How shifting consumer priorities are reshaping value perceptions across QSR, fast casual, and casual chains.
July 9, 2026
The New Definition of Value
As consumer sentiment hovers near historic lows and the cost of goods remains elevated, value has become a defining theme across the dining industry. Yet within the sector's diverse restaurant categories – and for individual brands – the question is no longer whether consumers are seeking value, but what value actually means. A closer look at chains across the industry suggests that, amid ongoing economic pressure, perceptions of value are evolving. For some consumers, value may be tied to affordability and promotions; for others, it may come from quality, convenience, or experience. The result is a market with multiple paths to winning consumer traffic.
Dining Traffic Remains Unstable in 2026
After an uneven but largely resilient 2025, dining traffic in 2026 tipped into a sustained decline.
Monthly visits to the overall dining industry have trailed year-ago levels throughout 2026, with February standing as the lone exception. That month saw a 3.7% year-over-year (YoY) increase in visits, driven in part by comparisons to the period of initial tariff announcements in early 2025. But broader trends remained challenged, and May's 2.5% YoY decline marked the steepest monthly drop of the past twelve months as rising gas prices and weakening consumer sentiment appear to have added pressure to an industry already navigating a difficult environment.
Breaking Down the Industry
These headwinds, though, have not landed evenly. Across the dining sector, some segments have faced more intense pressure than others, with much of the divide coming down to how consumers are perceiving value against experience.
QSR’s Value Proposition Under Pressure From Grocery Stores & Superstores
Over the past several years, inflation and rising menu prices have gradually weakened a cost-based value proposition that has long been central to the QSR segment. More recently, elevated gas prices have added another deterrent, making a trip through the drive-thru a less compelling choice for some consumers.
Strong performance at grocery stores and superstores suggests that competition for share-of-stomach is increasingly extending beyond traditional restaurant rivals. With expanding selections of ready-to-eat and pre-prepared meals, these channels are offering consumers a combination of value, convenience, and quality that can increasingly match limited-service dining options. At the same time, ongoing pressure on household budgets appears to be driving more consumers toward lower-cost meals made at home, creating additional headwinds for the QSR segment.
Fine Dining and the Fast Casual Middle Hold Firm
Yet for many consumers, there is still a time and place for dining out, and in the face of mounting economic pressure, several dining formats have found foot traffic success. Fine dining has posted traffic growth in nearly every month of 2026, with March standing as the lone exception. That decline was likely influenced by a calendar shift, as March 2026 contained one fewer Saturday than March 2025 – a meaningful headwind for full-service restaurants given the outsized role weekends play in driving visits. The segment's sustained growth points to the resilience of higher-income consumers and the enduring appeal of premium, occasion-driven dining experiences.
Fast casual and casual dining have also proven relatively resilient. The fast casual category saw positive YoY foot traffic in every month of 2026 so far, while casual dining's performance has rebounded since the March calendar shift that likely weighed on YoY traffic. A second calendar shift in May 2026 led to an extra Saturday in the month, which likely helped the segment's overall trend. These trends suggest that both fast casual and casual dining occupy an increasingly attractive middle ground where value is defined as a combination of affordability and experience. At the same time, years of menu price hikes at QSR chains have altered the cost equation in fast casual and casual dining's favor, narrowing the price gap between fast food and more elevated dining formats. As that gap has narrowed, consumers may be placing greater emphasis on experience and quality when deciding where to dine.
Inside the Playbooks of Fast Casual Standouts
The balance between price and elevated experience has made fast casual a favorite for value in the dining industry in 2026. A closer look at two of the segment's largest players, CAVA, a relatively young concept, and Chipotle, a legacy chain navigating operational challenges, shows how brands can deliver on that value proposition in different ways and win in today’s dining landscape.
Chipotle Creates Value With LTO Experiences and Loyalty Perks
Chipotle's traffic trends in 2026 have improved compared to 2025, with the brand offering a clear example of how fast casual brands can create value by pairing menu innovation with loyalty perks.
Chipotle outpaced the broader fast casual category in YoY visits nearly every week of 2026 so far. And the graph below shows that the chain's strongest traffic gains tended to coincide with major menu launches and loyalty initiatives – a key component of its ongoing "Recipe for Growth" strategy.
The return of fan-favorite Chicken al Pastor in the week of February 9, 2026 helped drive a 16.6% YoY increase in visits. Two months later, the launch of "Rewards on Repeat" – a refreshed loyalty program offering freebies upon sign-up – generated the period's largest weekly traffic gain, with visits rising 18.2% YoY. And the introduction of Honey Chicken on April 28 provided another boost, as the chain continued to rotate limited-time protein offerings and give customers reasons to return.
These performance peaks suggest that Chipotle has been particularly effective at pairing menu novelty with loyalty perks to reinforce a value proposition anchored by quality and experience.
Chipotle's "Recipe for Growth" Drives Traffic With Loyalty and LTO Launches
Year-over-Year Change in Weekly Visits, Chipotle vs. Fast Casual, Jan.–Jun. 2026
ChipotleFast Casual
Dashed lines mark key Chipotle promotional launch dates. Week-of dates shown; launches may have occurred mid-week.
Share
Embed:
CAVA Expansion and Differentiated Dining Experience
If Chipotle illustrates the power of menu innovation and loyalty-driven engagement, CAVA highlights a different approach to creating value – one rooted in variety, customization, and a consistently differentiated dining experience.
CAVA's overall visits climbed well above 20% YoY in every month of 2026, a pace largely driven by aggressive unit expansion. Meanwhile, same-store visits, which measure traffic at locations open for at least twelve months, sustained positive YoY growth – evidence of genuine demand at existing restaurants alongside a rapidly growing footprint.
While Chipotle leans on limited-time offers, CAVA's growth rests on a consistent, customizable experience. A deep roster of proteins paired with a wide range of bases, dips, and toppings, gives the chain built-in variety that helps keep the concept feeling fresh. In addition, CAVA's Mediterranean-inspired menu offers flavors and combinations that are less easily replicated at home, helping the brand maintain a differentiated experiential value proposition and drive growth.
O Though Chipotle and CAVA are at different points in their evolution and have taken different paths to growth, both highlight the enduring appeal of fast casual's balance of value and quality. In a dining environment where consumers are increasingly weighing cost against experience, the segment's ability to deliver on both has helped make it one of the industry's strongest-performing formats.
Casual Chains Thrive On Everyday Value
Fast casual isn't the only dining segment benefiting from consumers' evolving perception of value. In 2026, several casual dining chains have found success by pairing accessible price points with the elevated experience of a sit-down meal.
Brands such as BJ's Restaurant & Brewhouse, Chili's Grill & Bar, Bonefish Grill, Cicis, and The Cheesecake Factory all posted positive YoY visit growth in multiple months this year, demonstrating that even in a challenging economic environment, diners are motivated when they feel they are getting more in return. These results are particularly notable given the impact of calendar shifts, which weighed on March 2026 comparisons – and provided a tailwind to May performance.
Unlike many fast casual chains, these brands have not relied heavily on a steady stream of limited-time offers to drive traffic. While menu innovation remains part of the playbook, promotions often serve as ticket builders or engagement tools rather than primary traffic catalysts. Instead, these successful casual dining chains have focused on creating everyday value that diners can depend on, narrowing the price gap between limited-service restaurants and full-service dining.
The result is a value equation that encompasses table service, a more relaxed dining environment, and a place to socialize or celebrate an occasion. In an environment where consumers are increasingly weighing cost against overall experience, that combination appears to be helping several casual dining chains maintain positive traffic momentum.
The State of Dining in 2026
Although dining traffic has softened in 2026, the industry's performance suggests that consumers have not stopped spending on restaurants altogether. Instead, they have become more selective about where they dine and what they expect in return.
Across segments, the strongest performers have found different ways to deliver value. For some brands, that means menu innovation, loyalty engagement, and differentiated experiences. For others, it means dependable affordability paired with the service and atmosphere of a sit-down meal. As economic pressures continue to shape consumer behavior, the data suggests that value is no longer defined by price alone, but by the balance of cost, convenience, quality, and experience.
Find out where Americans are moving in 2026, why they're relocating, and how developers, investors, and retailers can stay ahead of the trends.
June 18, 2026
The Geography of Domestic Migration
During the pandemic and its aftermath, Americans were on the move. Millions left expensive coastal markets for lower-cost destinations across the Sun Belt, while boomtowns such as Bozeman, Boise, and Austin struggled to keep pace with the influx of new residents.
That wave of relocation has since cooled, as return-to-office mandates, higher mortgage rates, and a shrinking affordability gap between coastal cities and many COVID-era hotspots have dampened the incentive to move. But even in a slower market, domestic migration remains one of the most powerful forces shaping local economies, housing markets, and consumer demand.
This report leverages AI-powered location analytics to examine the relocation patterns reshaping the United States in 2026 – where Americans are moving, the demographic and economic forces driving those decisions, and how retailers, investors, developers, and policymakers can respond to the opportunities and challenges created by these shifts.
Which major metros are attracting the most new residents? Which pandemic-era standouts have seen growth stall or reverse? And what factors best predict a large metro area's domestic migration growth potential in 2026?
Interstate Flows: Which States Gained and Lost Residents?
South Carolina and Delaware Set the Pace
The latest statewide migration data shows that the slower relocation pace observed in 2024 persisted into 2025. No state recorded net inflows or outflows exceeding 0.7% of its starting population. And while several smaller states continued to attract new residents at meaningful rates, none of the nation's six most populous states saw net in-migration exceed 0.2%.
Among those smaller states, South Carolina and Delaware led the nation with net in-migration equal to 0.7% of their populations, followed by Idaho (0.6%), Maine (0.5%), Tennessee (0.4%), and North Carolina (0.3%). For most of these states, migration accelerated relative to 2024, though Delaware's inflow rate moderated slightly and North Carolina held steady.
Despite their differences, these states tend to offer a similar mix of lifestyle amenities, relatively low congestion, and opportunities for growth. Many also benefit from business-friendly climates, favorable taxpolicies, or housing costs that remain attractive relative to the higher-cost markets from which they draw new residents.
Vermont Trails Behind
At the other end of the spectrum was Vermont, which saw the nation’s largest net outflow as share of population in 2025, losing 0.4% of its population to domestic relocation. The decline deepens a reversal that first emerged in 2024, when the state swung to a net loss of 0.2%, after attracting inflows of 0.8% and 0.5% in 2022 and 2023, respectively.
Vermont's reversal likely reflects a combination of factors, including return-to-office mandates and the waning appeal of remote work. Housing undersupply in the state may have alsocontributed, illustrating how important infrastructure investments are to sustaining migration gains over time.
South Carolina, Delaware, and Idaho Lead the Nation in Domestic Migration Growth in 2025
Net Domestic Migration as a Share of Each State's Starting Population, 2025
Net Migration by State
−0.4%0.0%0.7%
Top Migration Magnets
2024
2025
*Analysis for each year is from Jan. – Dec.
Share
Embed:
Florida Sees Accelerated Inflow as Legacy Exodus States Slow Losses
Among the nation's six most populous states, Florida was the only one to see accelerating net in-migration in 2025, attracting new residents equal to 0.2% of its starting population, up from 0.1% the year before. Texas, by contrast, slowed from 0.1% net in-migration in 2024 to essentially flat in 2025, highlighting the cooling of what was once one of the country's strongest pandemic-era migration magnets.
Meanwhile, the legacy "exodus" states continue to lose residents, but at a slower pace than in previous years. Illinois and California have seen their migration deficits steadily narrow, with further improvement in 2025. Between 2022 and 2025, Illinois moved from -0.8% → -0.2% → -0.2% → -0.1%, while California moved from -0.9% → -0.4% → -0.3% → -0.2%. And though New York has held steady at -0.2% over the past two years, this marks a significant moderation from 2022, when the state experienced net outmigration equal to 1.1% of its population.
Major Insights:
Smaller states dominated migration gains in 2025, led by South Carolina, Delaware, Idaho, Maine, Tennessee, and North Carolina.
Vermont posted the nation's largest outflow after attracting strong inflows just a few years earlier.
Florida was the only top-population state to see meaningful net in-migration in 2025.
Texas' migration boom continued to cool, with net in-migration falling to flat in 2025.
Outmigration from New York, Illinois, and California is slowing, but these states are still losing residents overall.
Zooming In: Net Migration Across Metro Boundaries
Statewide trends reveal important shifts, but a closer look at the nation's ten largest metropolitan areas suggests that broader interstate averages increasingly mask diverging local realities. Several metros are attracting residents through interstate domestic migration even when their states as a whole are experiencing little or no net migration growth.
Phoenix (+0.3%), for example, stood out as the nation's top-performing large metro in 2025, despite Arizona's absence from the list of leading migration destinations – with the majority of its inflow coming from out of state.
Dallas (+0.2%) ranked second, continuing its rebound from -0.1% in 2023 even as Texas' statewide migration gains cooled. Like Phoenix, Dallas drew a majority of its new residents from outside the state, underscoring its growing appeal as a national migration destination. Houston, meanwhile, moved in the opposite direction, falling from 0.1% net in-migration in 2023 to -0.1% in 2025. While it is too early to call this a sustained reversal, the divergence between the two metros may reflect Dallas's growing pull as a corporate magnet alongside rising housing costs and weather-related challenges in Houston.
Metro-level data also suggests that the pandemic-era "big-city exodus" narrative is continuing to fade. Los Angeles improved from -0.8% in 2023 to -0.3% in 2025, while New York held steady at -0.3% after improving in 2024. Even Miami (-0.6%), which ranked last among major metros despite Florida's continued statewide gains, saw its outflows moderate from 2023 levels. And while Illinois continued to post net outmigration, Chicago (0.0%) reached migration neutrality in 2025 after recording losses in both 2023 and 2024.
Major Insights:
Phoenix was the nation's top large-metro migration destination in 2025.
Dallas gained momentum while Houston lost ground, highlighting growing divergence within Texas.
Miami continued to post the largest outflows among major metros despite Florida's broader migration success.
The LosAngeles, Chicago, and the New York metro areas all saw migration losses ease.
Florida Dominates Large Metros
Despite Miami's struggles – and Florida’s relatively modest 0.2% inflow – a look beyond the top 10 large metros reveals that the Sunshine State is home to six of the nation's eight fastest-growing large metros nationwide.
Those top-performing metros, defined as CBSAs with 500K+ residents that added at least 0.8% of their population through net domestic migration over the past year, share a similar profile: lower housing costs, retiree appeal, suburban density, and an easy drive to a larger economic hub.
Much of the growth of these Florida metro areas, however, is being fueled from within Florida itself. While major out-of-state metros such as New York (6.1%) and Chicago (2.0%) remained important sources of new residents, nearly half of the net migration into Florida's top destination metros came from elsewhere in the state. In 2025, Miami (22.5%), Orlando (13.0%), Tampa (5.8%), and Naples (4.2%) together accounted for 45.5% of the net positive migration feeding these fast-growing markets.
Major Insights:
Mid-sized Florida metros dominate the national migration leaderboard.
Florida's migration pipeline is overwhelmingly driven by in-state movement.
The Affordability Factor
The migration flows feeding the nation’s fastest-growing large metros suggest that affordability remains a powerful driver of domestic relocation.
In 2025, seven of the eight top destination metros analyzed above had lower typical home values than their largest feeder markets. Lakeland–Winter Haven, FL, for example, had a typical home value of $313.4K in December 2024, compared with $404.9K in Orlando and $380.2K in Tampa – its two largest sources of net migration. Even North Port–Bradenton–Sarasota, FL – the most expensive Florida metro in this group – drew its largest share of net migration from the New York metro area, where home values are substantially higher.
The lone exception was Charleston–North Charleston, SC, whose largest source of net migration was Baltimore – a market with lower typical home values than the destination. Even in Charleston, however, affordability appears to have played a role. New York, a significantly more expensive market, ranked a close second in 2025, accounting for 6.5% of net positive migration into Charleston, just behind Baltimore’s 6.8%.
While housing costs are only one factor influencing migration decisions, the data suggests that households continue to gravitate toward markets where homeownership is comparatively more attainable than in the places they leave behind.
Most Top Migration Destinations Pull Residents From More Expensive Housing Markets
Typical Home Values* in Top Feeder Markets to Destination Hubs, 2025
Destination HubTop Feeder Market
*Typical home value based on Zillow Research’s Zillow Home Value Index (ZHVI) for Dec. 2024, immediately preceding the analyzed migration period (Jan.–Dec. 2025).
Share
Embed:
Major Insights:
Most high-growth metros attract residents from more expensive housing markets.
Relative affordability continues to be a primary driver of domestic migration.
Demographics Over Dollars
But as important as affordability is in explaining today’s domestic migration patterns, age appears to be an even stronger determinant of where people choose to relocate.
Among mid-sized and large metros (250K+ residents) experiencing significant population shifts – defined as gaining or losing at least 1.0% of their starting population through domestic migration over the past two years – households are increasingly moving toward older, more established communities.
The data reveals a clear negative relationship between migration performance and age differential – a metric calculated by subtracting the median age of the destination market from the weighted median age of its feeder markets. Negative values indicate movement toward older communities, while positive values indicate movement toward younger ones. In other words, the metros attracting the strongest migration inflows tend to be older than the markets sending them residents.
The data also shows a clear positive relationship between migration performance and retiree concentration. Metros with larger shares of residents aged 65 and older generally saw stronger migration gains over the past two years, while younger metros tended to attract fewer newcomers. This suggests that retiree-driven relocation has become an increasingly important driver of migration. At the same time, the influx of younger residents points to the broader appeal of these communities, which offer a mix of affordability, amenities, and lifestyle advantages.
Relocators are Gravitating Towards Older, More Established Communities – With Retirees Helping Fuel the Trend
Net Migration as Share of Starting Population, 2024–2025*
Net Migration vs. Weighted Age Differential
Net Migration vs. Share of Residents 65+
*Analysis includes metro areas with 250K+ residents and domestic migration gains or losses of at least 1.0% during the study period. Weighted Age Differential compares the destination market’s median age with the weighted median age of origin markets, with positive values indicating migration toward younger markets and negative values indicating migration toward older markets. Age data: Census ACS 2020–2024.
Share
Embed:
Major Insights:
People are moving to older, more established communities.
Markets with larger 65+ populations are attracting more domestic relocators.
The New Migration Map: Strategic Implications
The pandemic-era urban exodus is giving way to a more nuanced migration landscape. Large urban markets are stabilizing, while growth is increasingly concentrated in smaller states, secondary metros, and intra-state corridors. Affordability remains a powerful pull, but retirees, lifestyle considerations, and local market dynamics are also playing an increasingly important role in where Americans choose to live.
To capitalize on these shifts in 2026, civic leaders, commercial real estate (CRE) investors, retailers, and developers should:
Monitor smaller states gaining migration momentum. Among the nation's most populous states, only Florida saw (modest) net in-migration in 2025. By contrast, smaller states like South Carolina, Delaware, Idaho, Maine, Tennessee, and North Carolina continued to attract substantial inflow. Investors, retailers, and developers that monitor these patterns may be better positioned to identify emerging growth opportunities.
Invest ahead of growth. Vermont's reversal shows how important it is for housing supply and infrastructure to keep pace with demand. High-growth communities will also need the retail, healthcare, transportation, and service capacity required to support expanding populations.
Look beyond state-level narratives that can obscure local opportunities. Florida led the nation in fast-growing large metros even as Miami lost residents, while Texas saw Dallas gain momentum as Houston fell behind. Likewise, although Arizona was not a top destination state, Phoenix remained the nation's leading major metro for migration gains.
Treat states as migration ecosystems. In Florida, for example, domestic migration is increasingly redistributed across a network of interconnected metros – as costs rise in one market, residents shift to nearby alternatives. Tracking these spillover effects can help identify tomorrow's growth markets before they show up in the rankings.
Don't write off major urban markets. While New York, Los Angeles, and Miami continue to experience net outflows – and Chicago has yet to return to positive territory – migration losses have moderated substantially from their pandemic-era peaks. As these markets stabilize, investments in livability, affordability, and quality of life could help strengthen their long-term competitiveness and economic vitality.
Protect affordability as a competitive advantage. Across the nation's fastest-growing metros, migration flows continue to move from more expensive housing markets to less expensive ones. As demand rises, preserving attainable housing will be critical to maintaining the cost advantages that attract new residents and businesses.
Prepare for a retiree-driven demographic realignment. Older Americans are playing an outsized role in shaping domestic migration patterns, but the communities attracting them are increasingly appealing to a broader range of households as well. As these markets grow, demand is likely to increase for healthcare, recreation, hospitality, and housing, creating opportunities across a wide range of sectors.
Explore key signals guiding data-driven site selection from brands actively expanding their brick-and-mortar footprints.
May 21, 2026
Predicting The Next Best Location
Across segments, retail and dining expansions converge on a common set of priorities, including identifying markets with strong demand, ensuring alignment with target audiences, and leveraging local consumer behavior to drive synergy. Using AI-powered location intelligence, we analyzed five expanding brands and segments to uncover the core principles driving successful site selection.
1. Identifying Sustainable Growth in an Increasingly Saturated Market
Nationwide visits to coffee chains are up in 2026, with established brands and newcomers alike seeing their traffic increase as consumer headwinds lead some to shift their discretionary spend towards more affordable indulgences. But past visit growth does not necessarily indicate future opportunity – it may instead signal market saturation. Relying solely on overall visit trends to guide expansion could lead chains into highly competitive markets where existing supply already meets demand.
For example, analyzing traffic trends in 10 major metro areas where coffee visits increased year-over-year (YoY) in Q1 2026 reveals significant gaps between overall traffic trends and per-location demand. In some CBSAs, overall traffic growth significantly outpaced per-location traffic trends – suggesting that supply is already meeting (or exceeding) demand and limiting room for new coffee locations despite overall category growth. But in other metro areas, where overall visit growth appears smaller, per-location traffic is actually booming – indicating that the underlying demand is resilient enough to support additional coffee concepts.
These patterns highlight the importance of looking beyond topline growth to identify where true whitespace still exists.
Strategic Takeaways:
Relying solely on aggregate category performance can obscure regional white space. A market-level view may reveal opportunities for stronger returns in areas where consumer demand is gaining momentum.
Combining overall visit and visits per location data offers a more complete view of where demand is both strong and sustainable.
2. Ensuring Demographic Alignment on the Hyperlocal Level
Effective site selection matches both regional and local demographics to a brand’s target customer, supporting performance and reinforcing positioning. But even in well-aligned metros, results depend on site-level precision – locations where the trade area visitor profile most closely reflects the brand’s core audience are best positioned to drive incremental upside.
An analysis of Alo locations in the DC area suggests that the company is adopting this strategy. Within the already high-income metro area of Washington-Arlington-Alexandria, individual Alo Yoga stores are placed in centers that draw even more affluent visitors – maximizing the revenue potential of each location.
In fact, Alo's newest stores in the metro area – One Loudoun and Bethesda Row – drive traffic from households with higher median incomes than even the established area locations. This signals a clear focus on premium retail corridors and affluent consumer segments, which reinforces the brand’s positioning while capturing higher-spending customers at the site level.
Strategic Takeaways:
Beyond traffic potential, effective site selection requires a clear understanding of both regional and hyperlocal demographics, as well as the brand’s target audience.
As brands expand, aligning locations with core customer bases can drive success while reinforcing brand positioning.
3. Finding Retail Nodes With Complementary Visitation Patterns
Beyond driving traffic potential and demographic alignment, site selection should also ensure that a brand’s identity and operating model are well matched to the visitation patterns of prospective locations. Barnes & Noble offers a clear example. The company’s ongoing resurgence has relied in part on repositioning itself as a local cultural and social hub, with a stronger emphasis on local curation and community-driven events.
And analyzing Barnes & Noble’s 2026 openings shows a clear tilt toward centers with a higher share of local traffic than the chain average – supporting its shift away from a purely transactional retail model toward a more community-centric experience built around local curation, events, and repeat visitation. By prioritizing locally driven centers, the company’s site selection strategy not only captures relevant traffic but also reinforces its broader repositioning as a neighborhood-oriented brand.
Strategic Takeaways:
Site selection strategy should look to align a brand’s identity and operating model with real-world visitation patterns at prospective locations.
For brands leaning into local curation, choosing centers with predominantly nearby visitors may be the key to performance and preserving brand identity.
4. Understanding the Benefits of Competitor Proximity
Effective site selection recognizes that proximity to competitors can function as a demand driver, amplifying traffic rather than diluting it.
In practice, this often takes the form of clustering – deliberately locating near similar or complementary concepts to capture shared demand. Shake Shack provides a clear example. Analyzing the chain's store fleet shows that many locations sit near other QSR and fast-casual concepts, creating opportunities to capture dining-based traffic. At the same time, strong cross-visitation patterns indicate that these co-located brands share a common customer base, positioning the brand closer to consumers who are already likely to visit. And, at least for Shake Shack, this strategy appears to be working – traffic to the chain increased 19.9% YoY in Q1 2026.
Strategic Takeaways:
As in retail, co-tenancy in the restaurant space can be mutually beneficial – establishing a center as a dining destination, driving incremental traffic, and increasing a brand’s opportunities to win share-of-stomach.
Incorporating cross-visitation analysis into site selection helps pinpoint locations where target customers are already visiting nearby brands. Centers that already attract a brand’s overlapping customer base provide a stronger foundation for incremental growth.
5. Balancing Growth and Cannibalization Risk
Incorporating trade area analysis into site selection can also help determine whether a new location will generate new traffic or risk cannibalizing existing demand. Aldi, a rapidly expanding grocery chain, offers a relevant example.
The company opened a fourth Las Vegas store on S Decatur Blvd in October 2025, positioned between existing locations on W Craig Rd and S Rainbow Blvd, approximately eight miles from each. And analyzing the core trade area of each of the four Las Vegas locations indicated limited visitor cannibalization over the last six months, despite the stores’ close proximity. Only 6.2% and 7.6% of the S Decatur Blvd store’s trade area overlapped with the W Craig Rd and S Rainbow Blvd stores’ trade areas, respectively.
These findings show that there is no one-size-fits-all approach to store spacing – it varies by brand, category, and market. Analyzing a company’s existing store network alongside competitor density and overall demand can help determine how closely locations can be placed without hurting performance. In many cases – especially in high-frequency categories like grocery – markets can support stores that are closer together than expected.
Strategic Takeaways:
Site selection strategy needs to take into account local demand and visitation behavior typical of the category as a whole and of existing locations in particular.
Trade area analysis can reveal where a market allows for network densification without significant risk of visit cannibalization.


.svg)


.avif)
.avif)
.avif)

.avif)
.png)

.png)
%20(1).png)
.png)

.png)
.avif)
.png)


.avif)
.png)
.png)
.png)
.avif)
.avif)


