Now that we’ve cleared the halfway point for 2024 with retailers preparing for back-to-school shopping (and Q2 2024 reporting season), we thought we’d take stock of where we stand from a retail category perspective. Last year, we looked at visit per location data by retail category at the halfway point for the year, which proved to be a useful indicator for what to expect for the rest of the year. We thought we’d revisit the analysis to give some perspective of what to expect in the months to come.
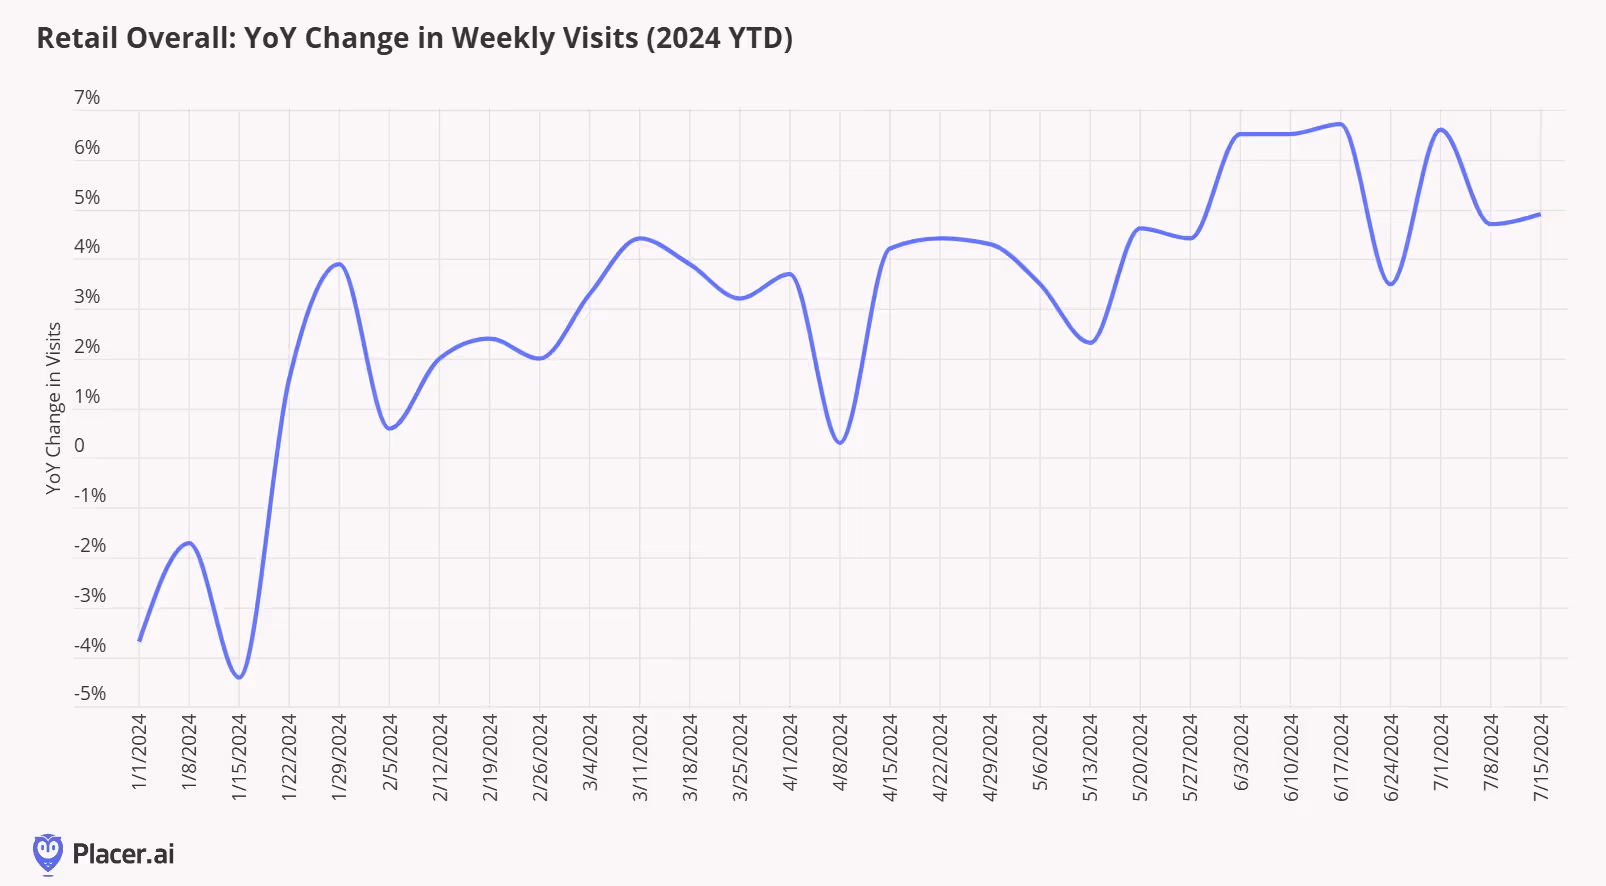
Needless to say, it’s been another volatile year for most retailers, with a tepid start to the year due to weather, followed by solid event/holiday spending in February/March, and a lackluster April (though partly the result of the Easter holiday calendar shift). May, June, and July visitation data offered some encouraging signs, with year-over-year visits increasing to a mid-single-digit level (according to Placer's Industry Trends report). Importantly, increased visits won’t necessarily translate into the same level of sales increases, as visits are continuously being driven by deals/lower price points for many categories.
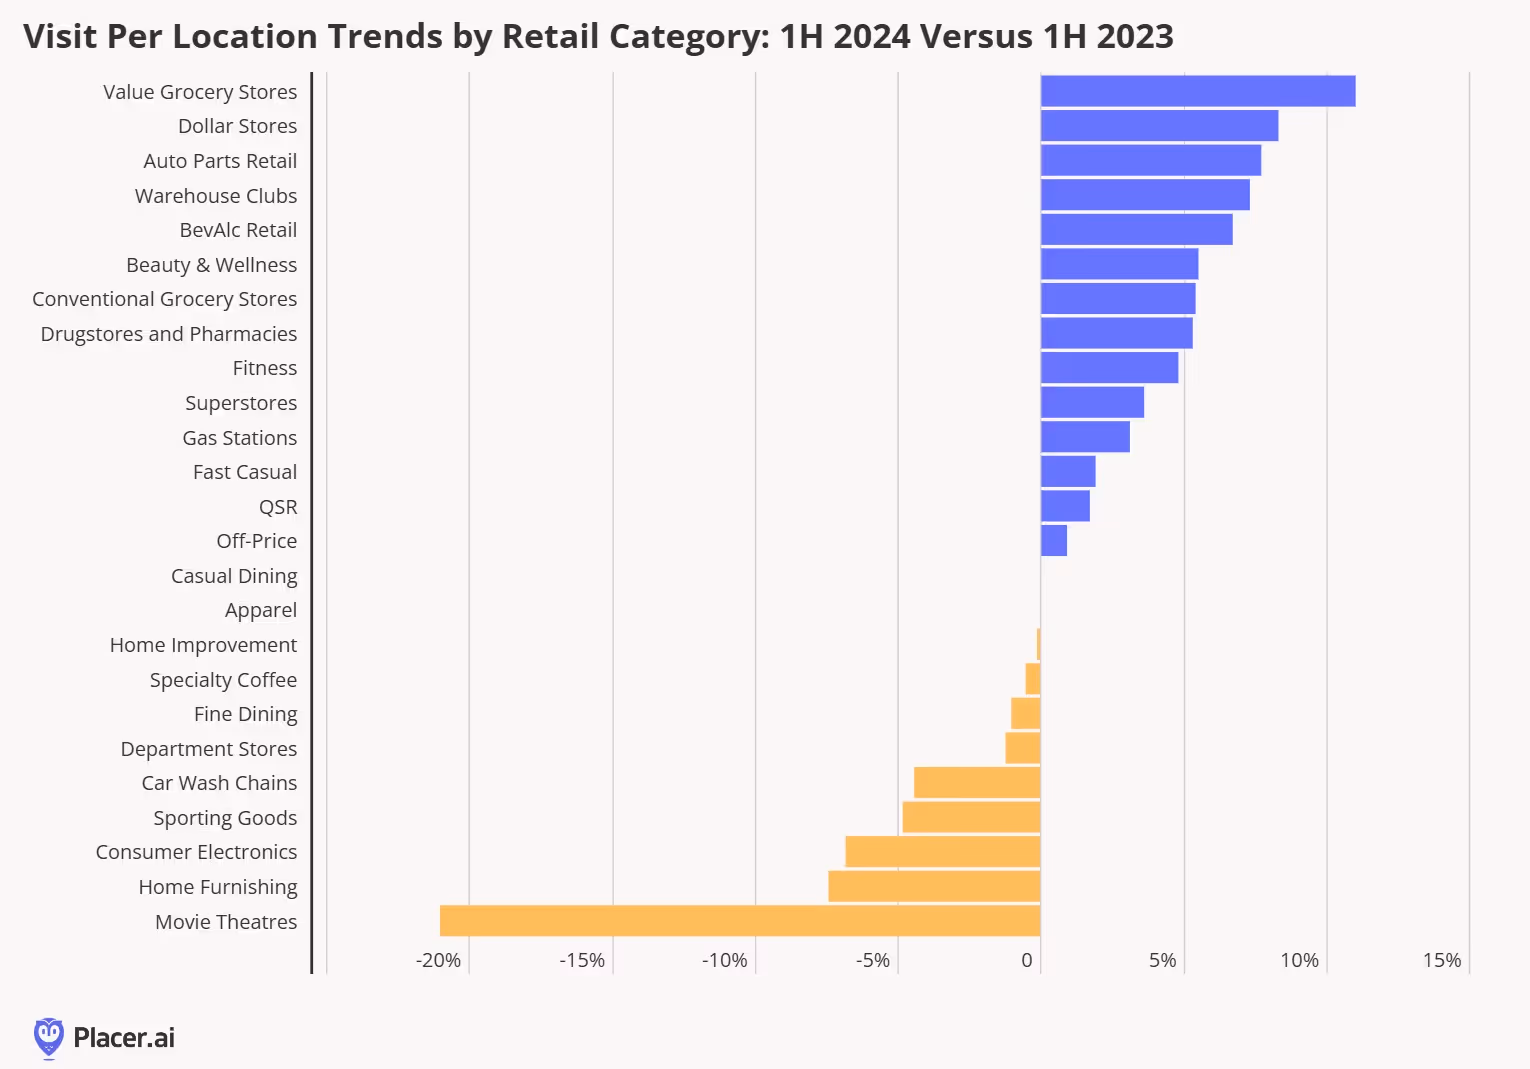
Based on the positive trendline for retail in general, it shouldn’t be a surprise that the majority of the 25 retail categories we’ve presented show positive growth from a visit per location year-over-year perspective (below).
A few notable takeaways from the visit per location analysis:
Value grocery chains saw the largest increase in visit per location during the first half of the year, up 11% year-over-year. We’ve spoken at length about consumers’ focuson value this year–even as food-at-home prices have moderated–so it should not be a surprise to see this category seeing the most visits per location. Both Aldi and Trader Joe’s have been key contributors to the increase in visits per location.
Auto parts retail was one of the leading categories with respect to visits per location during the first half of 2024, but these trends may be moderating as we discuss below.
Like many of the categories seeing visit per location growth, consumers continue to seek out warehouse clubs for value. We also believe that visits from younger trade areas have contributed to the increase in warehouse club visits per location, which we recently analyzed.
There were mixed results across the restaurant category, with fast casual and QSR seeing year-over-year gains in visits per location, casual dining running about even to a year ago, and specialty coffee and fine dining seeing year-over-year declines. The QSR and fast casual gains largely reflect consumer’s focus on value, although the visit per location gains started to slow from March-May amid more competitive pricing from grocery stores, c-stores, and casual dining. However, with the rise of $5 bundled meals across the QSR category, we’ve seen visit per location trends rebound a bit in June (and into July). Specialty coffee is down year-over-year but is largely the result of fewer visits from “occasional” Starbucks visitors (which have overshadowed the nice gains we’ve seen from many drive-thru coffee chains this year). Fine dining is down year-over-year, but we continue to see visit per location gains for major holidays and events.
The decline in movie theaters is not surprising given the lack of tentpole releases this year. However, these trends should improve amid a stronger release schedule.
Last year, our midpoint visit per location trends gave us some ideas as to how the second half of the year might shake out. Based on our first half 2024 visitation data, we expect (1) consumers to continue prioritize value in the second half of the year, especially those chains that have been able to create excitement/newness for their value assortment; (2) consumers will continue to prioritize holidays/events, which bodes well for back-to-school, Halloween, Thanksgiving, and Christmas; (3) we will continue to see better balance between experiences and goods this year (as we've discussed in the past).
Retailer summer deals are in full swing, with promotional events like Amazon Prime Day and Nordstrom Anniversary Sale, Target Circle Week, and Macy’s All Star Week taking place over the past two weeks. The summer has come to signify the first large scale, cross-industry retailer push to engage with consumers and also test new promotional strategies with shoppers.
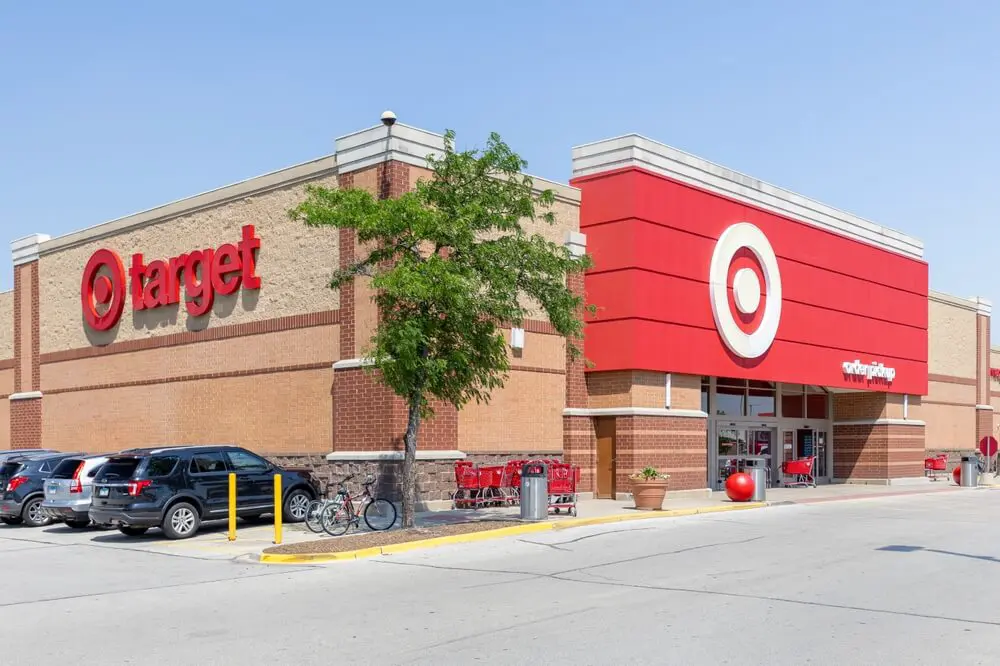
Target’s reinvigoration of its loyalty program, Target Circle, launched in April as a streamlined program with more perceived value for members and created a new paid tier called Target Circle 360. Target Circle Week, which took place between July 7-13, focused more on loyalty program members than previous iterations of the event to drive visits by loyal shoppers. The retailer promoted items across discretionary and essential categories, an effort meant to offset the challenges in the discretionary side of the business this year. Mass merchants have been especially challenged compared to warehouse clubs in the superstore category, and Circle Week, especially as the first event of the retailer's summer deals, is a barometer of what’s to come.
According to our foot traffic measurements, Target Circle Week was successful in driving incremental traffic growth, resulting in the highest percentage of growth in visits so far in 2024 on a year-over-five-year basis.
Circle Week also saw a slightly higher dwell time, with visitors spending an average of 29 minutes in store, about a minute higher than 2024 year to date. The week performed well in visits exceeding 45 minutes compared to the year-to-date percentage of visits, which could signal that shoppers coming in for deals spend longer browsing and purchasing. There was also a higher percentage of weekday visits during Circle Week compared to 2024 overall, a promising sign for the week-long event.
Looking specifically at individual store locations that over performed during Circle Week, one that stood out is Target’s original large format store location in Katy, TX. This location opened in fall 2022 to much fanfare; it features a larger curbside pick-up area, multiple shop-in-shop concepts, and a larger grocery footprint. Traffic to the Katy location also increased the most in the week of July 8-14, but it far exceeded the total traffic growth to Target, with visits up almost 55% compared to the same week in 2023, when Target’s event ran last year. Circle Week also kept visitors in store longer at the Katy location, with dwell times increasing by 2 minutes on average compared to 2024 year-to-date.
With the success of this event in bringing in visitors, it will be interesting to see how Target tries to maintain the momentum through the back half of the year. With the announcement of price cuts and a renewed focus on providing as much value as possible to consumers, the enhanced Target Circle program appears to be bolstering those initiatives. As we get further away from the other retailer deal day events as well, we will be able to fully examine the effectiveness of this year’s summer promotional period and also provide more observations as we approach the holiday season.
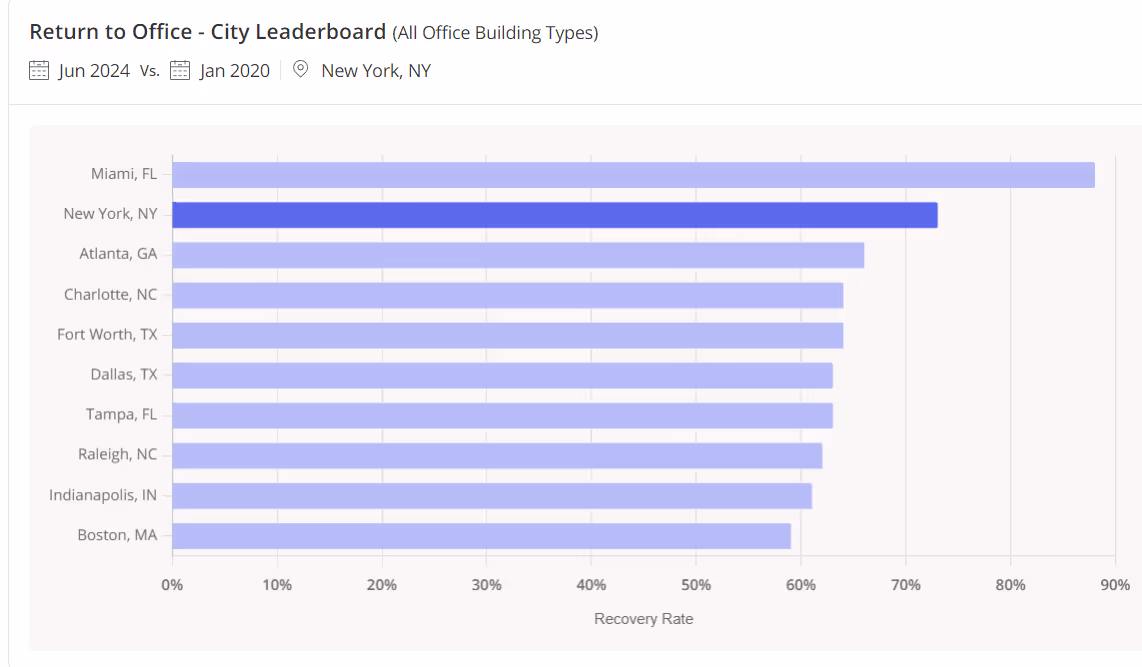
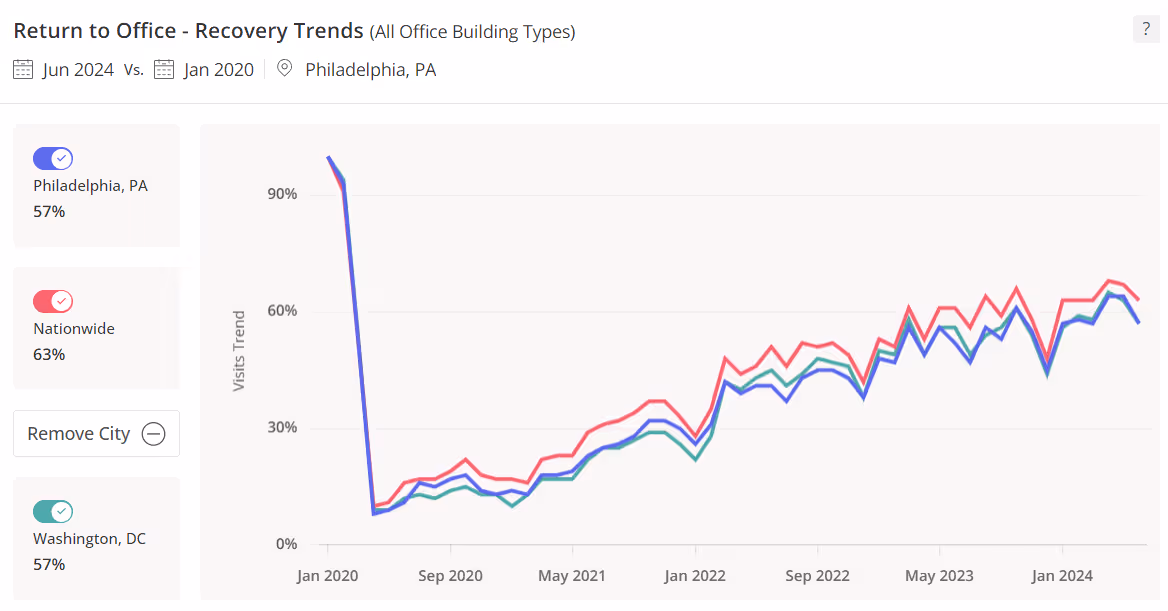
Using Placer's Return to Office report, we see that Miami continues to be the champion when it comes to returning to office. With a whopping 88% recovery rate, it is heads above the other cities, with NYC coming in at 73% for the month of June. Rounding out the top 5 recoveries are Southern cities like Atlanta (66%), Charlotte (64%), and Forth Worth (64%). These cities are all above the nationwide average for return-to-office, which is 63%.
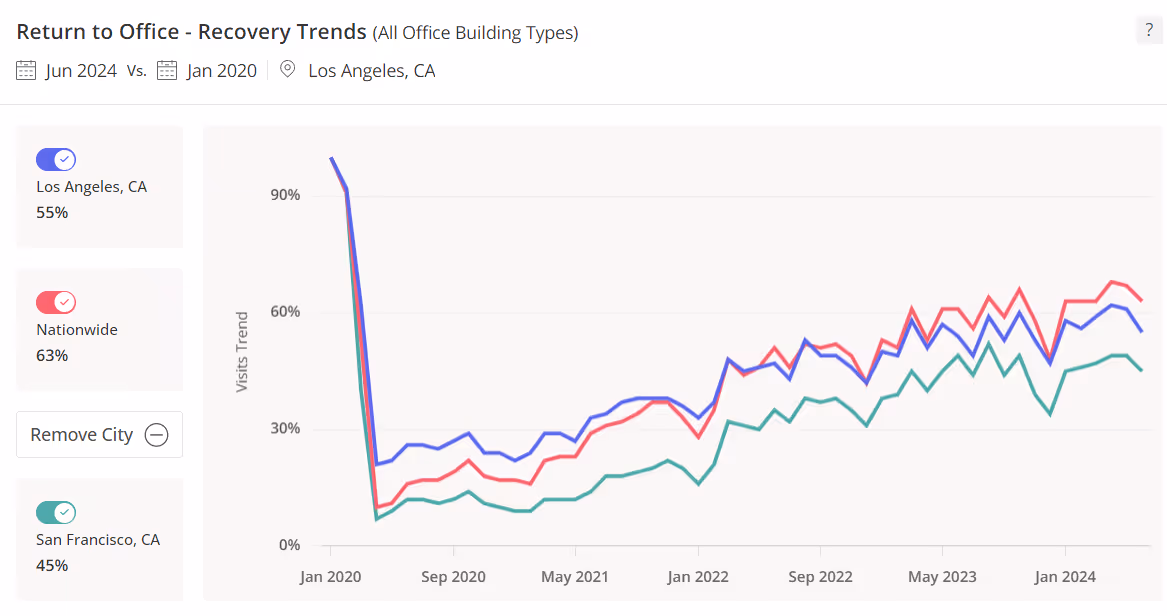
By contrast, two of the major West Coast cities--San Francisco and Los Angeles lag below the nationwide return rate at 45% and 55%, respectively.
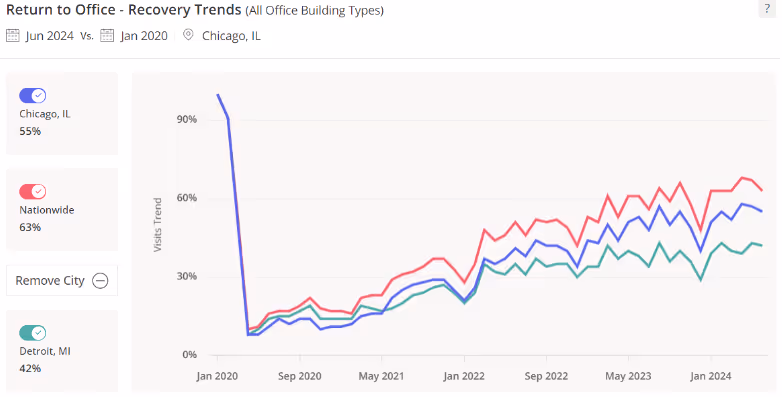
Other major cities in the Midwest, like Chicago and Detroit, are seeing similar rates of lagging return-to-office. In Chicago, 55% have returned compared to Jan 2020 and in Detroit, only 42%.
Moving over to the East Coast, Philadelphia and Washington DC--both at 57% RTO--are also below the nationwide average.
The good news for offices is that taken as a whole, we are seeing upward trends in employees returning to office, albeit perhaps slower than those in commercial real estate or the C-suite would like.
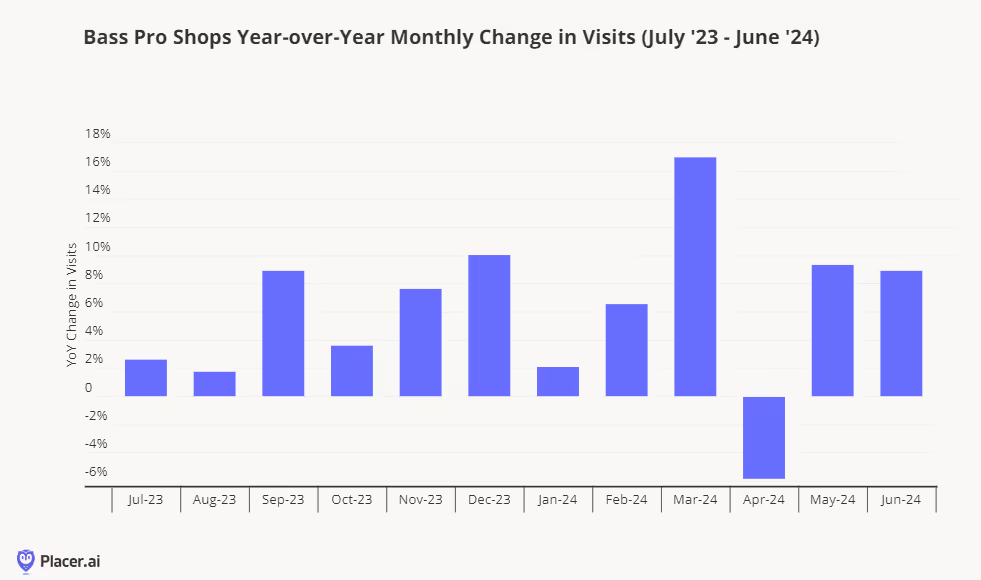
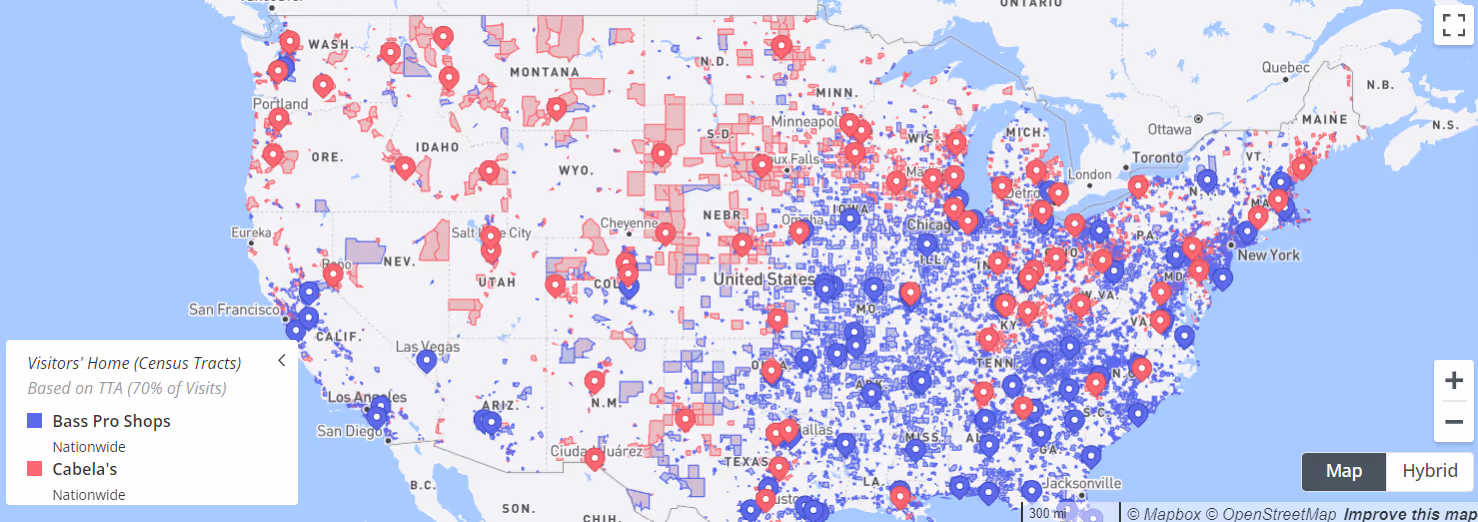
It’s often a good sign when Placer data reflects positive year-over-year growth and in the case of Bass Pro Shops, that’s exactly what we’re seeing for the months of June 2023-June 2024 (note April is down, but that is partially due to last year’s April having five weekends instead of four).
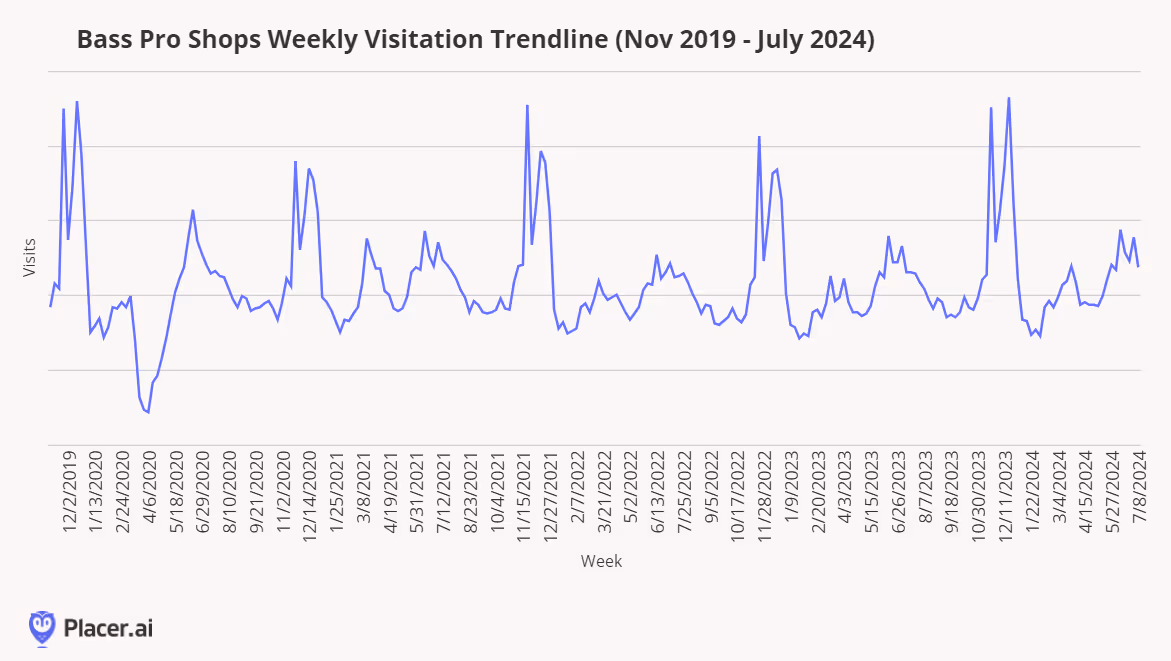
Bass Pro Shops skipped a slight beat immediately after COVID in spring 2020, but by early summer had already regained its store traffic as everyone took to the great outdoors in their quest for social distancing. Ever since, it’s been business as usual with similar peaks around Black Friday weekend and the week before Christmas.
Bass Pro Shop’s footprint is particularly strong in the eastern half of the US. They acquired Cabela’s a few years back and maintained the separate brands. This acquisition gave them an additional presence in the Pacific Northwest and Mountain states.
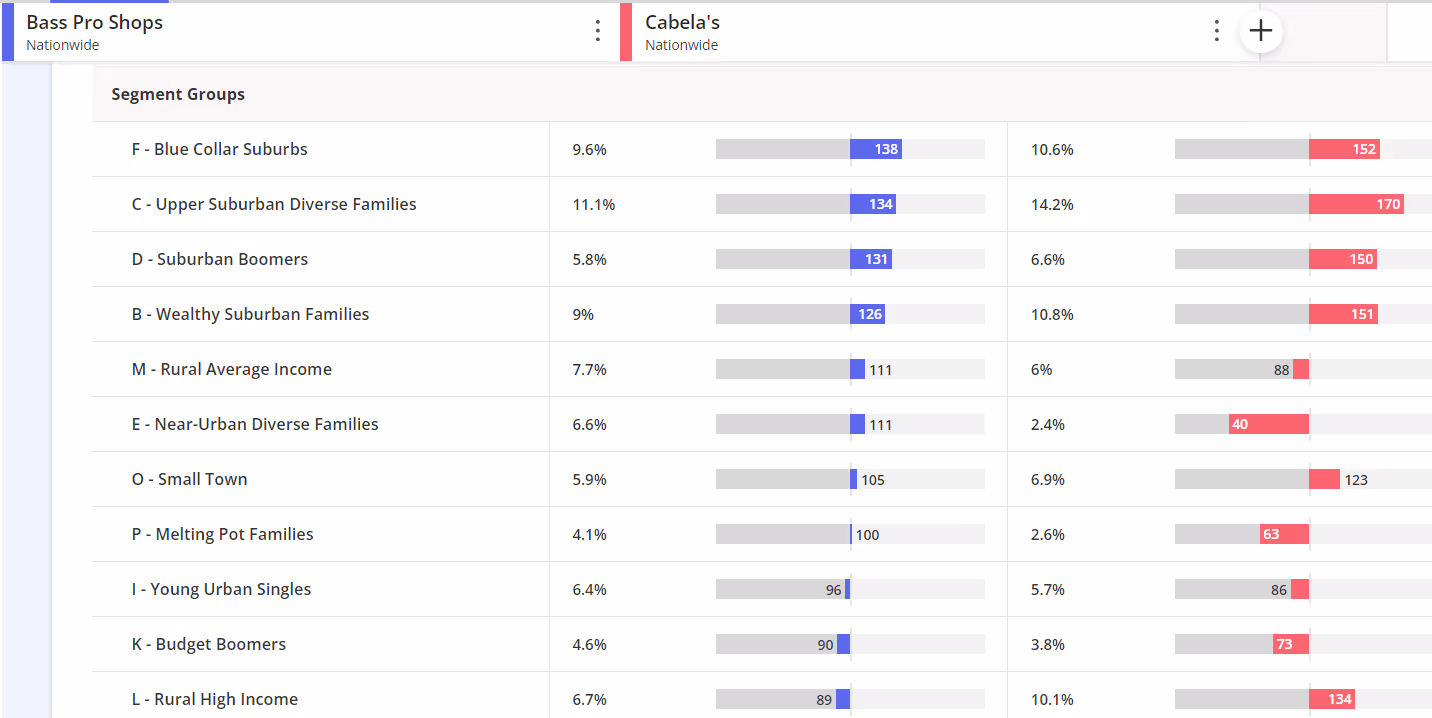
Both brands over index for the segments Blue Collar Suburbs, Upper Suburban Diverse Families, Suburban Boomers, and Wealthy Suburban Families per Spatial.ai’s PersonaLive. Small Town and Rural High Income also over index at Cabela’s.
How are RBI and Yum! Brands leading chains faring at the year’s midway point? We dove into the data to find out.
Ezra Carmel & Addison Southerland
Jul 25, 2024
3 minutes
RBI and Yum! Brands hold some of America’s favorite restaurants in their portfolios. How are these parent companies and their leading chains faring at the year’s midway point? We dove into the data to find out.
Key Takeaways
In Q2 2024, ongoing expansion helped to drive RBI’s 1.7% year-over-year (YoY) visit increase and a 2.2% YoY rise in visits per location.
RBI’s visit leader – Burger King – experienced 4.3% visit-per-location growth in Q2 2024, highlighting the success of the restaurant’s rightsizing strategy.
Visits to Taco Bell – which accounted for 70.5% of visits to Yum! Brands in Q2 2024 – increased 5.0% YoY during the quarter.
Taco Bell’s recent “Taco Tuesday” promotions gave significant foot traffic boosts to the chain, positively affecting Tuesday visitation even after the promotions ended.
RBI’s Expansions Fuel a Strong Q2
RBI shined in Q2 2024 – seeing a 1.7% increase in visits and a 2.2% increase in visits per location, YoY – due partly to expanding footprints across several of its brands.
Firehouse, Popeyes, and Tim Hortons’ growth likely played a part in overall visit gains to each chain during the quarter. And though Popeyes and Tim Hortons saw minor visit-per-location gaps emerge as the chains added new locations, the fact that this metric remained nearly on par with last year’s levels shows that the chains’ expansions are not diluting existing demand. Both Popeyes and Tim Hortons are likely to see YoY visits per location pick up as each of their new restaurants gains momentum.
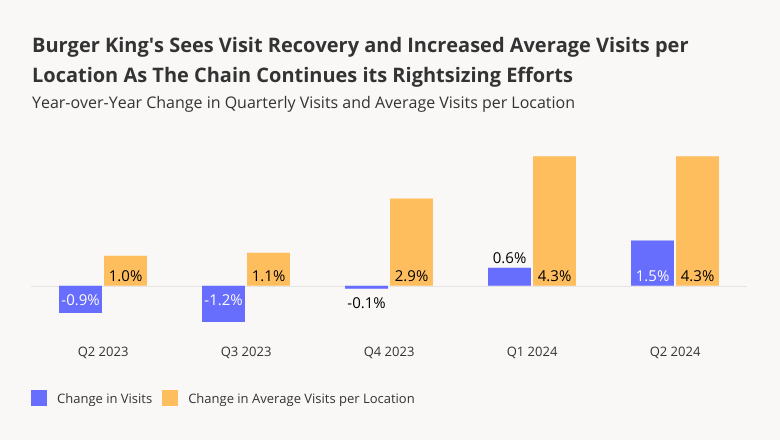
Burger King Sees Rightsizing Efforts Pay Off
Accounting for 69.3% of visits to RBI in Q2 2024, Burger King’s positive foot traffic during the period had a significant impact on its parent company’s success.
RBI management cited equipment upgrades, remodels and advertising as recent drivers of visit growth for Burger King – which despite the shuttering of dozens of underperforming restaurants over the past year, saw a 1.5% chain-wide YoY visit increase in Q2 2024.
And analyzing visit-per-location trends at Burger King shows that the chain’s rightsizing strategy is paying dividends: Since Q2 2023, YoY visits per location have been on a steady incline, closing out Q2 2024 with a 4.3% increase. This indicates that as individual Burger King locations have shut their doors, the remaining restaurants have gotten even busier.
Yum! Growth: Follow the Taco
Taco Bell, which accounted for 70.5% of visits to Yum! Brands' restaurants in Q2 2024, drove visits to Yum! in much the same way that Burger King gave a boost to RBI. During the quarter, visits to Taco Bell increased 5.0% YoY while visits per location rose 3.5%. And the taco chain propelled foot traffic growth for Yum! Brands as a whole – with YoY visits and visits per location up a respective 3.1% and 3.5% in Q2 2024.
Taco Bell Innovation and Promotions Helping to Provide a Boost
Taco Bell is the leader in Yum! Brands’ portfolio for good reason. The chain is well-known as one of the world’s most innovative companies. And the taco leader appears to have done it again with “Taco Tuesday” specials. On the Tuesdays of March 26th, April 9th, and April 16th, 2024 the chain offered select menu-favorites for $1 for one hour. This promotion led into a separate $5 Dollar Taco Discovery Box deal, which was available on “Taco Tuesdays” between April 23rd and June 4th, 2024.
The data suggests that both of these promotions drove substantial foot traffic. Beginning on March 26th, Tuesday visits to Taco Bell rose significantly compared to the H1 2024 Tuesday average. And even after the promotions ended, “Taco Tuesdays” retained their draw – perhaps aided by the subsequent launch of a summer menu and the company’s formal entrance into the value meal wars with its much-vaunted Luxe Craving’s Box.
RBI and Yum! On a Run
Led by their flagship restaurants, RBI and Yum! Brands appear to be on the right track. The strategic expansion of certain chains and the rightsizing of others has paid off in visit growth for RBI, while Yum! continues to strike it big with Taco Bell’s winning promotions.
We dove into the data to see how coffee leaders Starbucks, Dunkin', and Dutch Bros. fared in Q2 2024.
Ezra Carmel & Noam Maman
Jul 24, 2024
4 minutes
We dove into the latest data for java leaders Starbucks, Dutch Bros., and Dunkin’ – to discover how each brand drove visits in Q2 2024 and explore coffee consumer visit patterns heading into the summer.
Key Takeaways:
Since the week of May 6th, Starbucks’ summer promotions have driven consistent weekly year-over-year (YoY) visit increases, putting the chain's overall YoY foot traffic gains at 2.3% in Q2 2024.
Also in Q2 2024, visits to Dutch Bros. increased 15.0% YoY, partly due to an expanding footprint. The brand also sustained YoY visit-per-location gains for most of H1, highlighting strong demand for the chain as it grows.
Dunkin’s National Donut Day promotion on June 7th, 2024 proved to be a critical retail moment that sparked consecutive weeks of YoY foot traffic growth for the coffee leader.
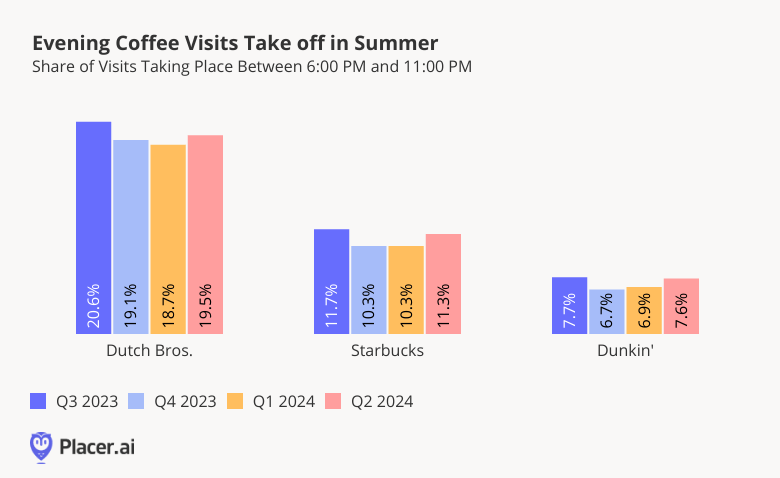
All three coffee chains experience significant evening foot traffic upticks during the summer – positioning them for more evening visits as the summer gets into full swing.
Starbucks’ Promotions Provide Stable Visit Growth
Starbucks has been finding foot traffic success this summer with promotions that seem to be resonating with consumers. In May 2024, the chain launched 50% Off Fridays (beginning May 10th), special Monday Deal Drops (beginning May 13th), and limited-time only summer drinks. And in June, Starbucks’ promotions continued with a new Pairings Menu and a round of handcrafted iced beverages.
Since the week of May 6th, 2024, weekly traffic to Starbucks has been consistently elevated YoY – with visits up 2.3% YoY for Q2 2024 as a whole – indicating that Starbucks’ array of summer promotions are shoring up traffic to the chain.
Dutch Bros. Leans Into Expansion
Like Starbucks, Dutch Bros. ushered in the warm season with a special line-up of summer drinks in May 2024. But even before the launch of these seasonal promotions, the coffee powerhouse has been driving visits.
In Q2 2024, Dutch Bros.’ visits increased 15.0% YoY amidst ongoing fleet expansion. And throughout H1 2024, monthly visits-per-location increased YoY nearly across the board – surpassing the wider category average – indicating that Dutch Bros.’ growth is meeting robust demand.
In June 2024, Dutch Bros. saw 5.7% YoY visit-per-location growth, the chain’s largest increase of the year so far. With more planned expansions, an additional promotional drink release in July, and continued steps to advance mobile ordering and its rewards program, Dutch Bros. appears poised to drive growth in the back half of 2024 as well.
Dunkin’ Drives Foot Traffic With National Donut Day
Indeed, National Donut Day seems to have kickstarted Dunkin’s busy summer. Following several weeks of flagging YoY visit performance in May – likely attributable in part to the chain’s strong May 2023 performance – Dunkin’ saw a YoY visit boost of 4.5% during the week of June 3rd, 2024. And subsequent weeks have seen a continuation of this positive momentum, as the chain continues to promote its summer fare.
Summer Nights Drive Visits to Coffee Chains
Starbucks, Dutch Bros., and Dunkin’ each do summer in their own way. But one thing all three chains have in common is an increase in evening visits during the summer months.
In Q3 2023, including the peak summer months of July and August, all three chains experienced significant upticks in evening visits (between 6:00 and 11:00 PM). During the winter months – Q4 2023 and Q1 2024 – the share of visits taking place in the evenings dropped for all three chains, before picking up again in Q2 2024.
A variety of factors may be behind this summer shift in coffee consumption. Consumers may be more likely to be out socializing during lazy summer evenings – when students are off and many Americans take vacation. Extended daylight hours in summer may also entice more consumers into an extra caffeine boost later in the day.
If last year’s Q3 evening coffee visit boost is any indication, Starbucks, Dunkin’, and Dutch Bros. may all be in for evening foot traffic increases as the summer wears on.
Full Steam Ahead
How will these coffee giants stay hot during the final stretch of summer and will they maintain their momentum going forward?
Dive into the data to find out how the dining category is performing in 2025, which segments are coming out on top, and how dining consumer behavior has shifted in recent years.
June 26, 2025
10 minutes
Key Takeaways:
1. Overall dining traffic is mostly flat, but growth is concentrated in specific areas.
While nationwide dining visits were nearly unchanged in early 2025, western states like Utah, Idaho, and Nevada showed moderate growth, while states in the Midwest and South, along with Washington D.C., saw declines.
2. Fine dining and coffee chains are growing through expansion, not just busier locations.
These two segments were the only ones to see an increase in total visits, but their visits-per-location actually decreased, indicating that opening new stores is the primary driver of their growth.
3. Higher-income diners are driving the growth in resilient categories.
The segments that saw visit growth—fine dining and coffee—also attracted customers with the highest median household incomes, suggesting that affluent consumers are still spending on dining despite economic headwinds.
4. Remote work continues to reshape dining habits.
The share of suburban customers at fine dining establishments has increased since 2019, while it has decreased for coffee chains. This reflects a shift towards "destination" dining closer to home and away from commute-based coffee runs.
5. Limited-service restaurants own the weekdays; full-service restaurants win the weekend.
QSR, fast casual, and coffee chains see the majority of their traffic from Monday to Friday, whereas casual and fine dining see a significant spike in visits on weekends.
6. Each dining segment dominates a specific time of day.
Consumer visits are highly predictable by the hour: coffee leads in the early morning, fast casual peaks at lunch, casual dining takes the afternoon, fine dining owns the dinner slot, and QSR captures the late-night crowd.
Year-over-Year Dining Traffic Trends
Dining Visits Mostly Up in the West, Down in Most of Midwest and East
Overall dining visits held relatively steady in the first five months of 2025, with year-over-year (YoY) visits to the category down 0.5% for January to May 2025 compared to the same period in 2024. Most of the country saw slight declines (less than 2.0%), though some states and districts experienced larger drops: Washington, D.C, saw the largest visit gap (-3.6% YoY), followed by Kansas and North Dakota (-2.9%), Arkansas (-2.8%), Missouri and Kentucky (-2.6%), Oklahoma (-2.1%), and Louisiana (-2.0%).
Still, there were several pockets of moderate dining strength, specifically in the west of the United States. January to May 2025 dining visits in Utah, Idaho, and Nevada increased 1.8% to 2.4% YoY, while the coastal states saw traffic rise 0.6% (California) to 1.2% (Washington). Vermont also saw a slight increase in dining visits (+1.9%).
Coffee & Fine Dining See Strongest Overall Visit Growth
Diving into visit trends by dining segment shows that fine dining and coffee saw the strongest overall visit trends, with visits to the segments up 1.3% and 2.6% YoY, respectively, between January and May 2025. But visits per location trends were negative for both segments – a decline of 0.8% YoY for fine dining and 1.8% for coffee during the period – suggesting that much of the visit strength is due to expansions rather than more crowded restaurants and coffee shops.
In contrast, full-service casual dining saw overall visits decrease by 1.5%, while visits per location remained stable (+0.2%) YoY between January and May 2025. Several casual dining chains have rightsized in the past twelve months – including Red Lobster, TGI Fridays, and Outback Steakhouse – which impacted overall visit numbers. But the data seems to show that their rightsizing was effective, as the remaining locations successfully absorbed the traffic and maintained performance levels from the previous year. And the monthly data also provides much reason for optimism, with May traffic up both overall and on a visit per location basis – suggesting that the casual dining segment is well positioned for growth in the second half of 2025.
Meanwhile, QSR and fast casual chains saw similar minor visits per venue dips (-1.5% and -1.2%, respectively). At the same time, QSR also saw an overall visit dip (-0.8%) while traffic to fast casual chains increased slightly (+0.3%) – suggesting that the fast casual segment is expanding more aggressively than QSR. But the two segments decoupled somewhat in May, with overall traffic and visits per venue to fast casual chains up YoY while traffic remained flat and visits per venue fell slightly for QSR – perhaps due to the relatively greater affluence of fast casual's consumer base.
Dining Demographics
Visitor Income Levels Hold Steady in Most Segments
Analyzing the income levels of visitors to the various dining segments over time shows that each segment followed a slightly different trend – and the differences in visitor income may help explain some of the current traffic patterns.
The only three segments with YoY visit growth – casual dining, fine dining, and coffee – also had the highest captured market median household income (HHI). Although the median HHI in the captured market of upscale and fine dining chains fell after COVID, it has risen back steadily over time and now stands at $98.0K – slightly higher than the $97.1K median HHI between January to May 2019. This may explain the segment's resilience in the face of wider consumer headwinds. Meanwhile, the median HHI at fast casual and coffee chains has fallen slightly, perhaps due to aggressive expansions in the space – including Dave's Hot Chicken and Dutch Bros – which likely broadened the reach of the segments, driving visits up and trade area median HHI down.
Like fine dining, casual dining also saw its trade area median HHI increase slightly over time – but the segment has still been facing visit dips. This could mean that, even though consumers trading down to casual dining may have boosted the trade area median HHI for the segment, it still might not have been enough to make up for the customers lost to tighter budgets.
The QSR segment saw its trade area median HHI remain remarkably steady – and visits to the segment have also been quite consistent – staying between $70.6K and $70.9K between 2019 and 2025 – which may explain why the segment's visits remained relatively stable YoY.
Suburban Dining Patterns
Diving into the psychographic segmentation shows that, although the fine dining segment attracted visitors from the highest-income areas between January and May 2025, fast casual chains drew the highest share of visitors from suburban areas, followed by casual dining and coffee. QSR attracted the smallest share of suburban visitors, with just 30.5% of the category's captured market between January and May 2025 belonging to Spatial.ai: PersonaLive suburban segments.
But looking at the data since 2019 reveals small but significant changes in the shares of suburban audiences in some categories' captured markets. And although the percentage changes are slight, these represent hundreds of thousands of diners every year.
The data shows that shares of suburban segments in the captured markets of fine dining chains have increased, while their share in the captured market of coffee chains has decreased. The shares of suburban visitors to QSR, fast casual, and casual chains have remained relatively steady.
This may suggest that the COVID-19 pandemic and the subsequent rise of remote and hybrid work models are still impacting consumer dining habits, benefiting destination-worthy experiences in suburban locales such as fine dining chains while reducing the necessity of daily coffee runs that were often tied to commuting and office work. Meanwhile, the stability in QSR, fast casual, and casual dining segments could indicate that these categories continue to meet consistent suburban demand for convenience and everyday dining, largely unaffected by the redistribution seen in the fine dining and coffee sectors.
Dining Consumer Behavior Trends
Although QSR, fast casual, casual dining, fine dining, and coffee all fall under the wider dining umbrella, the data shows distinct consumer behavior patterns regarding visits to these five categories.
Limited Service Leads Weekday Visit Share, Full Service Rules the Weekend
Limited service segments, including QSR, fast casual, and coffee tend to see higher shares of visits on weekdays, while full service segments – casual dining and fine dining – receive higher shares of weekend visits. Diving deeper shows that QSR has the largest share of weekday visits, with 72.3% of traffic coming in between Monday and Friday, followed by fast casual (69.8% of visits on weekdays) and coffee (69.4% of visits on weekdays.) Looking at trends within the work week shows that QSR receives a slightly larger visit share between Monday and Thursday compared to the other limited service segments. Meanwhile, coffee seems to receive the smallest share of Friday visits – 16.3% compared to 17.0% for fast casual and 17.2% for QSR.
On the full-service side, casual dining and fine dining chains have relatively similar shares of weekend visits (39.0% and 38.8%, respectively), but fine dining also sees an uptick of visits on Fridays (with 19.1% of weekly visits) as consumers choose to start the weekend on a festive note.
Each Segment Owns a Different Daypart
Hourly visit patterns also show variability between the segments. Coffee is the unsurprising leader of early visits, with 14.6% of visits taking place before 8 AM and, almost two-thirds (64.9%) of visits taking place before 2 PM. Fast casual leads the lunch rush (29.4% of visits between 11 AM and 2 PM), casual dining chains receive the largest share of afternoon (2 PM to 5 PM) visits, and fine dining chains receive the largest share of dinner visits, with almost 70% of visits taking place between 5 PM and 11 PM. QSR leads the late night visit share – 4.1% of visits take place between 11 PM and 5 AM – followed by casual dining chains (3.2% late night and overnight visit share), likely due to the popularity of 24-hour diners.
This suggests that each dining segment effectively "owns" a different part of the day, from the morning coffee ritual and the quick lunch break to the leisurely evening meal and late-night cravings.
Shorter Visits in Most Segments
An analysis of average visit duration also reveals a small but lasting shift in post-pandemic dining behavior. Between January and May 2025, the average dwell time for nearly every dining segment was shorter than during the same period in 2019. This efficiency trend is evident across limited-service categories like QSR, fast casual, and coffee shops, suggesting a continued emphasis on speed and convenience.
The one notable exception to this trend is upscale and fine dining, where the average visit duration has actually increased compared to pre-COVID levels. This may suggest that, while visits to most segments have become more transactional, consumers are treating fine dining more as an extended, deliberate experience, reinforcing its position as a destination-worthy occasion.
Dive into the data to see how consumer response to major promotional events – from Black Friday and the back-to-school shopping rush to brand-crafted LTOs – varies by market.
June 19, 2025
Key Takeaways
1. The Midwest is the only region where Black Friday retail visits outpace Super Saturday.
But several major Midwestern markets, including Chicago and Detroit, actually see higher shopper turnout on Super Saturday.
2. Holiday season demographic shifts also vary across regions.
Nationwide, electronics stores see a slight uptick in median household income (HHI) in December – yet in certain markets, electronics retailers such as Best Buy see a drop in captured market median HHI during this period.
3. Back-to-school shopping starts earliest for clothing and office supplies retailers in the South Central region, likely tied to earlier school schedules.
But back-to-school visits surge higher for these retailers in the Northeast later in the season.
4. The share of college students among back-to-school shoppers varies by region.
In August 2024, “Collegians” made up the largest share of Target’s back-to-school shopping crowd in New England, and the smallest in the West.
5. Mother’s Day drives the biggest restaurant visit spikes in the Middle Atlantic Region, while Father’s Day sees its biggest boosts in the South Atlanticstates.
Mother’s Day diners also tend to travel farther to celebrate, suggesting an extra effort to treat mom.
6. Western states proved particularly responsive to McDonald’s recent Minecraft promotion.
During the week of A Minecraft Movie’s release, the promotion drove significantly higher visit spikes in the West than in the Eastern U.S.
Zooming in on Local Trends
Retailers rely on promotional events to fuel sales – from classics like Black Friday and back-to-school sales to unique limited-time offers (LTOs) and pop-culture collaborations. Yet consumer preferences and behavior can vary significantly by region, making it critical to tailor campaigns to local markets.
This report dives into the data to reveal how consumers in 2025 are responding to major retail promotions, exploring both broad regional trends and more localized market-level nuances. Where is Black Friday most popular, and which areas see a bigger turnout on Super Saturday? Where are restaurants most packed on Mother’s Day, and where on Father’s Day? Which region kicks off back-to-school shopping – and where are August shoppers most likely to be college students? And also – which part of the country went all out on McDonald’s recent Minecraft LTO?
Read on to find out.
The Holiday Season: A Regional Story
Promotions aimed at boosting foot traffic on key holiday season milestones like Black Friday and Super Saturday are central to retailers’ strategies across industries. The day after Thanksgiving and the Saturday before Christmas typically rank among in-store retail’s busiest days, last year generating foot traffic surges of 50.1% and 56.3%, respectively, compared to a 12-month daily average. And
But a closer look at regional data shows that these promotions land differently across the country. In the Midwest, Black Friday outperformed Super Saturday last year, fueling the nation’s biggest post-Thanksgiving retail visit spike – a testament to the milestone’s strong local appeal. Meanwhile, in the Western U.S. Black Friday trailed well behind Super Saturday, though both milestones drove smaller upticks than in other regions. And in New England and the South Central states, Super Saturday achieved its biggest impact, suggesting that last-minute holiday specials may resonate especially well in that area.
Plenty of Local Variety
Digging deeper into major Midwestern hubs shows that even within a single region, holiday promotions can produce widely different responses.
In St. Louis, Indianapolis, and Minneapolis, for example, consumers followed the broader Midwestern pattern, flocking to stores on Black Friday exhibiting less enthusiasm for Super Saturday deals. By contrast, Chicago and Detroit saw Super Saturday edge ahead, with Chicago’s Black Friday peak falling below the nationwide average of 50.1%. examples highlight the power of local preferences to shape holiday campaign results.
Differing Demographic Shifts Across Regions
Holiday promotions don’t just drive visit spikes; they also spark subtle but significant changes in the demographic profiles of brick-and-mortar shoppers, expanding many retailers’ audiences during peak periods. And these shifts, too, can vary widely across regions.
Outlet malls, department stores, and beauty & self-care chains, for instance, which typically attract higher-income consumers, tend to see slight declines in the median household incomes (HHI) of their visitor bases in December. This dip may be due to promotions drawing in more mid- and lower-income shoppers during the peak holiday season. Electronics stores and superstores, on the other hand, which generally serve a less affluent base, see modest upticks in median HHI in the lead-up to Christmas.
But once again, drilling further down into regional chain-level data reveals more nuanced regional patterns. Take Best Buy, a leading holiday season electronics destination. In some of the chain’s biggest, more affluent markets – including New York, Los Angeles, and Chicago – the big-box retailer sees small dips in median HHI during December. But in Atlanta and Houston – also relatively affluent, but slightly less so – December saw a minor HHI uptick, hinting at a stronger holiday rush from higher-income shoppers in those cities.
Back-to-School Bonanzas
Back-to-school promotions also play a pivotal role in the retail calendar, with superstores, apparel chains, office supply stores and others all vying for shopper attention. And though summer markdowns drive increased foot traffic nationwide, both the timing of these shifts and the composition of the back-to-school shopping crowd differ among regions.
A Southern Head Start
Analyzing weekly fluctuations in regional foot traffic to clothing and office supplies stores shows, for example, that back-to-school shopping picks up earliest in the South Central region, likely due to earlier school start dates.
But the biggest visit peaks occur in the Northeast – with clothing retailer foot traffic surging in New England in late August, and office supplies stores seeing an even bigger surge in the Middle Atlantic region in early September. Retailers and advertisers can plan their back-to-school deals around these differences, targeting promotions to local trends.
A New England Collegian Affair
Though K-12 families drive much of the back-to-school rush, college student shoppers also play a substantial role. And here, too, their participation varies by region.
For instance, the “Collegians” segment accounted for 2.2% of Target’s shopper base nationwide over the past year – rising to 3.0% in August 2024. But regionally, the share of “Collegians” soared as high as 4.0% in New England versus just 2.2% in the West. So while retailers in New England may choose to lean into the college vibe, those in Western states may place greater emphasis on families with children.
Mother’s Day and Father’s Day: Differing Dining Peaks
When it comes to dining, Mother’s Day and Father’s Day are the busiest days of the year for the full-service restaurant (FSR) category, as families treat their parents to a hassle-free meal out. And eateries nationwide capitalize on this trend by offering a variety of deals and promotions that add a little extra charm (and value) to the experience.
Atlantic Specials
Nationwide, Mother’s Day drives more FSR foot traffic than Father’s Day – except in parts of the Pacific Northwest, where Father’s Day traditions run especially deep. Still, the size of these holiday boosts varies substantially by region.
This year, for instance, Mother’s Day (May 11, 2025) drove the largest FSR surge in the Middle Atlantic, with the South Atlantic and Midwest not far behind. Father’s Day, by contrast, saw its biggest lift in the South Atlantic. Mother’s Day proved least resonant in the West, whereas Father’s Day had its smallest impact in New England.
Going the Extra Mile for Mom
Dining behavior also differs between the two occasions. Mother’s Day celebrants display a slight preference for morning FSR visits and a bigger one for afternoon visits, while Father’s Day crowds favor evenings – perhaps reflecting a preference for sports bars and later dinners with dad. Another interesting nuance: On Mother’s Day, a larger share of FSR visits originate from between 3 and 50 miles away compared to Father’s Day, suggesting that families go the extra mile – sometimes literally – to celebrate mom.
Self-Styled Celebrations: Driving Traffic with DIY Milestones
While established dates like Black Friday or Mother’s Day naturally spur promotions, brands can also craft their own moments with limited-time offers (LTOs). And much like holiday campaigns, these retailer-led events can produce varied outcomes across different regions.
Fast food restaurants, for example, have leaned heavily on limited-time offers (LTOs) and pop-culture tie-ins to fuel buzz in what remains a challenging overall market. And McDonald’s recent Minecraft promotion, launched on April 1, 2025 to coincide with the April 3 release of A Minecraft Move, shows just how impactful the practice can be.
Nationally, the Minecraft promotion (featuring offerings for both kids and adults) drove a 6.9% lift in visits during the movie’s opening week. But the impact of the promotion was far from uniform across the U.S. Many of McDonald’s Western markets – including Utah, Idaho, Nevada, California, Texas, Arizona, Colorado, and Oregon – recorded visit lifts above 10.0%. Meanwhile, Kentucky saw a 2.1% dip, and several other Eastern states registered modest gains below 3.0%. The McDonald’s example illustrates the power of regional tastes to shape the success of even the most creative pop-culture collabs.
Adopting a Regional Lens
Whether it’s properly timing holiday and back-to-school discounts, recognizing where Mother’s Day or Father’s Day will resonate more, or pinpointing markets that respond best to pop-culture tie-ins, the data reveals that effective promotions depend heavily on local nuances. And by analyzing regional and DMA-level trends, retailers and advertisers can craft compelling, relevant campaigns that heighten engagement where it matters most.
Discover how mall anchors are transforming in 2025 – and how a foot-traffic-focused approach to choosing key tenants can drive visits and shopper engagement.
May 29, 2025
8 minutes
Key Takeaways
1. Experiential and niche retailers can deliver anchor-level traffic. At Towne East Square Mall, the addition of a Scheels in 2023 significantly increased foot traffic and long-distance travelers, while Barnes & Noble at Coronado Center in Albuquerque has become a key driver of both foot traffic and higher-spend demographics.
2. Size isn’t everything – especially for dining venues. At Glendale Galleria and Northridge Fashion Center, smaller restaurants attracted more foot traffic than some traditional anchors.
3. Refocusing on tenants’ actual traffic contributions enables a flexible anchor approach. Balancing weekend draws like Scheels with weekday favorites such as Costco or Chick-fil-A can help maintain steady visitor flow throughout the week. Similarly, onsite fitness clubs can shift traffic to earlier in the day – an opportunity to adjust store hours and capture additional morning shoppers.
4. Temporary pop-ups can form an integral part of a visit-focused anchor strategy. The Barbie Dreamhouse Living Truck Tour generates mall visit spikes well above typical Saturday levels. Operators can integrate these events into their overall anchor strategies, offering preferential terms to high-performing pop-ups.
5. New tenants can boost traffic for existing stores in similar categories. After Aldi joined Green Acres Commons in February 2020, visits to an existing BJ’s Wholesale Club trended upwards. This synergy highlights how overlapping audiences can become a strength, creating a larger overall customer base.
The Retail Comeback Kid
Malls, it seems, are cool once again. After languishing in the wake of the pandemic, shopping centers across the country are thriving – reinventing themselves as prime “third places” where people can hang out, shop, and grab a bite to eat.
One key driver behind this resurgence is a shift in how malls view their anchor tenants. While traditional mainstays like Macy’s and JCPenney still play an important role, specialized offerings – from popular eateries to fitness centers and immersive retailtainment destinations – are increasingly taking center stage. These attractions maximize the experiential value that brick-and-mortar venues can deliver, driving visits and sales for the center as a whole.
Against this backdrop, this report leverages the latest location intelligence data to explore the types of tenants that can function as mall anchors in 2025. Should mall operators still focus on general merchandisers to draw crowds, or can dining chains and more niche retailers also do the job? How important is square footage in identifying the anchor-like tenants in a shopping center? And how can a visit-focused approach help mall operators select effective anchor or anchor-like tenants – whether to fill big-box spaces or to leverage the leasing perks traditionally reserved for major large-format chains?
Out-of-the-(Big)-Box Visit Drivers
One of the most important functions of a mall anchor is to ensure steady visitation – providing its smaller tenants with a constant flow of potential customers. And as the role of the mall continues to evolve, analyzing the actual foot traffic impacts of different types of businesses can help identify the kinds of non-traditional anchors best suited to fulfill that purpose.
The Power of a Well-Placed Scheels
Experiential venues, for example, are particularly well-poised to serve as powerful anchors in today’s retail environment – as illustrated by the visit surge experienced by Towne East Square Mall in Wichita, KS following the addition of a Scheels in July 2023.
By blending traditional retail with immersive experiences, Scheels has emerged as a true experiential destination. And this pull has also helped the mall draw more long-distance visitors willing to travel to enjoy Scheels’ offerings. In 2024, 41.9% of the mall’s customers traveled more than 50 miles to visit, compared to 35.8% back in 2018 when Sears occupied the same lot.
Scheels Anchor Brings Substantial Visit Boost to Towne East Square Mall in Wichita, KS, Attracting Visitors From Further Away
Visits to Towne East Square Mall Compared to Q1 2018 Baseline
Share of Visitors From 50+ Miles Away
Share
Embed:
The Barnes & Noble Effect
Traditionally, anchors aimed to please the widest possible audiences – with department stores, big-box chains, and grocery stores leading the way. But visitation data shows that niche concepts can also deliver anchor-level traffic if they’re compelling enough to attract dedicated fans.
The experience of the Barnes & Noble at Coronado Center in Albuquerque, NM is a case in point. After being written off as all but obsolete, Barnes & Noble has staged an impressive comeback in recent years, finding success through a more curated, localized approach to book selling. And despite not being a formal anchor, the Coronado Center Barnes & Noble accounted for 7.9% of visits to the mall in 2024 – outperforming both Macy’s and JCPenney.
Year-over-year data also shows foot traffic surging at the Coronado Center Barnes & Noble, lifting overall visitation to the mall. And demographic data reveals that the bookstore draws a more affluent audience than either the center as a whole or the two department stores – attracting a crowd with more spending power.
This example also illustrates how smaller tenants can sometimes draw larger crowds. Even though Barnes & Noble occupies a smaller onsite space than either Macy’s or JCPenney, it is proving a powerful visit driver out of proportion to its physical size.
Dining Chains Punching Above Their Size
Dining chains are also adept at punching above their square footage – often attracting crowds disproportionate to their size.
Despite its relatively small footprint, for example, the In-N-Out Burger at Glendale Galleria drew an impressive 8.6% of visits to the mall complex in 2024, outpacing some of the mall’s official anchors like DICK’s Sporting Goods, Macy’s, and JCPenney. Still, the onsite Target drew even larger crowds at 14.4% of visits.
A similar pattern emerged at Northridge Fashion Center, where Porto’s Bakery and Cafe captured a notable 15.6% of visits to the complex in 2024 – more than some of the center’s traditional department stores.
These examples underscore the potential for dining chains, which typically require less space, to serve as micro-anchors by consistently attracting outsized crowds – a key consideration for mall operators looking to sustain visitor traffic.
Choosing a Mall Anchor in 2025
Refocusing on tenants’ actual foot traffic contributions also opens the door to a more flexible and dynamic approach to anchor selection and management – one that considers each venue’s unique visitation patterns.
The Weekend/Weekday Divide
Seasonal factors, for example, can make certain anchors more powerful at specific times of the year, while different venues shine on particular days of the week.
At Jordan Creek Town Center in West Des Moines, Iowa, for instance, Scheels and Costco each delivered just under 20.0% of the complex’s overall visits in 2024. But the two retailers’ daily patterns differed significantly: Scheels saw bigger crowds on weekends, while Costco was the primary weekday destination.
Understanding differences like these can help operators optimize their tenant mix to maintain a balanced flow of shoppers throughout the week.
Another example of the impact of differing weekday traffic patterns is offered by the impact of mall-based Chick-fil-A locations on the distribution of mall visits throughout the week.
Despite its relatively small size, Chick-fil-A draws substantial traffic to malls. And after adding Chick-fil-A locations, both Northridge and Miller Hill Malls saw meaningful drops in the share of visits to the centers taking place on Sundays – even as the wider indoor mall segment saw slight upticks.
Recognizing this trend could prompt mall operators to compensate by adding more weekend-friendly traffic drivers – or to lean into this distinction by taking additional steps to bolster the mall’s role as a go-to weekday destination.
The Early-Morning Fitness Advantage
The power of different mall traffic magnets also varies throughout the day. Increasingly, shopping centers are turning to fitness centers as experiential anchors. And since many people work out early in the morning, these gyms are having a significant impact on the distribution of mall visits across dayparts.
The addition of gyms to Northshore Mall in Peabody, MA and Jackson Crossing in Jackson, MI, for instance, led to a significant rise in visits between 7:00 AM and noon. And though the rest of the stores in these malls typically open at 10:00 or 11:00 AM, this shift presents the centers with a significant opportunity.
By adjusting opening hours to accommodate these early-morning patrons, malls can capitalize on this added traffic, driving up visits and sales for relevant tenants – especially health-focused retailers such as juice bars and sporting goods stores.
Adding Temporary Pop-Ups Into the Mix
Adopting a broader, visit-focused view of anchoring also allows mall operators to apply some of the strategies typically reserved for anchors to non-conventional traffic-generating businesses, to ensure a consistent flow of traffic year-round.
Pop-up stores and events, for example, generally don’t follow the same seasonal trends as other retailers – instead, they generate short-term visit boosts during their runs, whenever in the year that may be. And a visit-focused anchor strategy can leverage some of the perks traditionally reserved for anchor tenants – such as preferential leasing terms – to complement traditional full-time anchors during slower retail periods.
The Barbie Dreamhouse Living Truck Tour is a prime example of a traffic-driving pop-up. By bringing exclusive merchandise to malls across the U.S., the truck generates plenty of buzz, drawing crowds eager to snatch up limited-edition items and immerse themselves in all things Barbie. As a result, malls hosting the tour often see significant visit spikes, with foot traffic surging well above typical Saturday levels. Well-timed pop-ups like these can help balance out traffic throughout the year, offsetting traditional slow periods.
Creating a Bigger Visit Pie
A visit-focused approach to anchor management can also help mall operators assess the potential impact of new tenants on existing stores operating in similar categories. For example, mall owners often worry that new tenants operating in similar categories might cannibalize existing businesses. But a visit-focused anchor approach reveals that a well-chosen addition can sometimes benefit current tenants – especially if they cater to similar audiences.
In February 2020, for instance, value supermarket Aldi opened at Green Acres Commons in Valley Stream, NY – a center that already hosted budget-friendly BJ’s Wholesale Club. While BJ’s visits were relatively flat in 2018 and 2019, they began to rise after Aldi’s opening (and following a pandemic-induced dip). Cross-shopping data also shows that Aldi customers were more likely to visit BJ’s than the average Green Acres patron last year.
This synergy may be due in part to the two retailers’ similar visitor bases: In 2024, the Aldi and BJ’s stores in Green Acres Common drew shoppers with comparable economic profiles. This suggests that overlapping audiences can become a strength if aligned brands attract new shoppers, who then explore multiple stores in the same center.
Visits to BJ's Wholesale Club Took Off After Addition of Aldi to Green Acres Commons – Perhaps Buoyed by Audience Similarity
Visits to Green Acres Commons BJ's Wholesale Club, Compared to Q1 2018 Baseline
Median HHI, 2024*
Cross-Shopping, 2024
*Median HHI based on STI: PopStats dataset combined with Placer.ai data for captured trade areas.
Looking ahead, effective mall anchors will be defined less by physical footprint and more by their capacity to maintain consistent, valuable foot traffic. While traditional department stores remain pivotal, smaller or niche brands can often rival – or surpass – large-format retailers. And by thinking out of the anchor box and choosing tenants that cultivate a balanced visitor flow and align with local preferences, operators can position their centers as true go-to destinations.


.svg)


.avif)


