Strategic Insights
1. AI is raising the bar for physical retail as shoppers arrive more informed, more intentional, and less tolerant of friction – though the impact varies by category and format.
2. As discovery shifts upstream, stores increasingly serve as confirmation rather than discovery points where shoppers validate decisions through hands-on experience and expert guidance.
3. AI-based tools can improve in-store performance by removing operational friction – shortening trips in efficiency-led formats and supporting deeper engagement in experience-led ones.
4. By embedding expertise directly into frontline workflows, AI helps retailers deliver consistent, high-quality service despite high turnover and limited training windows.
5. AI enables precise, location-specific marketing and execution, allowing retailers of any size to align assortments, staffing, and messaging with real local demand.
6. Retailers can also use AI to manage their store fleets with greater discipline and understand where to expand, where to avoid cannibalization, and where to rightsize based on observed demand rather than static assumptions.
7. AI is not a universal lever in physical retail; its value depends on the store format, and in discovery-driven models it should support operations behind the scenes rather than reshape the customer experience.
Another Inflection Point for Physical Retail?
Physical retail has faced repeated claims of obsolescence, from the rise of e-commerce to the shock of COVID. Each time, analysts predicted a structural decline in brick-and-mortar. And each time, physical retail adapted.
AI has triggered a similar round of predictions. Much of the current discussion frames retail’s future as a binary outcome: either stores become heavily automated, or e-commerce becomes so optimized that physical locations lose relevance altogether.
But past disruptions point in a different direction. E-commerce changed how physical retail operated by raising expectations for omnichannel integration, speed, and clarity of purpose. Retailers that adjusted store formats, merchandising, and operations accordingly went on to drive sustained growth.
AI likely represents another inflection point for physical retail. As shoppers arrive with more information, clearer intent, and even less tolerance for friction than in the age of "old-fashioned" e-commerce, physical stores will remain – but the standards they are held to continue to rise.
This report presents four ways retailers are using AI to get – and stay – ahead as physical retail adapts to this next wave of disruption.
1. Driving Engagement & Conversion in Physical Retail
The Store as Confirmation Point
E-commerce moved discovery earlier in the shopping journey. Instead of beginning the process in-store, many shoppers now arrive at brick-and-mortar locations after having deeply researched products, comparing options, and narrowing choices online – entering the store to validate rather than initiate their purchasing decision.
AI-powered shopping accelerates this pattern. Conversational assistants, recommendation engines, and AI-driven discovery across search and social reduce the time and effort required to evaluate options – and this shift is changing consumers' expectations around the in-store experience.
Apple’s Early Bet on the Informed Consumer Pays Off
Apple shows what it looks like when a physical store is built for well-informed shoppers. Given the prevalence of AI-powered search and assistants in high-consideration categories like consumer electronics, Apple customers likely arrive at the Apple Store with more preferences already shaped by AI-assisted research than other retail categories.
Apple Stores were designed for this kind of customer long before AI became widespread. The layout puts working products directly in customers’ hands, merchandising emphasizes live use over promotional signage, and associates are trained to answer detailed technical questions rather than walk shoppers through basic options.
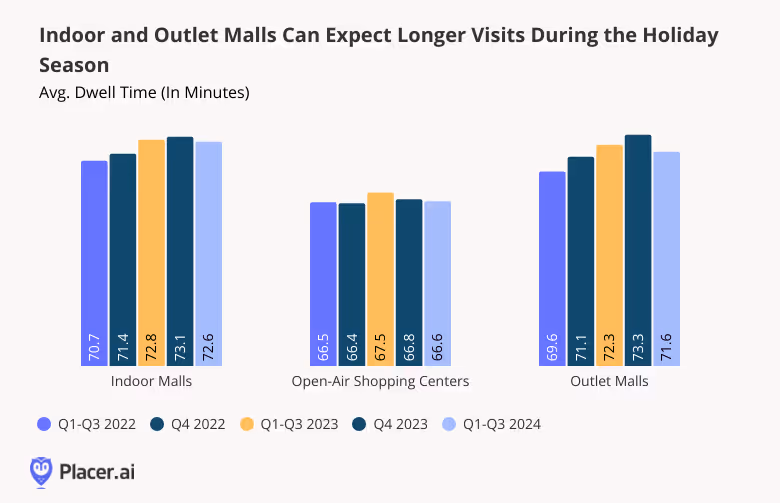
That alignment is showing up in store behavior. Even as AI-powered shopping expands, Apple Stores continue to see rising foot traffic and longer visits thanks to the store's specific and curated role in the customer journey – a place where customers confirm decisions through hands-on experience and expert guidance.
2. Creating Seamless In-Store Experiences
AI Inside the Store
Some applications of AI extend trends that e-commerce has already introduced. Others address operational challenges that previously required manual coordination or tradeoffs.
AI can reduce friction and make store visits more predictable by improving staffing allocation, reducing checkout delays, optimizing inventory placement, and managing traffic flow. These changes reduce friction without altering the visible customer experience.
Using AI to Remove Exit Friction at Sam’s Club
Sam's Club offers a clear, recent example of AI solving a specific in-store bottleneck. For years, customers completed checkout only to face a second line at the exit, where an employee manually scanned paper receipts and spot-checked carts.
In early 2024, Sam’s Club introduced computer vision-powered exit gates, allowing customers to exit the store without stopping as AI algorithms instantly captured images of the items in their carts and matched them against digital purchase data. Employees previously tasked with receipt checks could now shift their focus to member assistance and in-store support.
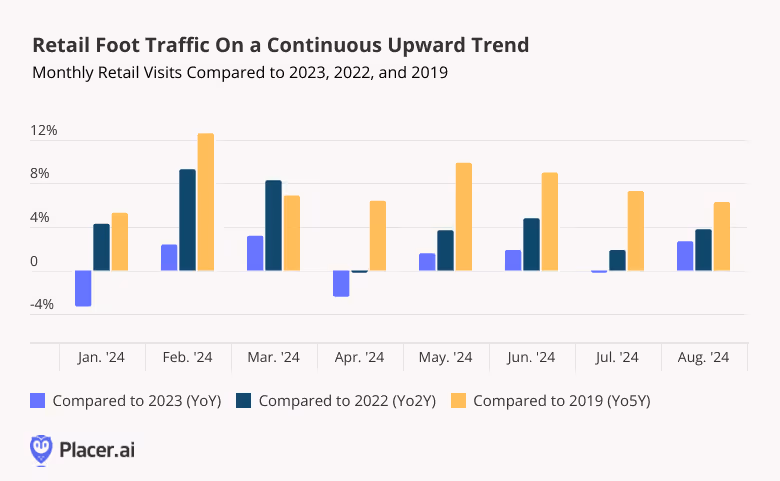
The impact was measurable. Sam’s Club reported that customers now exit stores 23% faster than under manual receipt checks, a result confirmed by a sustained nationwide decline in average dwell time. During the same period, in-store traffic increased 3.3% year-over-year – demonstrating how removing friction with AI can deliver tangible gains.
Aligning AI with Store Purpose
AI optimizes stores for different outcomes. At Sam’s Club, it shortens visits by removing friction from task-driven trips. At Apple, upstream research leads to longer visits focused on testing, questions, and decision validation. In both cases, AI aligns store execution with shopper intent – prioritizing speed and throughput in efficiency-led formats and deeper engagement in experience-led ones.
3. Scaling Expertise on the Sales Floor
Beyond shaping store roles and streamlining operations, AI can also address a long-standing challenge in physical retail: delivering consistent, high-quality expertise on the sales floor despite high turnover and seasonal staffing. In the past, retailers relied on heavy training investments that often failed to pay off. AI can now embed that expertise directly into frontline workflows, allowing associates to deliver confident, informed service regardless of tenure and strengthening the in-store experience at scale.
In May 2025, Lowe’s rolled out a major in-store AI enhancement called Mylow Companion, an AI-powered assistant that equips frontline staff with real-time, expert support on product details, home improvement projects, inventory, and customer questions.
Mylow Companion is embedded directly into associates’ handheld devices, delivering instant guidance through natural, conversational interactions, including voice-to-text. This enables even newly hired employees to provide confident, expert-level advice from day one, while helping experienced associates upsell and cross-sell more effectively. The tool complements Mylow, a customer-facing AI advisor launched the same year to help shoppers plan projects and discover the right products, leading to increased customer satisfaction.
While AI alone cannot solve demand challenges—especially amid macroeconomic pressure on large-ticket discretionary spending—early signals suggest it may still play a meaningful role. Location analytics indicate narrowing year-over-year visit gaps at Lowe’s post-deployment, pointing to a potentially improved in-store experience. And Home Depot’s recent announcement of agentic AI tools developed with Google Cloud suggests that these technologies are becoming table stakes in this category.
As more retailers roll out similar capabilities, those that moved earlier are better positioned to help set the bar – and benefit as the market adapts.
4. Reaching the Right Audience at the Right Moment
Beyond improving the in-store experience, AI also gives retailers a powerful way to drive foot traffic through precision marketing. By processing large volumes of behavioral, location, and timing data, AI can help retailers decide who to reach, when to engage them, where to activate, and what message or assortment will resonate – shifting marketing from broad seasonal pushes to campaigns grounded in local demand.
Target offers an early example of this approach before AI became widespread. Stores near college campuses have long tailored assortments and messaging around the academic calendar, especially during the back-to-school season. In August, these locations emphasize dorm essentials, compact storage, bedding, tech accessories, and affordable décor – supported by campaigns aimed at students and parents preparing for move-in. That localized approach has been effective in driving in-store traffic to Target stores near college campuses, with these venues seeing consistent visit spikes every August and outperforming the national average across multiple back-to-school seasons from 2023 to 2025.
AI makes local execution repeatable at scale. By analyzing visit patterns, past performance, and timing signals across thousands of locations, retailers can decide which products to promote, how to staff stores, and when to run campaigns at each location. Marketing, merchandising, and store operations then act on the same demand signals instead of separate assumptions.
Crucially, AI makes this level of localization accessible to retailers of all sizes. What once required the resources and institutional knowledge of a big-box giant can now be achieved through precision marketing and demand forecasting tools, allowing brands to adapt each store’s messaging, assortment, and execution to the unique rhythms of its community.
5. Building Smarter Store Fleets With AI
Beyond improving performance at individual stores, AI can also give retailers a clearer view of how their entire store fleet is working – and where it should grow, contract, or change. By analyzing foot traffic patterns, trade areas, customer overlap, and visit frequency across locations, AI helps retailers identify which sites are truly reaching their target audiences and which are underperforming relative to local demand.
AI also plays a critical role in smarter expansion. Retailers can use it to identify markets and neighborhoods where demand is growing, customer overlap is low, and incremental visits are likely – reducing the risk of cannibalization when opening new stores. By modeling how shoppers move between existing locations, AI can flag when a proposed site will attract new customers versus simply shifting traffic from nearby stores, grounding expansion decisions in observed behavior rather than demographic proxies or intuition alone.
Equally important, AI helps retailers recognize when expansion no longer makes sense. By tracking total fleet traffic, visit growth, and trade-area saturation, retailers can assess whether new stores are adding net demand or diluting performance. The same signals can identify locations where demand has structurally declined, informing rightsizing decisions and store closures. In this way, AI supports a more disciplined approach to physical retail – one that treats the store fleet as a dynamic system to be optimized over time, rather than a footprint that only grows.
AI Won’t Matter Equally Across All Retail Formats
The impact of AI on physical retail will vary significantly by category and format. Not every successful store experience is built around efficiency, prediction, or pre-qualification. Retailers with clearly differentiated offline value don’t necessarily benefit from forcing AI into customer-facing experiences that dilute what makes their stores work.
“Treasure hunt” formats are a clear example. Off-price retailers like TJ Maxx, Marshalls, Ross, and Burlington continue to drive strong traffic by offering unpredictability, scarcity, and discovery that cannot be replicated – or meaningfully enhanced – through AI-driven search or recommendation. The appeal lies precisely in not knowing what you’ll find. For these retailers, heavy investment in AI-led personalization or pre-shopping guidance risks undermining the core experience rather than improving it.
Similar dynamics apply in other categories. Independent boutiques, vintage stores, resale shops, and certain specialty retailers succeed by offering curation, serendipity, and human taste rather than optimization. In these cases, AI may still play a role behind the scenes – supporting inventory planning, pricing, or site selection – but it should not reshape the customer-facing experience. AI is most valuable when it reinforces a retailer’s existing value proposition. Formats built around discovery, surprise, or experiential browsing should protect those strengths, even as other parts of the retail landscape move toward greater efficiency and intent-driven shopping.
Raising the Bar for Physical Retail
AI is forcing physical retail to evolve with intention. By creating a supportive environment for customers who arrive with made-up minds, removing friction inside the store, offering the best in-store services, and orchestrating demand with greater precision, retailers are adapting to the new world standards set by AI. All five strategies focus on aligning stores with shopper intent – what customers want, how the store supports it, and when the interaction happens.
The retailers that win in this next era won’t be the ones that use AI to simply automate what already exists. They’ll be the ones that use it to sharpen the role of physical retail – turning stores into places that help shoppers validate decisions, deliver value beyond convenience, and show up at exactly the right moment in a customer’s journey.
In the age of AI, physical retail wins by becoming more intentional – designed around informed shoppers, optimized for the right outcome in each format, and activated at moments when demand is real.


.svg)


.avif)

