Uncovering the Healthcare Opportunity in Grocery
Grocery chains in the United States are increasingly investing in on-site healthcare clinics, transforming their stores into hubs for both food and wellness. While grocery stores have long featured pharmacies and some basic healthcare services like vaccinations, recent years have seen a shift towards more extensive healthcare offerings.
Today, many grocery stores offer a range of services – from primary and urgent care to dental and mental health care. In addition to providing an important community service, grocery-anchored healthcare clinics can boost foot traffic at chains, help health providers reach more patients, and allow shoppers to manage their health and home needs in one convenient trip.
This white paper examines the impact these in-store clinics have on grocery chain visitation patterns and trade area characteristics. Are shoppers more or less likely to make repeat visits to grocery stores with healthcare services? And how does the addition of a clinic affect the demographic profile of a grocery store’s captured market? The report examines these questions and more, offering insights for stakeholders across the grocery and healthcare industries.
Health Clinics Lead to Healthy Foot Traffic Boosts
Analyzing foot traffic to grocery stores with and without in-store clinics shows the positive impact of these services: Across chains, locations with on-site healthcare offerings drew more visits in H1 2024 than their chain-wide averages.
The Kroger Co., which operates numerous regional banners as well as its own eponymous chain, has been a leader in in-store healthcare services since the early aughts. The company introduced its in-store medical center, The Little Clinic in 2003 – and today operates over 225 Little Clinic locations across its Kroger banner, as well as regional chains Dillons, Jay C Food Stores, Fry’s, and King Soopers.
And in H1 2024, the eight Dillons locations with clinics saw, on average, 93.0% more visits per location than the chain’s banner-wide average. Jay C, which offers two in-store clinics, also saw visits to these venues outpace the H1 2024 banner-wide average by 92.9%. For both chains, relatively small overall footprints may contribute to their outsize visit differences: Indiana-focused Jay C operates just 22 locations, all in the Hoosier State, while Kansas-based Dillons has some 64 locations.
But similar patterns, if somewhat less pronounced, could be observed at Kroger (43.0%), Fry’s (19.2%), and King Soopers (16.5%) – as well as at H-E-B (14.5%), which boasts its own expanding network of in-store clinics.
The Doctor is in (Higher HHI Areas)
Analyzing the trade areas of grocery stores with healthcare clinics shows that these services tend to draw more affluent visitors from within the stores’ trade areas.
For some chains, including King Soopers, H-E-B, and Jay C, the clinics are positioned to begin with in areas serving higher-income communities. The median household income (HHI) of King Soopers’ in-store clinic’s potential markets, for example, came in at $92.3K in H1 2024 – significantly above the chain’s overall potential market median HHI of $88.1K. Similarly, the potential markets of H-E-B and Jay C Food Stores with clinics had higher median HHIs than the chains’ overall averages.
And for all three chains, stores with clinics tended to attract visitors from captured markets with even higher median HHIs – showing that within these affluent communities, it is the more well-to-do customers that tend to frequent these venues. (A chain or store’s potential market is obtained by weighting each CBG in its trade area according to the size of the population – thus reflecting the general composition of the community it serves. A chain or store’s captured market, on the other hand, is obtained by weighting each CBG according to its share of visits to the business in question – and thus represents the population that actually visits it in practice.)
Other brands, including Fry’s, Kroger, and Dillons, have positioned clinics in stores with potential market median HHIs slightly below chain-wide averages. But within these markets, too, it is the more affluent consumers that are visiting these stores, pushing up the median HHI of their captured markets.
These patterns highlight that, for now, grocery store clinics tend to attract consumers on the upper ends of local income spectrums. This information can be utilized by healthcare professionals and grocery store owners to pinpoint neighborhoods that may be open to grocery-anchored clinics, or to take steps to increase penetration in other areas.
Kroger’s In-Store Clinics Offer Community Blueprint
Supermarket giant Kroger is a major player in the world of grocery-anchored healthcare, offering visitors access to pharmacies, clinics, and telehealth options via its grocery stores. What impact has the company’s embrace of healthcare had on visits and loyalty?
Convenience for All: Clinics Draw Families
An analysis of household compositions across the potential and captured markets of Kroger-owned stores with and without Little Clinic offerings suggests that families with children are extremely receptive to these services.
In H1 2024, Kroger, King Soopers, Fry’s, Jay C, and Dillons all featured captured markets with higher shares of STI: PopStats’ “Households With Children” segment than their potential ones – highlighting the chains’ appeal for families. But the share of parental households in those stores with Little Clinics jumped significantly higher for all five banners.
The share of families with children in King Soopers’ overall captured market stood at 28.3% in H1 2024, higher than the 27.2% in its potential one. But the households with children in the captured markets of King Soopers locations with Little Clinics was significantly higher – 30.6% – and similar patterns emerged at Jay C, Dillons, Kroger, and Fry’s.
This special draw is likely linked to the clinics' focus on family health services like physicals, nutrition plans, and vaccines. The convenience of being able to take care of healthcare, grocery shopping, and pharmacy needs all in one go makes these stores particularly attractive to parents. And this jump in foot traffic shows the strategic advantage of incorporating healthcare services into the retail environment.
Wellness Options, Loyal Shoppers
Providing essential healthcare services at the supermarket can establish a grocery chain as a crucial part of a shopper's daily life, enhancing visitor loyalty, and helping nurture long-term customer relationships. Indeed, in-store clinics offer a unique opportunity for grocery providers to connect with customers on a level that extends beyond the transactional.
An analysis of several Kroger-branded locations in the Cincinnati metro area showcases the profound impact in-store clinics can have on customer loyalty. In H1 2024, stores with Little Clinics had significantly higher shares of repeat visitors – defined as those making six or more stops at the store during the analyzed period – than those without.
For instance, 36.4% of visitors to a Kroger Marketplace store with an in-store clinic in Harrison, Ohio, frequented the location at least six times during the first half of 2024. But over the same period, only 29.0% of visitors stopped by at least six times to a nearby Kroger location in Cleves, Ohio – just ten miles away. Similarly, 30.7% of visitors to the Beechmont Ave. Kroger Food & Drug location with a clinic visited at least six times in H1 2024, compared to 23.0% for the nearby Ohio Pike Kroger store.
This trend was consistent across the analyzed locations, with those offering in-store clinics attracting significantly higher shares of loyal visitors. These metrics support the value of offering additional services as a draw for frequent visitors, while also providing the clinics themselves with the visitor volume needed to operate profitably.
Texas Strong: H-E-B’s Wellness Mission
Texan grocery chain H-E-B is beloved across the state – and though the chain isn’t new to the healthcare scene, it has been doubling down on wellness. In 2022, H-E-B launched H-E-B Wellness, a healthcare platform that offers patrons a variety of medical services, including – as of today – some 12 primary care clinics, many of them inside stores.
Community Care at H-E-B
H-E-B stores with primary care clinics are helping to cement the grocer’s role as a convenient one-stop for local residents – allowing them to drop in to a nearby location for both daily grocery needs and wellness care.
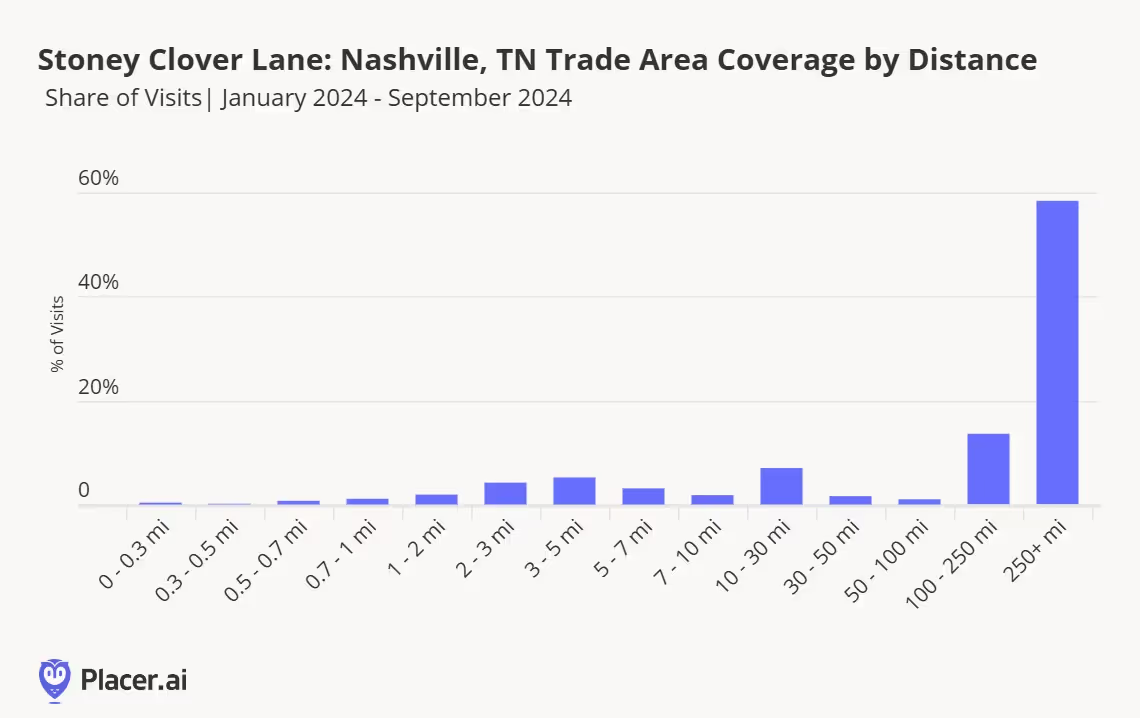
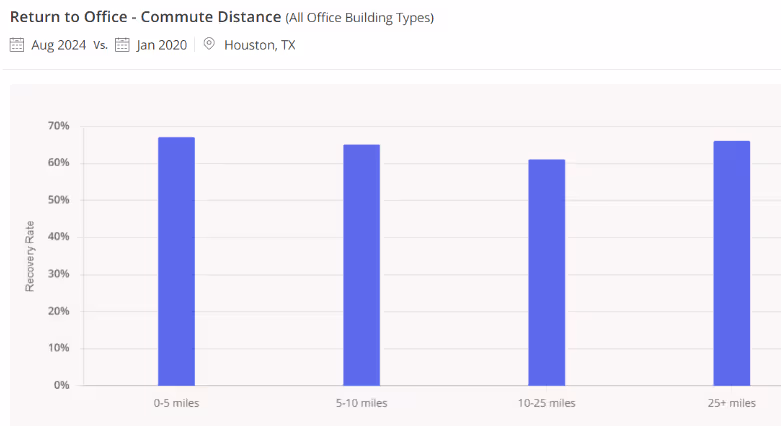
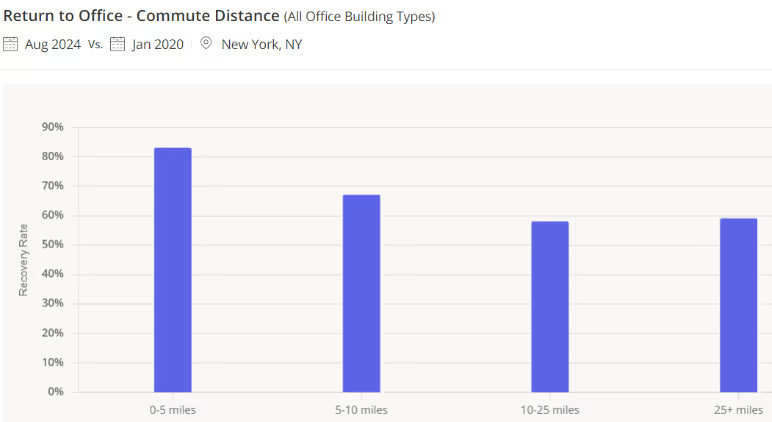
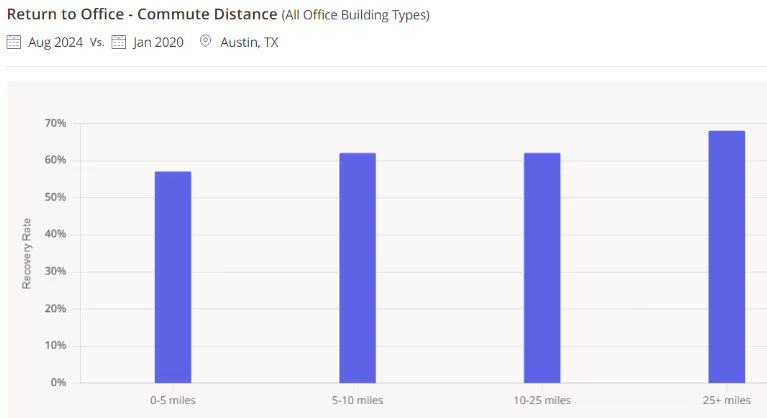
H-E-B has always placed a premium on community, stepping up to help local residents in times of need. And though the chain as a whole draws an overwhelming majority of its visitors from nearby areas, those with clinics do so even more effectively. In H1 2024, some 83.6% of visitors to H-E-B came from less than 10 miles away. But for locations with primary care clinics, this share increased to 88.0%.
This suggests that wellness services are particularly appealing to nearby residents, strengthening H-E-B’s connection with local consumers even further. And for a grocery store centered on community engagement, the integration of health services into its offerings is proving to be a winning strategy.
Wellness Wins Over Middle-Class Visitors
H-E-B has been steadily expanding its primary care offerings since it launched the Wellness concept, adding two primary clinics at locations in Cypress, TX and Katy, TX in June 2023. Following the opening of these clinics – which operate Mondays through Fridays – both locations saw marked increases in the share of “Urban Cliff Dwellers” in their weekday captured markets. This STI: Landscape segment group encompasses families both with and without children, earning modest incomes and enjoying middle-class pleasantries.
Between June 2022 - May 2023, the share of “Urban Cliff Dwellers” in the weekday captured markets of the Cypress and Katy locations stood at 9.5% and 7.2%, respectively. But once the stores had clinics in place, those numbers jumped to 12.4% and 11.0%, respectively.
This increase in the stores’ reach among “Urban Cliff Dwellers” immediately following the clinics’ openings suggests that in addition to more affluent consumers, middle-class families also harbor considerable interest in these services. As more retailers continue making inroads into the healthcare sector, they may find similar success in attracting diverse groups of convenience-seeking shoppers.
Grocery and Health Care: A Winning Combination
As grocery stores lean into healthcare, they are transforming into multifaceted hubs that offer both essential health services and everyday shopping needs. Retailers like Kroger and H-E-B are reaping the benefits of boosted foot traffic, higher-income visitors, and strengthened community ties – while offering their shoppers convenience that helps streamline their daily routines.


.svg)