

.svg)


Thank you! Your submission has been received!
Oops! Something went wrong while submitting the form.
0
0
0
0
----------
0
0
Articles

Article
Waning Consumer Sentiment Puts Pressure on Retail IndustryAfter years of resilience, consumers appear to be pulling back as retail traffic softens alongside record-low consumer sentiment.
Elizabeth Lafontaine
Jun 8, 2026
2 minutes

Article
Restaurants at an Inflection Point: Takeaways from the 2026 NRA ShowThe 2026 NRA Show revealed an industry at an inflection point, where value, innovation, and loyalty are separating winners from the pack.
R.J. Hottovy
Jun 5, 2026
4 minutes

Article
Super Mario Galaxy's Impact on Movie Theater AudienceThe Super Mario Galaxy Movie reshaped theater audiences in 2026, driving family attendance, morning matinees, and post-movie QSR visits.
Shira Petrack
Jun 4, 2026
2 minutes

Article
Rising Gas Prices Are Changing How America Fills Up – And ShopsGas prices climbed nearly 60% in early 2026 — and foot traffic data shows consumers are finally changing how they fill up and shop. See what the numbers reveal.
Ezra Carmel
Jun 3, 2026
4 minutes

Article
Consumer Desire for Small Indulgences Boosts Hobby RetailConsumers are embracing hobbies like book clubs, crafting, Mahjong, and journaling as affordable indulgences, boosting traffic to retailers including Barnes & Noble (BKS), Michaels, and Paper Source.
Elizabeth Lafontaine
Jun 1, 2026
3 minutes
Article
What Shein Is Really Buying with EverlaneShein’s reported $100M acquisition of Everlane is about more than a sustainability halo – it’s also a bid for direct access to the high-income, urban consumers the fast-fashion giant has long struggled to reach.
Lila Margalit
May 29, 2026
3 minutes
Reports
INSIDER
Pricing Strategies Driving Restaurant Visits in 2024Dive into the data to explore the state of the restaurant industry in 2024 and see how leading chains are navigating the challenges posed by rising prices.
September 26, 2024
7 minutes
INSIDER
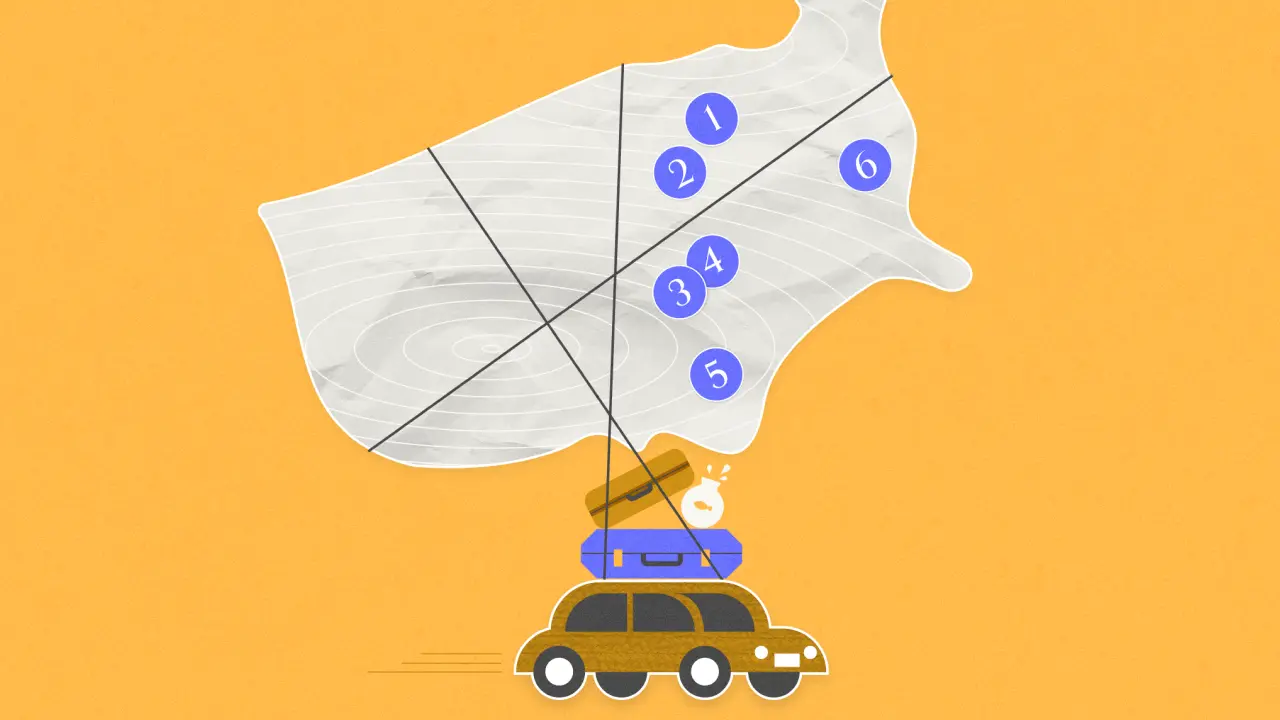
The Rising Stars: Six Metro Areas Welcoming Young ProfessionalsFind out which metro areas are seeing positive net migration and discover what might be drawing newcomers to these cities.
September 23, 2024
3 minutes
INSIDER
Redefining Retail Spaces: Lessons from the C-Store CategoryDive into the data to see how convenience stores are redefining retail spaces.
September 16, 2024
5 minutes
Loading results...
We couldn't find anything matching your search.
Browse one of our topic pages to help find what you're looking for.
For more in-depth analyses on a variety of subjects, explore Reports.
For more in-depth analyses on a variety of subjects, explore Reports.

INSIDER
Stay Anchored: Subscribe to Insider & Unlock more Foot Traffic Insights
Gain insider insights with our in-depth analytics crafted by industry experts
— giving you the knowledge and edge to stay ahead.

