Find out what is driving foot traffic to Best Buy.
Ezra Carmel
Feb 26, 2025
4 minutes
Best Buy has long been a go-to destination for consumers looking for the latest tech – but like many retailers, it has faced challenges in recent years. We dove into the data to explore the latest visitation trends for Best Buy and the demographics of visitors that are driving traffic to the chain.
Best Buy Bounces Back
Best Buy’s visits lagged in 2024 (7.0% below 2023 levels), but the company continues to invest in a real estate strategy aimed at improving consumer engagement. To leverage its store fleet most efficiently, Best Buy is closing traditional large-format stores while opening smaller-format ones to provide a tailored experience to consumers – often in small and midsized markets previously untapped by the retailer.
And Best Buy may already be reaping the benefits of this strategy; in January 2025, the retailer received a 0.4% YoY boost in foot traffic. As the chain continues to optimize its real estate footprint, it could be on track to drive more visit growth in the near future – particularly as more shoppers replace consumer electronics purchased during the pandemic.
Daily Holiday Spikes
Drilling down to daily visitation over the holiday season further highlights Best Buy’s momentum going into 2025. Best Buy consistently drives traffic during critical retail moments, and 2024 was no exception.
On Black Friday 2024, the retailer saw a 473.1% visit boost compared to the daily average for 2024. And the foot traffic surge continued the following day (Black Saturday, 162.4%) as consumers likely continued to take advantage of the weekend’s discounts.
And as was the case in previous years, Best Buy’s traffic picked up as Christmas 2024 neared, with significant visit spikes on Super Saturday (199.0%), Panic Sunday (151.3%), and Christmas Eve Eve (171.7%). Best Buy also saw elevated traffic post-Christmas traffic on Boxing Day (128.0%), when consumers likely looked to exchange gifts or set up their new tech with the help of the renowned Geek Squad.
Plugging in to Family Foot Traffic
Of course, Best Buy is more than just a holiday shopping destination. And analysis of audience segmentation for the retailer reveals that families are overrepresented in the chain’s captured* market relative to its potential* market – indicating that this segment in particular drives significant traffic year-round.
According to the AGS: Demographic Dimensions dataset, in 2024, the average household size in Best Buy’s potential market was 2.49 people compared to 2.64 people in the chain’s captured market. Married couples with children were also more heavily represented in the chain’s captured market (33.4%) compared to its potential market (32.0%), suggesting a relatively larger share of visitors from family households among Best Buy’s visitors.
Further analysis of audience segments within the chain’s captured and potential markets indicates that visitors from a variety of family types are drawn to Best Buy. According to the Spatial.ai: PersonaLive dataset, residents belonging to the “Wealthy Suburban Families”, “Upper Suburban Diverse Families”, “Near-Urban Diverse Families”, and “Blue Collar Suburbs” segments were all over-represented in Best Buy’s captured market compared to its potential market. This suggests that visitors from different types of family households – working-class, wealthy, urban, and suburban – are driving traffic to Best Buy.
Perhaps families are drawn to Best Buy’s expandingexperiential format, where visitors of all ages can get hands-on with LEGO and explore home theater set ups worthy of a family movie night.
*A chain or venue’s potential market is derived by the census block groups (CBGs) from which the retailer draws its visitors weighted by the population size of each, whereas a captured market is derived from the same CBGs weighted by the share of visits from each, and thus reflects the population that actually visits the chain or venue.
The Best is Yet to Come
Best Buy’s ability to drive traffic through strategic store formats, holiday shopping surges, and family households highlights the company’s ongoing relevance in the evolving consumer electronics landscape. With early signs of a foot traffic resurgence, Best Buy appears to have positioned itself for continued success in 2025.
Want more data-driven retail insights? Visit Placer.ai.
After the devastating wildefires that displaced thousands in LA, many turned to malls for a sense of comfort and community.
Caroline Wu
Feb 25, 2025
3 minutes
Our hearts go out to all those affected by the recent Los Angeles wildfires. Many Angelenos, in search of a sense of normalcy and diversion, have turned to a familiar and comforting place—the mall.
Los Angeles Malls Provide Escape to Displaced Palisadians
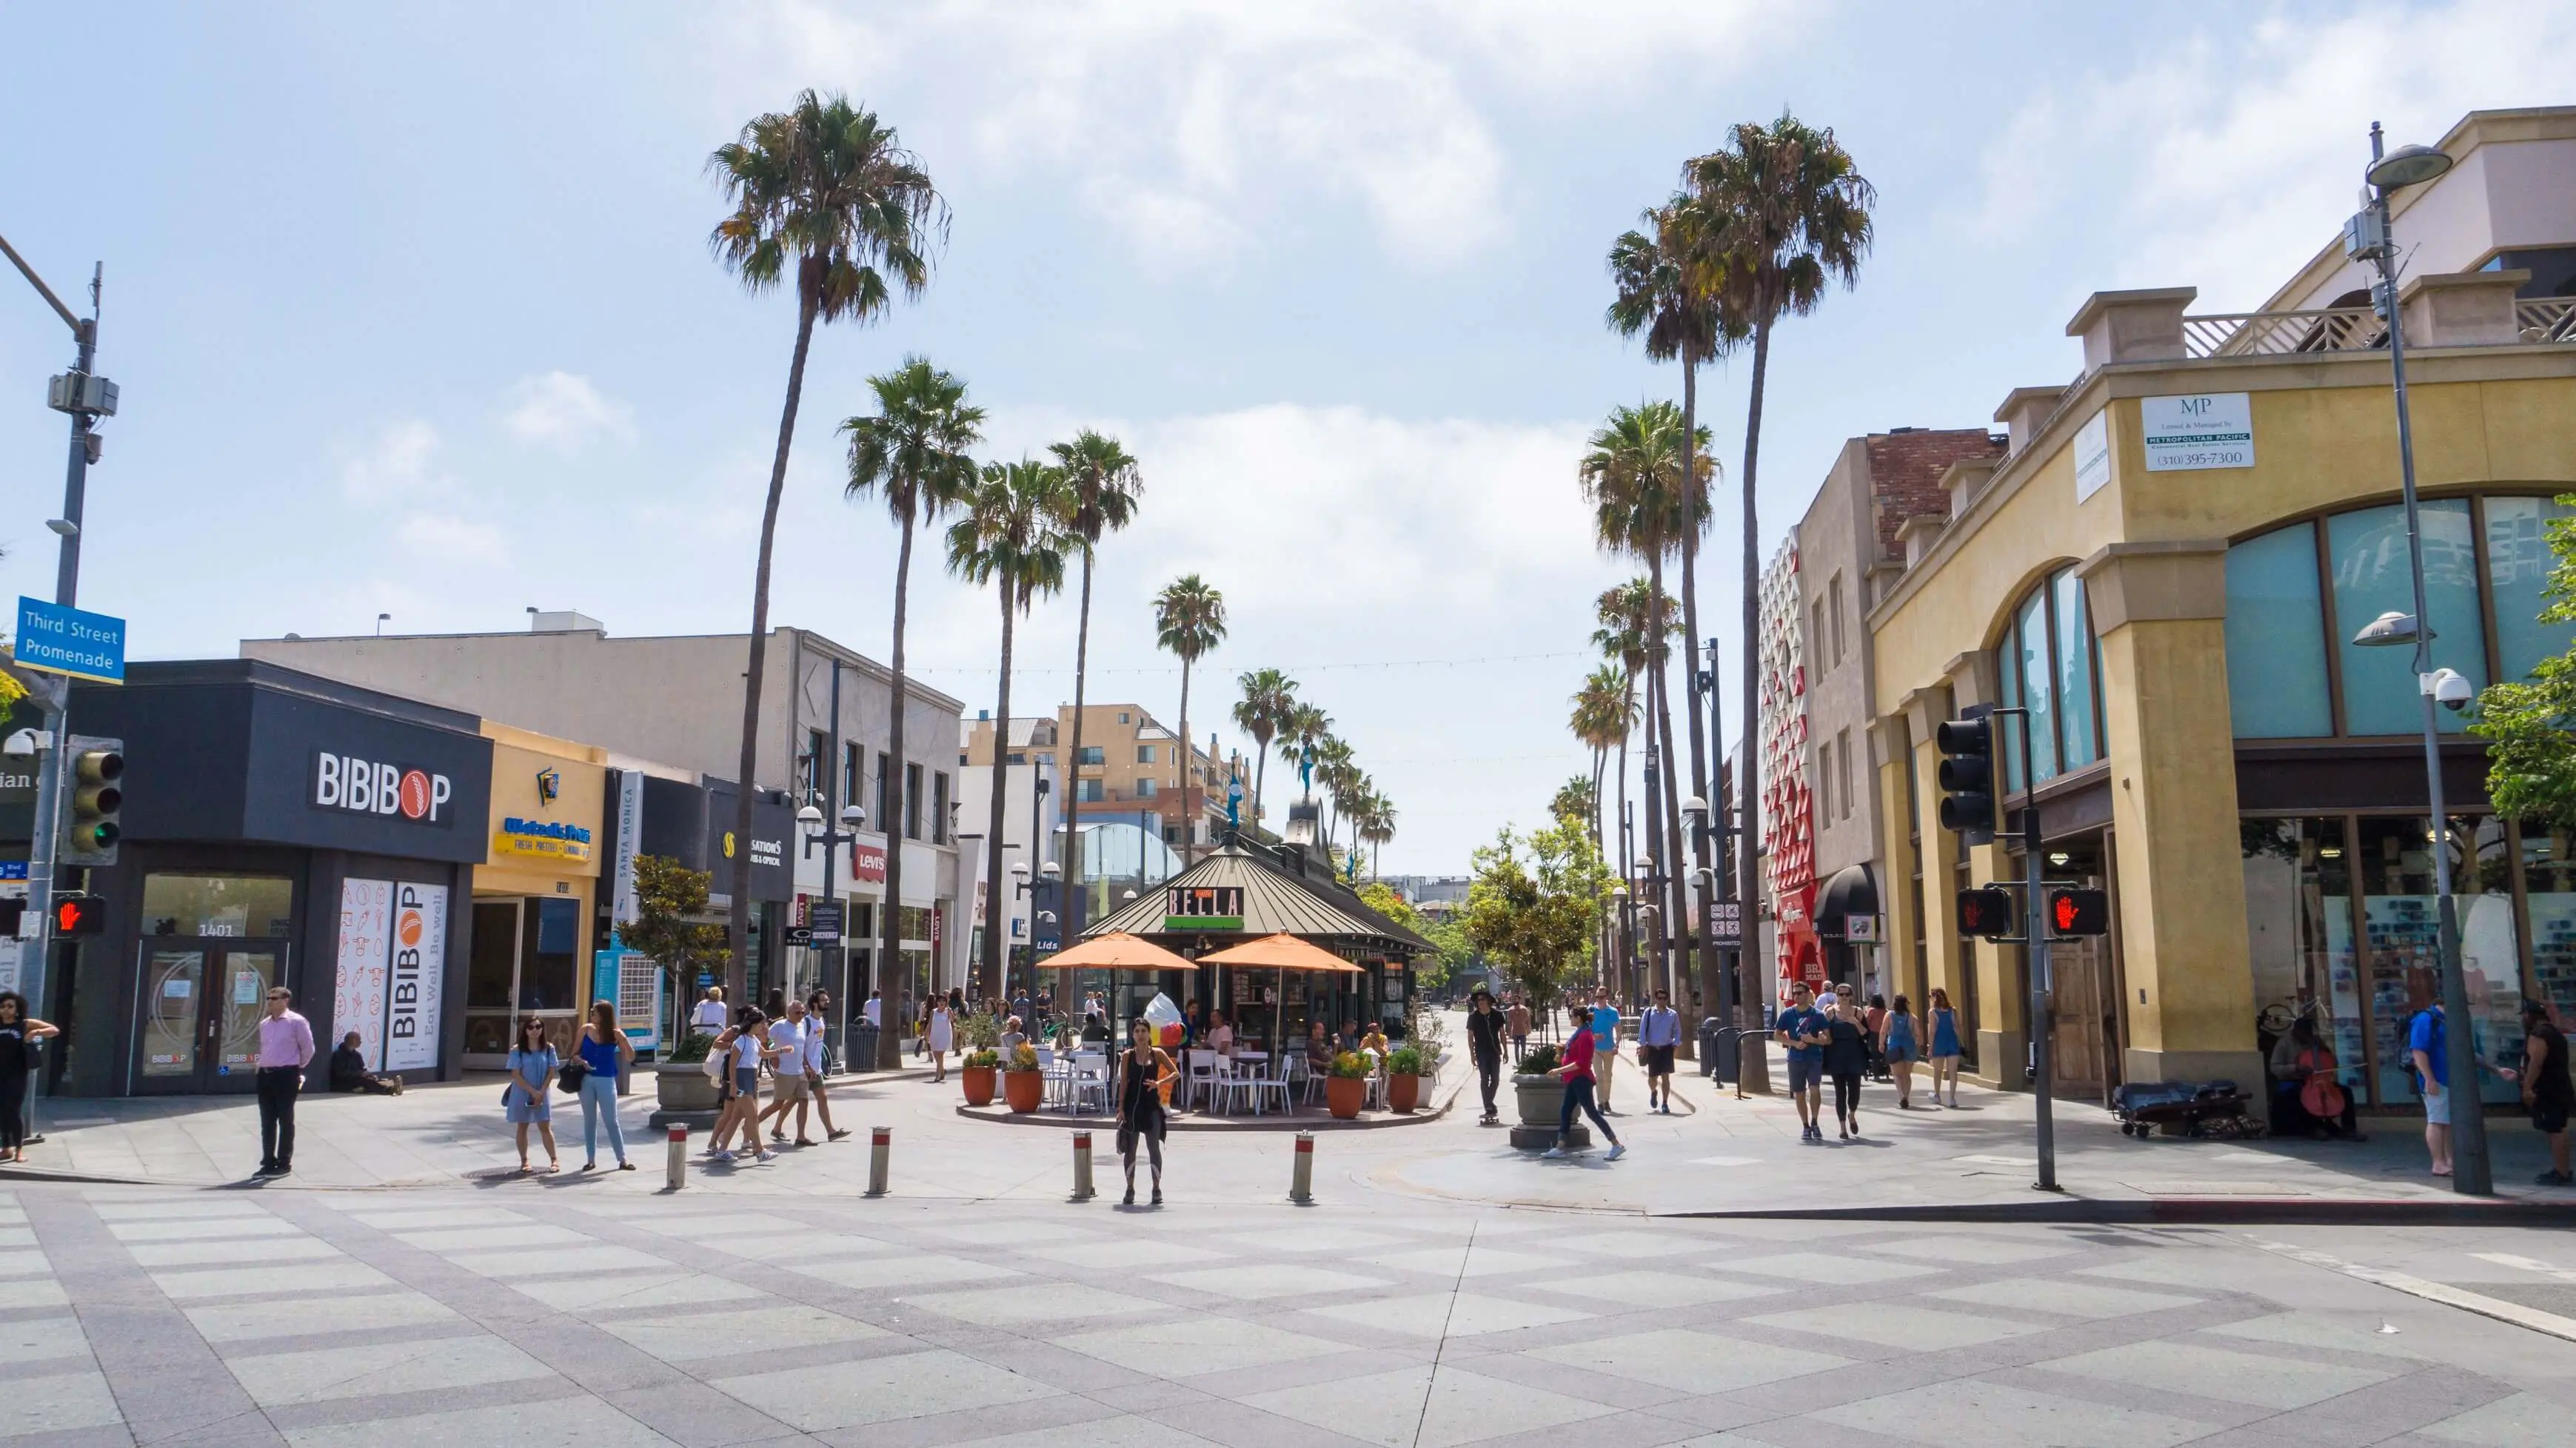
On the west side of Los Angeles, Third Street Promenade in Santa Monica experienced a significant surge in weekly visitation compared to a baseline of January 6th-12th 2025. This increase is not surprising, as many Palisadians fled south to Santa Monica hotels and rentals, allowing them to stay close to their neighborhoods, children’s schools, and social circles.
Westfield Century City and The Grove also saw increased foot traffic, as both malls serve as key gathering spots in their communities and feature state-of-the-art movie theaters, providing a few hours of escape. Additionally, their upgraded HVAC systems—enhanced post-pandemic—may offer an added layer of comfort for visitors. Similarly, Westfield Topanga, a familiar shopping destination for residents of the San Fernando Valley, saw an uptick in visits during the second half of January. And traffic at these shopping destinations was still elevated as of mid-February, suggesting that at least some displaced residents are likely staying in the area in the more medium-term.
Some Palisadians have opted to relocate much farther south, though this migration appears to have had a more dispersed effect on shopping patterns. As a result, we do not see a significant impact on visitation to South Bay shopping centers like Manhattan Village and Del Amo Fashion Center.
While reports have mentioned some Palisadians moving to Newport Beach—a community that shares similar demographics with the Palisades—the influx does not appear to be large enough to meaningfully shift mall visitation patterns in January. Additionally, given the circumstances, it is unlikely that many displaced residents would be making frequent trips to Fashion Island or South Coast Plaza. Instead, those who have temporarily relocated to the area are likely settling in as newly arrived locals.
Visits to Third Street Promenade from Pacific Palisades Increased in January 2025
If we examine the year-over-year (YoY) change in visits from specific ZIP codes, Placer data reveals a significant surge in visitation to Third Street Promenade from the Pacific Palisades during January 2025, with visits increasing by 20.4% compared to the same period last year.
Third Street Promenade Drew More Families and Affluent Visitors
Demographic analysis of the Third Street Promenade’s trade area also indicates that the shopping corridor drew a higher proportion of family households and more affluent audience segments – perhaps thanks to the influx of visitors from the Palisades.
Shopping Centers Serve As Oases of Normalcy
Amid the disruption caused by the wildfires, shopping centers have stepped in as steady community spaces rather than just retail venues. The uptick in foot traffic at locations like Third Street Promenade and Westfield Century City shows that these malls are serving as reliable hubs for daily routines and social connection, offering residents practical support as they navigate uncertain times.
Find out how retailers have played a crucial role in providing relief for those impacted by the devastating wildfires across the greater Los Angeles area.
Elizabeth Lafontaine
Feb 24, 2025
3 minutes
In the wake of the devastating wildfires across the greater Los Angeles area, retailers—both local and national—have played a crucial role in providing relief, comfort, and a sense of community for those impacted. Retail is an industry that touches consumers’ lives daily, often more frequently than most other businesses. Because retailers fulfill a wide range of needs, they have become essential partners in supporting communities facing unimaginable crises.
Retailers Transform Stores into Donation Hubs
In the immediate aftermath of the Palisades and Eaton Fires, retailers transformed their stores into donation hubs, offering displaced individuals essential items such as clothing and N95 masks. Major brands, including J.Crew, Gap Inc., and Free People, quickly repurposed their stores to serve as distribution centers. Free People even opened an entirely new shop in Santa Monica—Free Shop by Free People and FP Movement—where affected residents could book time slots to browse and collect necessary items. Beyond national retailers, Los Angeles-based brands also stepped up to support fire victims. Babyletto, a juvenile furniture brand, donated cribs to displaced families, while apparel company Big Bud Press launched new collections with proceeds benefiting the Pasadena Jobs Center.
While retail depends on consumerism, its role over the past month has extended beyond sales, making a profound impact on the local community. Many retailers in the discretionary sector opened their doors to directly assist affected families, demonstrating that physical retail spaces can be used for more than just commerce. By taking action on the ground rather than simply offering monetary donations, retailers provided immediate, tangible support to those in need.
Relief Initiatives at Gap, Babylist, and Alo Yoga
Three specific retail locations in Los Angeles exemplified this effort, with Placer’s data revealing just how meaningful their initiatives were. Gap’s Santa Monica store was among the first to pivot toward relief efforts, distributing new Gap merchandise and PPE to community members beginning on January 11th. Alo Yoga’s Beverly Hills location provided care kits to impacted residents between January 14th and 16th. Meanwhile, Babylist, an online registry service with a physical showroom in Beverly Hills, hosted donation days on January 21st and 28th, allowing displaced families to shop for free and replace lost items.
Placer’s foot traffic estimates suggest that these relief efforts were well-received and widely utilized. Each of these locations saw an increase in visits during the weeks their relief initiatives took place, surpassing the average January baseline. The data underscores how critical these retailer-driven efforts were in supporting Los Angeles families and providing much-needed aid during a difficult time.
More Visits From Greater Los Angeles Area During Alo Yoga’s Donation Event
During Alo Yoga’s donation event from January 14th to 16th, there was a noticeable increase in visitation from across the greater Los Angeles area, drawing new traffic beyond the Beverly Hills neighborhood. Compared to January baseline trends, the week of January 13th saw a higher share of visits originating from 3 to 10 miles away. More significantly, visits also increased from 10 to 30 miles away, likely including individuals affected by the Eaton Fire. In contrast, visits from over 250 miles away declined, underscoring the sharp drop in tourism to Los Angeles during the peak of the wildfire crisis.
Babylist’s Donation Efforts Help Young Families and Grandparents
Babylist’s LA showroom opened its doors to families in need, offering a space to replace essential baby items lost in the fires. These relief events attracted a different visitor mix than the store typically sees, providing immediate support for young families and grandparents. According to PersonaLive’s visitor segmentation, during the weeks Babylist hosted its relief events, there was a higher distribution of visits from Educated Urbanites, Young Professionals, and Sunset Boomers. In contrast, the full-month January data showed a greater share of visits from Ultra Wealthy Families. This shift highlights how retailer-led relief efforts were actively utilized by those in need, reinforcing the critical role local businesses can play in supporting communities during crises.
Brick-and-Mortar Stores As Essential Community Assets
Retailers play a vital role in the communities they serve, and their ability to provide immediate support in Los Angeles through physical stores allowed for faster distribution of donations and aid. The best-in-class relief strategies implemented by these retailers should serve as a blueprint for others to follow, reinforcing the importance of brick-and-mortar stores as essential community assets during times of crisis and recovery.
2024 was a challenging year for the restaurant industry, marked by increased competition from other food retail channels, intensified value wars, and rising operational costs, all of which contributed to a surge in bankruptcies. The start of 2025 has been equally difficult.
Despite these challenges, our data continues to show strong consumer demand for dining out. However, the way consumers interact with restaurants is evolving more than ever before. Below, we highlight several key shifts in consumer behavior that restaurant operators, suppliers, and investors should consider in the year ahead.
How to Balance Convenience Versus Experience?
With Starbucks' renewed focus on its coffeehouse roots under CEO Brian Niccol, an important question emerges: have today’s restaurants become too complex? Starbucks originally built its brand as a “third place” away from home and work – an inviting space for customers to gather. However, this focus began shifting about a decade ago with the rollout of Mobile Order and Pay. As e-commerce surged in the early 2010s, consumers became accustomed to making purchases online or via mobile apps, making digital ordering a necessity for most retailers and restaurants. Yet, prioritizing convenience through mobile ordering and pickup created a disconnect with Starbucks’ experience-driven identity, leading to friction between its convenience-oriented and experience-focused customers.
This tension between experience and convenience has been a challenge for many restaurant operators in recent years. It explains why QSR chains have reduced store footprints while expanding drive-thru capacity, why fast-casual and casual-dining restaurants have increasingly adopted pickup and drive-thru windows, and why many chains now allocate dedicated space for delivery orders. Even Darden, long resistant to third-party delivery, ultimately embraced it to adapt to changing consumer behavior.
Visitation trends in 2024 reinforced the difficulty of balancing experience and convenience within the same restaurant model. Among chains with more than 100 locations, those with the highest year-over-year (YoY) growth in visits per location were largely drive-thru specialists, such as Raising Cane’s, In-N-Out Burger, 7 Brew Coffee, and PJ’s Coffee. Meanwhile, non-drive-thru leaders like CAVA and Chipotle thrived by focusing on customization, underscoring that consumers are willing to pay a premium for personalized experiences that align with their preferences.
The rise of convenience-based restaurants does not signal the end of experiential dining – far from it. Below, we’ve outlined monthly year-over-year (YoY) visit trends for major restaurant categories in 2024. While QSR value wars dominated industry headlines throughout the year, casual- and fine-dining chains actually outperformed the QSR segment in YoY visit growth.
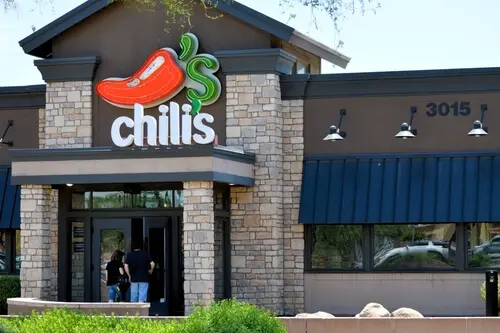
Some of this success can be attributed to well-executed promotions, such as Chili’s "3 for Me" deal – which helped the chain finish just behind Raising Cane’s in visit-per-location growth for 2024 – and Buffalo Wild Wings’ "All You Can Eat Wings" promotion. However, the strong YoY performance of fine-dining chains further underscores that experience-driven dining remained highly in demand throughout the year.
We also see this trend reflected in dwell time across the restaurant industry. With the rise of drive-thru and takeout orders during and after the pandemic, combined with advancements in mobile ordering technology, it’s no surprise that dwell times for limited-service restaurants have remained below pre-pandemic levels (below). However, the opposite is happening in full-service restaurant categories, where dwell times are on par with or even exceeding pre-pandemic levels.
While many casual dining chains have seen an increase in takeout and delivery orders over the past few years, the growth of experiential dining concepts like Kura Sushi and GEN Korean BBQ, along with the continued expansion of eatertainment venues such as Topgolf, Puttshack, and Pinstripes—where dwell times often exceed 90 minutes—has helped maintain overall category dwell times. Meanwhile, the increase in dwell time for fine-dining establishments suggests that guests are making the most of their time when dining out, reinforcing the growing consumer preference for experience over convenience.
“Familiarity” and Its Impact on New Store Contribution
We've previously highlighted the importance of familiarity in consumer dining decisions, particularly in a challenging macroeconomic environment. With years of elevated inflation across food, rent, healthcare, and insurance, consumers have fewer discretionary dollars to spend. As a result, when they choose to dine out, they gravitate toward brands they know and trust.
In collaboration with the team at Bloomberg Second Measure, we analyzed data on the percentage of revenue generated from new customers at both full-service and limited-service restaurants. Our findings revealed a noticeable decline in new customer revenue during the second half of 2024, further reinforcing the idea that consumers are prioritizing familiarity when making dining choices.
This preference for familiar brands may be creating challenges for restaurant chains expanding into new markets. Traditionally, a new restaurant location in an unfamiliar market could expect to generate around 75% of the sales/visits seen in an established market—after an initial “honeymoon” phase when consumers try the brand for the first time. However, our data suggests that visit trends for restaurants entering new markets are now significantly lower than historical averages. Unsurprisingly, many operators have told us that their 2025 expansion plans will prioritize in-filling existing markets rather than expanding into new ones.
Portillo’s—the Chicago-based chain known for its Chicago-style hot dogs, Italian beef sandwiches, and char-grilled burgers—has experienced mixed visit trends when entering new markets. Below, we present visit per location trends for Portillo’s nationwide, in its home market of Chicago, and in several states where it has expanded in recent years. In its latest investor presentation, Portillo’s acknowledged that its average unit volumes are highest in its home market ($11.3 million in sales per location), compared to other Midwest markets ($6.0 million) and Sunbelt locations ($6.6 million). While these figures are still strong, they reflect the broader challenge that many restaurant brands face when expanding beyond their core markets.
Conclusion
As the restaurant industry navigates 2025, operators must strike a delicate balance between convenience and experience while adapting to shifting consumer preferences. The demand for dining out remains strong, but consumers are making more intentional choices, favoring trusted brands and prioritizing either speed and efficiency or immersive, experiential dining. At the same time, new market expansion presents growing challenges, with visit trends suggesting a preference for familiarity over novelty. As brands refine their strategies, those that successfully integrate innovation with operational excellence—whether through streamlined digital convenience, compelling promotions, or differentiated in-store experiences—will be best positioned for long-term success in an increasingly competitive landscape.
Sprouts Farmers Market and Dutch Bros. have seen impressive foot traffic growth over the past few years. We analyzed their visitation metrics for 2024 to understand what’s driving their continued success.
Continued Visit Dominance
Both Sprouts and Dutch Bros. posted impressive visitation numbers throughout 2024, with visits for the full year elevated by 7.3% and 15.8%, respectively, compared to 2023. This momentum caps off several years of sustained growth – particularly for Dutch Bros. – which has expanded rapidly while maintaining consistent foot traffic increases. And though average visits per location at Dutch Bros. were slightly down YoY in 2024, the visit gaps were relatively modest – indicating that the chain is succeeding in expanding with minimal cannibalization to its existing venues.
Sprouts also expanded with dozens of new stores over the past year – and the chain’s foot traffic metrics suggest strong shopper interest in these openings. The health-forward grocer saw visits per location rise in the second half of the year, capping off Q4 2024 with a 5.0% YoY increase.
The two chains have kept their visit growth going into the new year. Weekly visits to both Sprouts and Dutch Bros. grew all weeks analyzed, a promising sign as 2025 gets underway.
New Smoothie Kings
Smoothies are having a major moment, fueled by the growing nationwide focus on health and wellness – an area where Sprouts has successfully positioned itself as a leader. Now, the chain is doubling down on its wellness-focused strategy by introducing smoothies at select locations.
Many Sprouts locations offer smoothies to go – but the chain has also been investing in in-store smoothie bars, allowing shoppers to enjoy a fresh, healthy drink while browsing or take one on the go. Visits to a Cerritos, California location jumped following the introduction of a smoothie bar in January 2025, with YoY monthly visits exceeding the Sprouts nationwide average for the first time in the analyzed period – perhaps thanks to excited reviews posted on social media.
By offering smoothies that are more affordable than some of the viral options trending online, Sprouts is solidifying itself as a go-to destination for shoppers seeking wellness-driven choices without breaking the bank.
Dutch Bros.’ Morning Brew
While Sprouts is expanding into new beverage categories, Dutch Bros is focusing on building out its food offerings. The chain has traditionally been strongest in the afternoon and evening, bucking the usual trends for caffeine-focused brands. To that end, Dutch Bros. has focused on attracting more morning visitors, both by expanding its mobile ordering capabilities and by testing a new food menu in select locations.
The data suggests that the company’s focus on the morning daypart may amplify changes in Dutch Bros. consumer behavior that are already underway. Between January 2024 and January 2025, the share of visits during morning hours saw a small but meaningful uptick. The share of visits during the 6:00 AM to 11:00 AM daypart grew from 28.4% to 29.5% of daily visits, while the share of evening visits (4:00 PM to 9:00 PM) decreased. While the brand still maintains a strong presence later in the day, this shift could be a sign that Dutch Bros is successfully nudging consumers toward earlier-day coffee runs.
Drink To That
Sprouts and Dutch Bros. are thriving by gearing their offerings to their customer bases. By leaning into health-forward beverages and early-morning visits, the two chains are driving visits and interest.
Find out how off-price category leaders, including Burlington, Marshalls, and T.J. Maxx closed out 2024 and began 2025.
Ezra Carmel
Feb 19, 2025
4 minutes
The off-price apparel space remains well-positioned as consumers continue to favor budget-friendly retailers. We dive into the latest location intelligence for the space – and category leaders Burlington, Marshalls, Ross Dress for Less, and T.J. Maxx – to explore how the segment closed out 2024 and started off in 2025.
Increased Visitation to Off-Price Leaders
The leaders of the off-price apparel space – Burlington, Marshalls, Ross Dress for Less, and T.J. Maxx – drove the success of the category last year. In 2024, Burlington’s visits increased (7.9%), as did visits to Marshalls (5.3%), Ross (0.7%) and T.J. Maxx (4.9%).
Zooming into H2 2024 reveals that Burlington, Marshalls, and T.J. Maxx saw consistent YoY visit growth. And although Ross Dress for Less saw mild visit gaps for some of the period, all four off-price apparel chains analyzed started the new year on a high note with January 2025 visits up across the board compared to the previous year.
Marmaxx, Ross, and Burlington expanded their real estate footprints in 2024 – likely contributing to the chains’ YoY visit increases. And all four retailers’ have plans to continue their expansion strategies in the coming years – putting them on a foot traffic growth trajectory for 2025.
Off-Price Tips the Scales
The foot traffic growth of Burlington, Marmaxx, and Ross plays a significant role in the success of the off-price category, which has steadily increased its share of total apparel visits.
In Q4 2024, the off-price apparel category claimed a majority of the combined off-price and our traditional apparel category visits (51.9%) for the first time since at least 2019. This demonstrates the segment’s strong holiday performance and continued resilience in the face of economic headwinds for both consumers and retailers.
Regional Paths to Success
Diving deeper into the foot traffic for Burlington, Ross, Marshalls, and T.J. Maxx highlights robust nationwide visits as well as several regional preferences among consumers.
Nationwide, Ross claimed the lion’s share of visits between the four chains in Q4 2024 (31.0%), followed by T.J. Maxx (28.0%), Marshalls (23.1%), and Burlington (17.9%).
Analysis of the chains’ share of visits by CBSA reveals that Ross claimed the greatest share of visits in a majority of the West and Southwest, as well as in many large metropolises. Meanwhile, T.J. Maxx appeared to be the most-visited brand in many CBSAs throughout the Eastern United States, while Marshalls appeared to be the preferred brand in the Mid-Atlantic.
And despite claiming 17.9% of combined visits to the four off-price apparel chains, Burlington received the largest share of visits in only two CBSAs – Midland, TX and Anchorage, AK, which could be due to the brand’s long-term smaller-format strategy. While a smaller-format store may have less physical real estate (and therefore visitor potential) than the typical Marmaxx and Ross location, it affords Burlington the flexibility to source locations with strong economics that can drive productivity for the brand in markets nationwide.
All four brands have a robust presence nationwide, yet regional preferences and variations in real estate footprints highlight the different paths to success in the off-price space.
Taking Off
The off-price apparel segment is thriving in 2025, with Burlington, Marshalls, Ross, and T.J. Maxx leading the charge. Consumers continue to prioritize value, fueling steady foot traffic growth and cementing off-price retailers as key players in the apparel space. Each brand is carving out its own regional strongholds while expanding its footprint, setting the stage for even greater success in the year ahead.
How shifting consumer priorities are reshaping value perceptions across QSR, fast casual, and casual chains.
July 9, 2026
The New Definition of Value
As consumer sentiment hovers near historic lows and the cost of goods remains elevated, value has become a defining theme across the dining industry. Yet within the sector's diverse restaurant categories – and for individual brands – the question is no longer whether consumers are seeking value, but what value actually means. A closer look at chains across the industry suggests that, amid ongoing economic pressure, perceptions of value are evolving. For some consumers, value may be tied to affordability and promotions; for others, it may come from quality, convenience, or experience. The result is a market with multiple paths to winning consumer traffic.
Dining Traffic Remains Unstable in 2026
After an uneven but largely resilient 2025, dining traffic in 2026 tipped into a sustained decline.
Monthly visits to the overall dining industry have trailed year-ago levels throughout 2026, with February standing as the lone exception. That month saw a 3.7% year-over-year (YoY) increase in visits, driven in part by comparisons to the period of initial tariff announcements in early 2025. But broader trends remained challenged, and May's 2.5% YoY decline marked the steepest monthly drop of the past twelve months as rising gas prices and weakening consumer sentiment appear to have added pressure to an industry already navigating a difficult environment.
Breaking Down the Industry
These headwinds, though, have not landed evenly. Across the dining sector, some segments have faced more intense pressure than others, with much of the divide coming down to how consumers are perceiving value against experience.
QSR’s Value Proposition Under Pressure From Grocery Stores & Superstores
Over the past several years, inflation and rising menu prices have gradually weakened a cost-based value proposition that has long been central to the QSR segment. More recently, elevated gas prices have added another deterrent, making a trip through the drive-thru a less compelling choice for some consumers.
Strong performance at grocery stores and superstores suggests that competition for share-of-stomach is increasingly extending beyond traditional restaurant rivals. With expanding selections of ready-to-eat and pre-prepared meals, these channels are offering consumers a combination of value, convenience, and quality that can increasingly match limited-service dining options. At the same time, ongoing pressure on household budgets appears to be driving more consumers toward lower-cost meals made at home, creating additional headwinds for the QSR segment.
Fine Dining and the Fast Casual Middle Hold Firm
Yet for many consumers, there is still a time and place for dining out, and in the face of mounting economic pressure, several dining formats have found foot traffic success. Fine dining has posted traffic growth in nearly every month of 2026, with March standing as the lone exception. That decline was likely influenced by a calendar shift, as March 2026 contained one fewer Saturday than March 2025 – a meaningful headwind for full-service restaurants given the outsized role weekends play in driving visits. The segment's sustained growth points to the resilience of higher-income consumers and the enduring appeal of premium, occasion-driven dining experiences.
Fast casual and casual dining have also proven relatively resilient. The fast casual category saw positive YoY foot traffic in every month of 2026 so far, while casual dining's performance has rebounded since the March calendar shift that likely weighed on YoY traffic. A second calendar shift in May 2026 led to an extra Saturday in the month, which likely helped the segment's overall trend. These trends suggest that both fast casual and casual dining occupy an increasingly attractive middle ground where value is defined as a combination of affordability and experience. At the same time, years of menu price hikes at QSR chains have altered the cost equation in fast casual and casual dining's favor, narrowing the price gap between fast food and more elevated dining formats. As that gap has narrowed, consumers may be placing greater emphasis on experience and quality when deciding where to dine.
Inside the Playbooks of Fast Casual Standouts
The balance between price and elevated experience has made fast casual a favorite for value in the dining industry in 2026. A closer look at two of the segment's largest players, CAVA, a relatively young concept, and Chipotle, a legacy chain navigating operational challenges, shows how brands can deliver on that value proposition in different ways and win in today’s dining landscape.
Chipotle Creates Value With LTO Experiences and Loyalty Perks
Chipotle's traffic trends in 2026 have improved compared to 2025, with the brand offering a clear example of how fast casual brands can create value by pairing menu innovation with loyalty perks.
Chipotle outpaced the broader fast casual category in YoY visits nearly every week of 2026 so far. And the graph below shows that the chain's strongest traffic gains tended to coincide with major menu launches and loyalty initiatives – a key component of its ongoing "Recipe for Growth" strategy.
The return of fan-favorite Chicken al Pastor in the week of February 9, 2026 helped drive a 16.6% YoY increase in visits. Two months later, the launch of "Rewards on Repeat" – a refreshed loyalty program offering freebies upon sign-up – generated the period's largest weekly traffic gain, with visits rising 18.2% YoY. And the introduction of Honey Chicken on April 28 provided another boost, as the chain continued to rotate limited-time protein offerings and give customers reasons to return.
These performance peaks suggest that Chipotle has been particularly effective at pairing menu novelty with loyalty perks to reinforce a value proposition anchored by quality and experience.
Chipotle's "Recipe for Growth" Drives Traffic With Loyalty and LTO Launches
Year-over-Year Change in Weekly Visits, Chipotle vs. Fast Casual, Jan.–Jun. 2026
ChipotleFast Casual
Dashed lines mark key Chipotle promotional launch dates. Week-of dates shown; launches may have occurred mid-week.
Share
Embed:
CAVA Expansion and Differentiated Dining Experience
If Chipotle illustrates the power of menu innovation and loyalty-driven engagement, CAVA highlights a different approach to creating value – one rooted in variety, customization, and a consistently differentiated dining experience.
CAVA's overall visits climbed well above 20% YoY in every month of 2026, a pace largely driven by aggressive unit expansion. Meanwhile, same-store visits, which measure traffic at locations open for at least twelve months, sustained positive YoY growth – evidence of genuine demand at existing restaurants alongside a rapidly growing footprint.
While Chipotle leans on limited-time offers, CAVA's growth rests on a consistent, customizable experience. A deep roster of proteins paired with a wide range of bases, dips, and toppings, gives the chain built-in variety that helps keep the concept feeling fresh. In addition, CAVA's Mediterranean-inspired menu offers flavors and combinations that are less easily replicated at home, helping the brand maintain a differentiated experiential value proposition and drive growth.
O Though Chipotle and CAVA are at different points in their evolution and have taken different paths to growth, both highlight the enduring appeal of fast casual's balance of value and quality. In a dining environment where consumers are increasingly weighing cost against experience, the segment's ability to deliver on both has helped make it one of the industry's strongest-performing formats.
Casual Chains Thrive On Everyday Value
Fast casual isn't the only dining segment benefiting from consumers' evolving perception of value. In 2026, several casual dining chains have found success by pairing accessible price points with the elevated experience of a sit-down meal.
Brands such as BJ's Restaurant & Brewhouse, Chili's Grill & Bar, Bonefish Grill, Cicis, and The Cheesecake Factory all posted positive YoY visit growth in multiple months this year, demonstrating that even in a challenging economic environment, diners are motivated when they feel they are getting more in return. These results are particularly notable given the impact of calendar shifts, which weighed on March 2026 comparisons – and provided a tailwind to May performance.
Unlike many fast casual chains, these brands have not relied heavily on a steady stream of limited-time offers to drive traffic. While menu innovation remains part of the playbook, promotions often serve as ticket builders or engagement tools rather than primary traffic catalysts. Instead, these successful casual dining chains have focused on creating everyday value that diners can depend on, narrowing the price gap between limited-service restaurants and full-service dining.
The result is a value equation that encompasses table service, a more relaxed dining environment, and a place to socialize or celebrate an occasion. In an environment where consumers are increasingly weighing cost against overall experience, that combination appears to be helping several casual dining chains maintain positive traffic momentum.
The State of Dining in 2026
Although dining traffic has softened in 2026, the industry's performance suggests that consumers have not stopped spending on restaurants altogether. Instead, they have become more selective about where they dine and what they expect in return.
Across segments, the strongest performers have found different ways to deliver value. For some brands, that means menu innovation, loyalty engagement, and differentiated experiences. For others, it means dependable affordability paired with the service and atmosphere of a sit-down meal. As economic pressures continue to shape consumer behavior, the data suggests that value is no longer defined by price alone, but by the balance of cost, convenience, quality, and experience.
Find out where Americans are moving in 2026, why they're relocating, and how developers, investors, and retailers can stay ahead of the trends.
June 18, 2026
The Geography of Domestic Migration
During the pandemic and its aftermath, Americans were on the move. Millions left expensive coastal markets for lower-cost destinations across the Sun Belt, while boomtowns such as Bozeman, Boise, and Austin struggled to keep pace with the influx of new residents.
That wave of relocation has since cooled, as return-to-office mandates, higher mortgage rates, and a shrinking affordability gap between coastal cities and many COVID-era hotspots have dampened the incentive to move. But even in a slower market, domestic migration remains one of the most powerful forces shaping local economies, housing markets, and consumer demand.
This report leverages AI-powered location analytics to examine the relocation patterns reshaping the United States in 2026 – where Americans are moving, the demographic and economic forces driving those decisions, and how retailers, investors, developers, and policymakers can respond to the opportunities and challenges created by these shifts.
Which major metros are attracting the most new residents? Which pandemic-era standouts have seen growth stall or reverse? And what factors best predict a large metro area's domestic migration growth potential in 2026?
Interstate Flows: Which States Gained and Lost Residents?
South Carolina and Delaware Set the Pace
The latest statewide migration data shows that the slower relocation pace observed in 2024 persisted into 2025. No state recorded net inflows or outflows exceeding 0.7% of its starting population. And while several smaller states continued to attract new residents at meaningful rates, none of the nation's six most populous states saw net in-migration exceed 0.2%.
Among those smaller states, South Carolina and Delaware led the nation with net in-migration equal to 0.7% of their populations, followed by Idaho (0.6%), Maine (0.5%), Tennessee (0.4%), and North Carolina (0.3%). For most of these states, migration accelerated relative to 2024, though Delaware's inflow rate moderated slightly and North Carolina held steady.
Despite their differences, these states tend to offer a similar mix of lifestyle amenities, relatively low congestion, and opportunities for growth. Many also benefit from business-friendly climates, favorable taxpolicies, or housing costs that remain attractive relative to the higher-cost markets from which they draw new residents.
Vermont Trails Behind
At the other end of the spectrum was Vermont, which saw the nation’s largest net outflow as share of population in 2025, losing 0.4% of its population to domestic relocation. The decline deepens a reversal that first emerged in 2024, when the state swung to a net loss of 0.2%, after attracting inflows of 0.8% and 0.5% in 2022 and 2023, respectively.
Vermont's reversal likely reflects a combination of factors, including return-to-office mandates and the waning appeal of remote work. Housing undersupply in the state may have alsocontributed, illustrating how important infrastructure investments are to sustaining migration gains over time.
South Carolina, Delaware, and Idaho Lead the Nation in Domestic Migration Growth in 2025
Net Domestic Migration as a Share of Each State's Starting Population, 2025
Net Migration by State
−0.4%0.0%0.7%
Top Migration Magnets
2024
2025
*Analysis for each year is from Jan. – Dec.
Share
Embed:
Florida Sees Accelerated Inflow as Legacy Exodus States Slow Losses
Among the nation's six most populous states, Florida was the only one to see accelerating net in-migration in 2025, attracting new residents equal to 0.2% of its starting population, up from 0.1% the year before. Texas, by contrast, slowed from 0.1% net in-migration in 2024 to essentially flat in 2025, highlighting the cooling of what was once one of the country's strongest pandemic-era migration magnets.
Meanwhile, the legacy "exodus" states continue to lose residents, but at a slower pace than in previous years. Illinois and California have seen their migration deficits steadily narrow, with further improvement in 2025. Between 2022 and 2025, Illinois moved from -0.8% → -0.2% → -0.2% → -0.1%, while California moved from -0.9% → -0.4% → -0.3% → -0.2%. And though New York has held steady at -0.2% over the past two years, this marks a significant moderation from 2022, when the state experienced net outmigration equal to 1.1% of its population.
Major Insights:
Smaller states dominated migration gains in 2025, led by South Carolina, Delaware, Idaho, Maine, Tennessee, and North Carolina.
Vermont posted the nation's largest outflow after attracting strong inflows just a few years earlier.
Florida was the only top-population state to see meaningful net in-migration in 2025.
Texas' migration boom continued to cool, with net in-migration falling to flat in 2025.
Outmigration from New York, Illinois, and California is slowing, but these states are still losing residents overall.
Zooming In: Net Migration Across Metro Boundaries
Statewide trends reveal important shifts, but a closer look at the nation's ten largest metropolitan areas suggests that broader interstate averages increasingly mask diverging local realities. Several metros are attracting residents through interstate domestic migration even when their states as a whole are experiencing little or no net migration growth.
Phoenix (+0.3%), for example, stood out as the nation's top-performing large metro in 2025, despite Arizona's absence from the list of leading migration destinations – with the majority of its inflow coming from out of state.
Dallas (+0.2%) ranked second, continuing its rebound from -0.1% in 2023 even as Texas' statewide migration gains cooled. Like Phoenix, Dallas drew a majority of its new residents from outside the state, underscoring its growing appeal as a national migration destination. Houston, meanwhile, moved in the opposite direction, falling from 0.1% net in-migration in 2023 to -0.1% in 2025. While it is too early to call this a sustained reversal, the divergence between the two metros may reflect Dallas's growing pull as a corporate magnet alongside rising housing costs and weather-related challenges in Houston.
Metro-level data also suggests that the pandemic-era "big-city exodus" narrative is continuing to fade. Los Angeles improved from -0.8% in 2023 to -0.3% in 2025, while New York held steady at -0.3% after improving in 2024. Even Miami (-0.6%), which ranked last among major metros despite Florida's continued statewide gains, saw its outflows moderate from 2023 levels. And while Illinois continued to post net outmigration, Chicago (0.0%) reached migration neutrality in 2025 after recording losses in both 2023 and 2024.
Major Insights:
Phoenix was the nation's top large-metro migration destination in 2025.
Dallas gained momentum while Houston lost ground, highlighting growing divergence within Texas.
Miami continued to post the largest outflows among major metros despite Florida's broader migration success.
The LosAngeles, Chicago, and the New York metro areas all saw migration losses ease.
Florida Dominates Large Metros
Despite Miami's struggles – and Florida’s relatively modest 0.2% inflow – a look beyond the top 10 large metros reveals that the Sunshine State is home to six of the nation's eight fastest-growing large metros nationwide.
Those top-performing metros, defined as CBSAs with 500K+ residents that added at least 0.8% of their population through net domestic migration over the past year, share a similar profile: lower housing costs, retiree appeal, suburban density, and an easy drive to a larger economic hub.
Much of the growth of these Florida metro areas, however, is being fueled from within Florida itself. While major out-of-state metros such as New York (6.1%) and Chicago (2.0%) remained important sources of new residents, nearly half of the net migration into Florida's top destination metros came from elsewhere in the state. In 2025, Miami (22.5%), Orlando (13.0%), Tampa (5.8%), and Naples (4.2%) together accounted for 45.5% of the net positive migration feeding these fast-growing markets.
Major Insights:
Mid-sized Florida metros dominate the national migration leaderboard.
Florida's migration pipeline is overwhelmingly driven by in-state movement.
The Affordability Factor
The migration flows feeding the nation’s fastest-growing large metros suggest that affordability remains a powerful driver of domestic relocation.
In 2025, seven of the eight top destination metros analyzed above had lower typical home values than their largest feeder markets. Lakeland–Winter Haven, FL, for example, had a typical home value of $313.4K in December 2024, compared with $404.9K in Orlando and $380.2K in Tampa – its two largest sources of net migration. Even North Port–Bradenton–Sarasota, FL – the most expensive Florida metro in this group – drew its largest share of net migration from the New York metro area, where home values are substantially higher.
The lone exception was Charleston–North Charleston, SC, whose largest source of net migration was Baltimore – a market with lower typical home values than the destination. Even in Charleston, however, affordability appears to have played a role. New York, a significantly more expensive market, ranked a close second in 2025, accounting for 6.5% of net positive migration into Charleston, just behind Baltimore’s 6.8%.
While housing costs are only one factor influencing migration decisions, the data suggests that households continue to gravitate toward markets where homeownership is comparatively more attainable than in the places they leave behind.
Most Top Migration Destinations Pull Residents From More Expensive Housing Markets
Typical Home Values* in Top Feeder Markets to Destination Hubs, 2025
Destination HubTop Feeder Market
*Typical home value based on Zillow Research’s Zillow Home Value Index (ZHVI) for Dec. 2024, immediately preceding the analyzed migration period (Jan.–Dec. 2025).
Share
Embed:
Major Insights:
Most high-growth metros attract residents from more expensive housing markets.
Relative affordability continues to be a primary driver of domestic migration.
Demographics Over Dollars
But as important as affordability is in explaining today’s domestic migration patterns, age appears to be an even stronger determinant of where people choose to relocate.
Among mid-sized and large metros (250K+ residents) experiencing significant population shifts – defined as gaining or losing at least 1.0% of their starting population through domestic migration over the past two years – households are increasingly moving toward older, more established communities.
The data reveals a clear negative relationship between migration performance and age differential – a metric calculated by subtracting the median age of the destination market from the weighted median age of its feeder markets. Negative values indicate movement toward older communities, while positive values indicate movement toward younger ones. In other words, the metros attracting the strongest migration inflows tend to be older than the markets sending them residents.
The data also shows a clear positive relationship between migration performance and retiree concentration. Metros with larger shares of residents aged 65 and older generally saw stronger migration gains over the past two years, while younger metros tended to attract fewer newcomers. This suggests that retiree-driven relocation has become an increasingly important driver of migration. At the same time, the influx of younger residents points to the broader appeal of these communities, which offer a mix of affordability, amenities, and lifestyle advantages.
Relocators are Gravitating Towards Older, More Established Communities – With Retirees Helping Fuel the Trend
Net Migration as Share of Starting Population, 2024–2025*
Net Migration vs. Weighted Age Differential
Net Migration vs. Share of Residents 65+
*Analysis includes metro areas with 250K+ residents and domestic migration gains or losses of at least 1.0% during the study period. Weighted Age Differential compares the destination market’s median age with the weighted median age of origin markets, with positive values indicating migration toward younger markets and negative values indicating migration toward older markets. Age data: Census ACS 2020–2024.
Share
Embed:
Major Insights:
People are moving to older, more established communities.
Markets with larger 65+ populations are attracting more domestic relocators.
The New Migration Map: Strategic Implications
The pandemic-era urban exodus is giving way to a more nuanced migration landscape. Large urban markets are stabilizing, while growth is increasingly concentrated in smaller states, secondary metros, and intra-state corridors. Affordability remains a powerful pull, but retirees, lifestyle considerations, and local market dynamics are also playing an increasingly important role in where Americans choose to live.
To capitalize on these shifts in 2026, civic leaders, commercial real estate (CRE) investors, retailers, and developers should:
Monitor smaller states gaining migration momentum. Among the nation's most populous states, only Florida saw (modest) net in-migration in 2025. By contrast, smaller states like South Carolina, Delaware, Idaho, Maine, Tennessee, and North Carolina continued to attract substantial inflow. Investors, retailers, and developers that monitor these patterns may be better positioned to identify emerging growth opportunities.
Invest ahead of growth. Vermont's reversal shows how important it is for housing supply and infrastructure to keep pace with demand. High-growth communities will also need the retail, healthcare, transportation, and service capacity required to support expanding populations.
Look beyond state-level narratives that can obscure local opportunities. Florida led the nation in fast-growing large metros even as Miami lost residents, while Texas saw Dallas gain momentum as Houston fell behind. Likewise, although Arizona was not a top destination state, Phoenix remained the nation's leading major metro for migration gains.
Treat states as migration ecosystems. In Florida, for example, domestic migration is increasingly redistributed across a network of interconnected metros – as costs rise in one market, residents shift to nearby alternatives. Tracking these spillover effects can help identify tomorrow's growth markets before they show up in the rankings.
Don't write off major urban markets. While New York, Los Angeles, and Miami continue to experience net outflows – and Chicago has yet to return to positive territory – migration losses have moderated substantially from their pandemic-era peaks. As these markets stabilize, investments in livability, affordability, and quality of life could help strengthen their long-term competitiveness and economic vitality.
Protect affordability as a competitive advantage. Across the nation's fastest-growing metros, migration flows continue to move from more expensive housing markets to less expensive ones. As demand rises, preserving attainable housing will be critical to maintaining the cost advantages that attract new residents and businesses.
Prepare for a retiree-driven demographic realignment. Older Americans are playing an outsized role in shaping domestic migration patterns, but the communities attracting them are increasingly appealing to a broader range of households as well. As these markets grow, demand is likely to increase for healthcare, recreation, hospitality, and housing, creating opportunities across a wide range of sectors.
Explore key signals guiding data-driven site selection from brands actively expanding their brick-and-mortar footprints.
May 21, 2026
Predicting The Next Best Location
Across segments, retail and dining expansions converge on a common set of priorities, including identifying markets with strong demand, ensuring alignment with target audiences, and leveraging local consumer behavior to drive synergy. Using AI-powered location intelligence, we analyzed five expanding brands and segments to uncover the core principles driving successful site selection.
1. Identifying Sustainable Growth in an Increasingly Saturated Market
Nationwide visits to coffee chains are up in 2026, with established brands and newcomers alike seeing their traffic increase as consumer headwinds lead some to shift their discretionary spend towards more affordable indulgences. But past visit growth does not necessarily indicate future opportunity – it may instead signal market saturation. Relying solely on overall visit trends to guide expansion could lead chains into highly competitive markets where existing supply already meets demand.
For example, analyzing traffic trends in 10 major metro areas where coffee visits increased year-over-year (YoY) in Q1 2026 reveals significant gaps between overall traffic trends and per-location demand. In some CBSAs, overall traffic growth significantly outpaced per-location traffic trends – suggesting that supply is already meeting (or exceeding) demand and limiting room for new coffee locations despite overall category growth. But in other metro areas, where overall visit growth appears smaller, per-location traffic is actually booming – indicating that the underlying demand is resilient enough to support additional coffee concepts.
These patterns highlight the importance of looking beyond topline growth to identify where true whitespace still exists.
Strategic Takeaways:
Relying solely on aggregate category performance can obscure regional white space. A market-level view may reveal opportunities for stronger returns in areas where consumer demand is gaining momentum.
Combining overall visit and visits per location data offers a more complete view of where demand is both strong and sustainable.
2. Ensuring Demographic Alignment on the Hyperlocal Level
Effective site selection matches both regional and local demographics to a brand’s target customer, supporting performance and reinforcing positioning. But even in well-aligned metros, results depend on site-level precision – locations where the trade area visitor profile most closely reflects the brand’s core audience are best positioned to drive incremental upside.
An analysis of Alo locations in the DC area suggests that the company is adopting this strategy. Within the already high-income metro area of Washington-Arlington-Alexandria, individual Alo Yoga stores are placed in centers that draw even more affluent visitors – maximizing the revenue potential of each location.
In fact, Alo's newest stores in the metro area – One Loudoun and Bethesda Row – drive traffic from households with higher median incomes than even the established area locations. This signals a clear focus on premium retail corridors and affluent consumer segments, which reinforces the brand’s positioning while capturing higher-spending customers at the site level.
Strategic Takeaways:
Beyond traffic potential, effective site selection requires a clear understanding of both regional and hyperlocal demographics, as well as the brand’s target audience.
As brands expand, aligning locations with core customer bases can drive success while reinforcing brand positioning.
3. Finding Retail Nodes With Complementary Visitation Patterns
Beyond driving traffic potential and demographic alignment, site selection should also ensure that a brand’s identity and operating model are well matched to the visitation patterns of prospective locations. Barnes & Noble offers a clear example. The company’s ongoing resurgence has relied in part on repositioning itself as a local cultural and social hub, with a stronger emphasis on local curation and community-driven events.
And analyzing Barnes & Noble’s 2026 openings shows a clear tilt toward centers with a higher share of local traffic than the chain average – supporting its shift away from a purely transactional retail model toward a more community-centric experience built around local curation, events, and repeat visitation. By prioritizing locally driven centers, the company’s site selection strategy not only captures relevant traffic but also reinforces its broader repositioning as a neighborhood-oriented brand.
Strategic Takeaways:
Site selection strategy should look to align a brand’s identity and operating model with real-world visitation patterns at prospective locations.
For brands leaning into local curation, choosing centers with predominantly nearby visitors may be the key to performance and preserving brand identity.
4. Understanding the Benefits of Competitor Proximity
Effective site selection recognizes that proximity to competitors can function as a demand driver, amplifying traffic rather than diluting it.
In practice, this often takes the form of clustering – deliberately locating near similar or complementary concepts to capture shared demand. Shake Shack provides a clear example. Analyzing the chain's store fleet shows that many locations sit near other QSR and fast-casual concepts, creating opportunities to capture dining-based traffic. At the same time, strong cross-visitation patterns indicate that these co-located brands share a common customer base, positioning the brand closer to consumers who are already likely to visit. And, at least for Shake Shack, this strategy appears to be working – traffic to the chain increased 19.9% YoY in Q1 2026.
Strategic Takeaways:
As in retail, co-tenancy in the restaurant space can be mutually beneficial – establishing a center as a dining destination, driving incremental traffic, and increasing a brand’s opportunities to win share-of-stomach.
Incorporating cross-visitation analysis into site selection helps pinpoint locations where target customers are already visiting nearby brands. Centers that already attract a brand’s overlapping customer base provide a stronger foundation for incremental growth.
5. Balancing Growth and Cannibalization Risk
Incorporating trade area analysis into site selection can also help determine whether a new location will generate new traffic or risk cannibalizing existing demand. Aldi, a rapidly expanding grocery chain, offers a relevant example.
The company opened a fourth Las Vegas store on S Decatur Blvd in October 2025, positioned between existing locations on W Craig Rd and S Rainbow Blvd, approximately eight miles from each. And analyzing the core trade area of each of the four Las Vegas locations indicated limited visitor cannibalization over the last six months, despite the stores’ close proximity. Only 6.2% and 7.6% of the S Decatur Blvd store’s trade area overlapped with the W Craig Rd and S Rainbow Blvd stores’ trade areas, respectively.
These findings show that there is no one-size-fits-all approach to store spacing – it varies by brand, category, and market. Analyzing a company’s existing store network alongside competitor density and overall demand can help determine how closely locations can be placed without hurting performance. In many cases – especially in high-frequency categories like grocery – markets can support stores that are closer together than expected.
Strategic Takeaways:
Site selection strategy needs to take into account local demand and visitation behavior typical of the category as a whole and of existing locations in particular.
Trade area analysis can reveal where a market allows for network densification without significant risk of visit cannibalization.


.svg)






.avif)