


.svg)


We’ve spent a lot of time this past year analyzing how consumer behavior has evolved across the broader food and essentials category, noting that consumers continue to shop a wide number of stores across multiple channels for food purchases. With the release of Placer Data Version 2.1, we thought we’d revisit the topic.
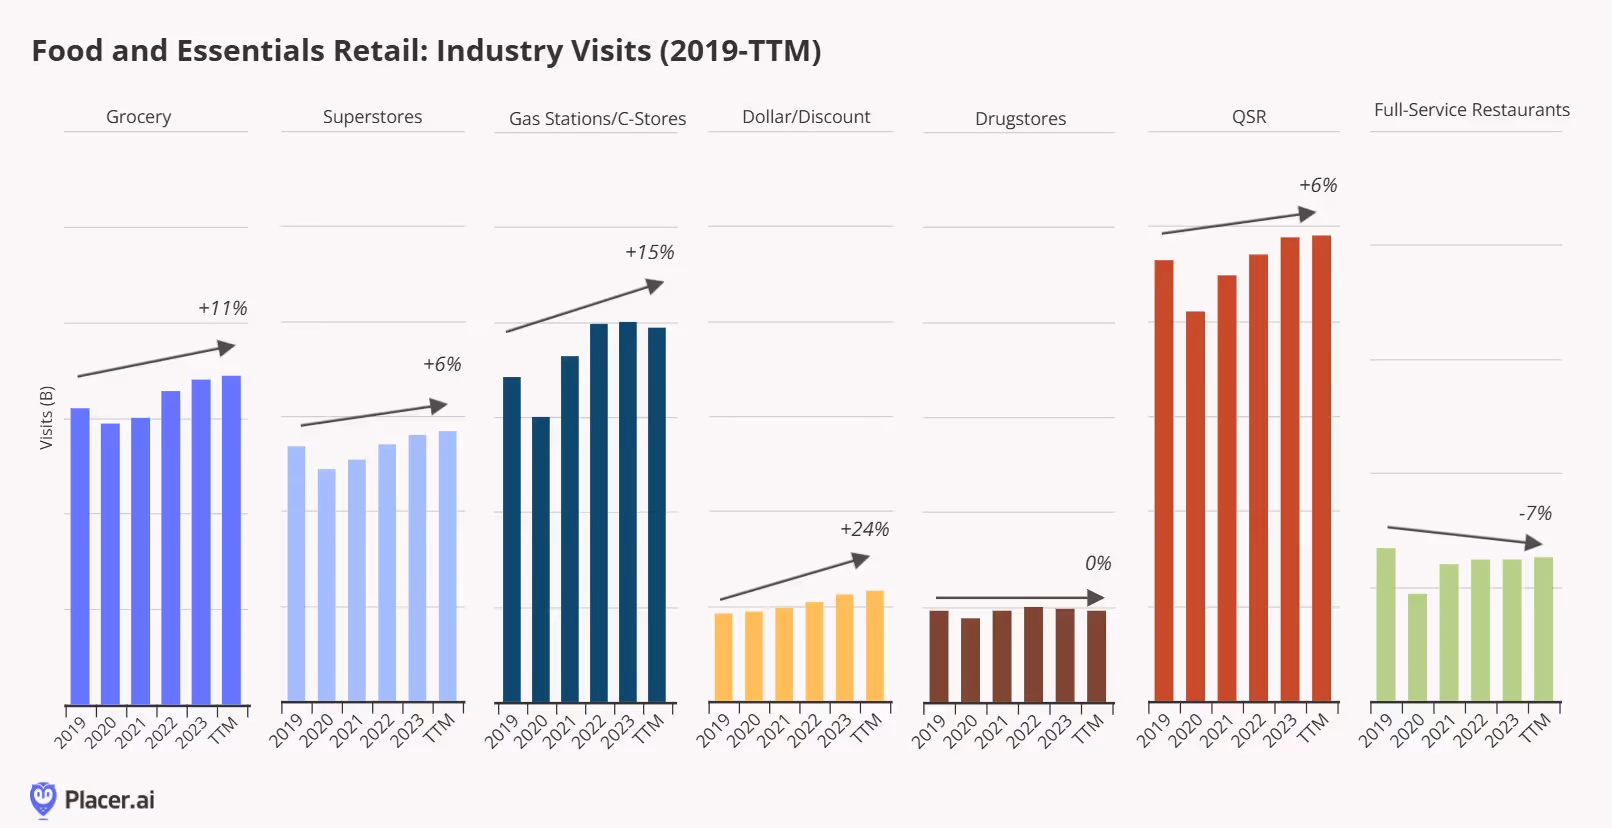
Below, we’ve presented total category visits for grocery stores (including both conventional and value grocery chains), superstores (including mass merchants and warehouse clubs), gas stations and convenience stores, dollar and discount stories (including liquidators), drugstores, quick-service restaurants (QSR), and full-service restaurants from 2019 to the trailing-twelve-month period (TTM0. A few takeaways: (1) Dollar stores saw the largest increase in total visits versus the other categories as they vastly expanded their food and consumables offering since 2019 to drive frequency and traffic. However, the pace of growth has decelerated materially over the past twelve months amid increased competitive pressure from superstore and value-oriented retailers like Aldi and 99 Cents Only Stores exiting the market; (2) drugstore visits have remained flat versus 2019 despite most of the major chains in the category undergoing store closure programs. We believe healthcare service and weight-loss drug prescriptions visits have helped to offset some of the store closures, although we continue to see some transfer of visits to other retail categories in this channel; and (3) the decline in full-service restaurants is partly due to permanent closures compared to 2019.
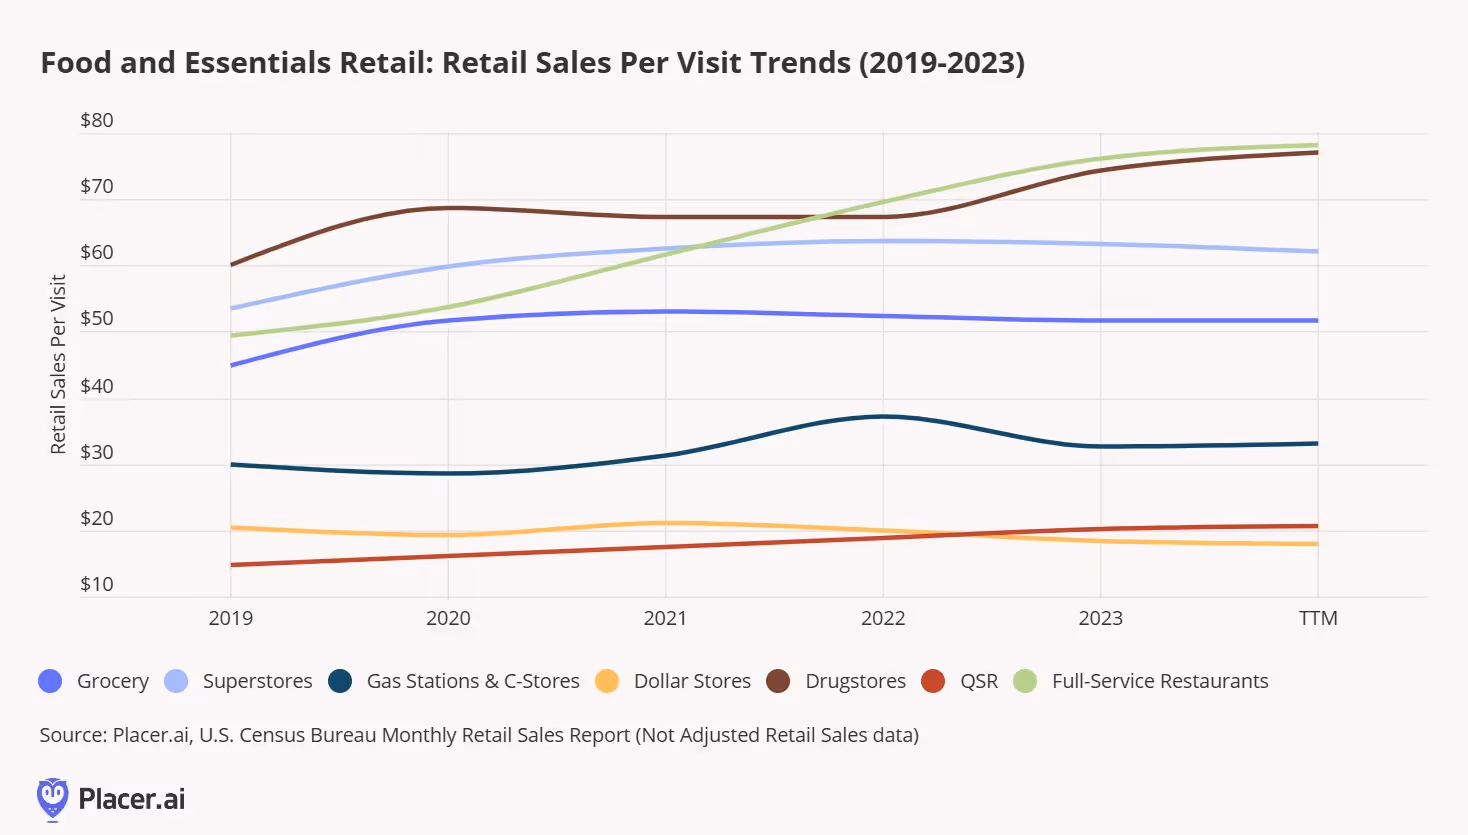
It gets interesting when we compare category-level retail sales data from the U.S. Census Bureau to our visitation data. Below, we’ve taken retail sales (on an unadjusted basis) for the same timeframe that we looked at above to analyze retail spend per visit. A few things stand out here: (1) Three categories saw the average retail sales per visit increase period of the analysis: QSR, full-service restaurants, and drugstores. The increase in drugstores is likely partly to due with the shift in sales mix to more healthcare related services, while the increase in QSR and full-service restaurant retail sales per visit likely explain this summer’s promotional activity to win back customers who traded to other channels; (2) The impact of increased promotional activity and fewer units purchased per transaction can be seen across the other categories, where we saw an inflection in retail sales per visit in 2023 and continuing into 2024 for most.
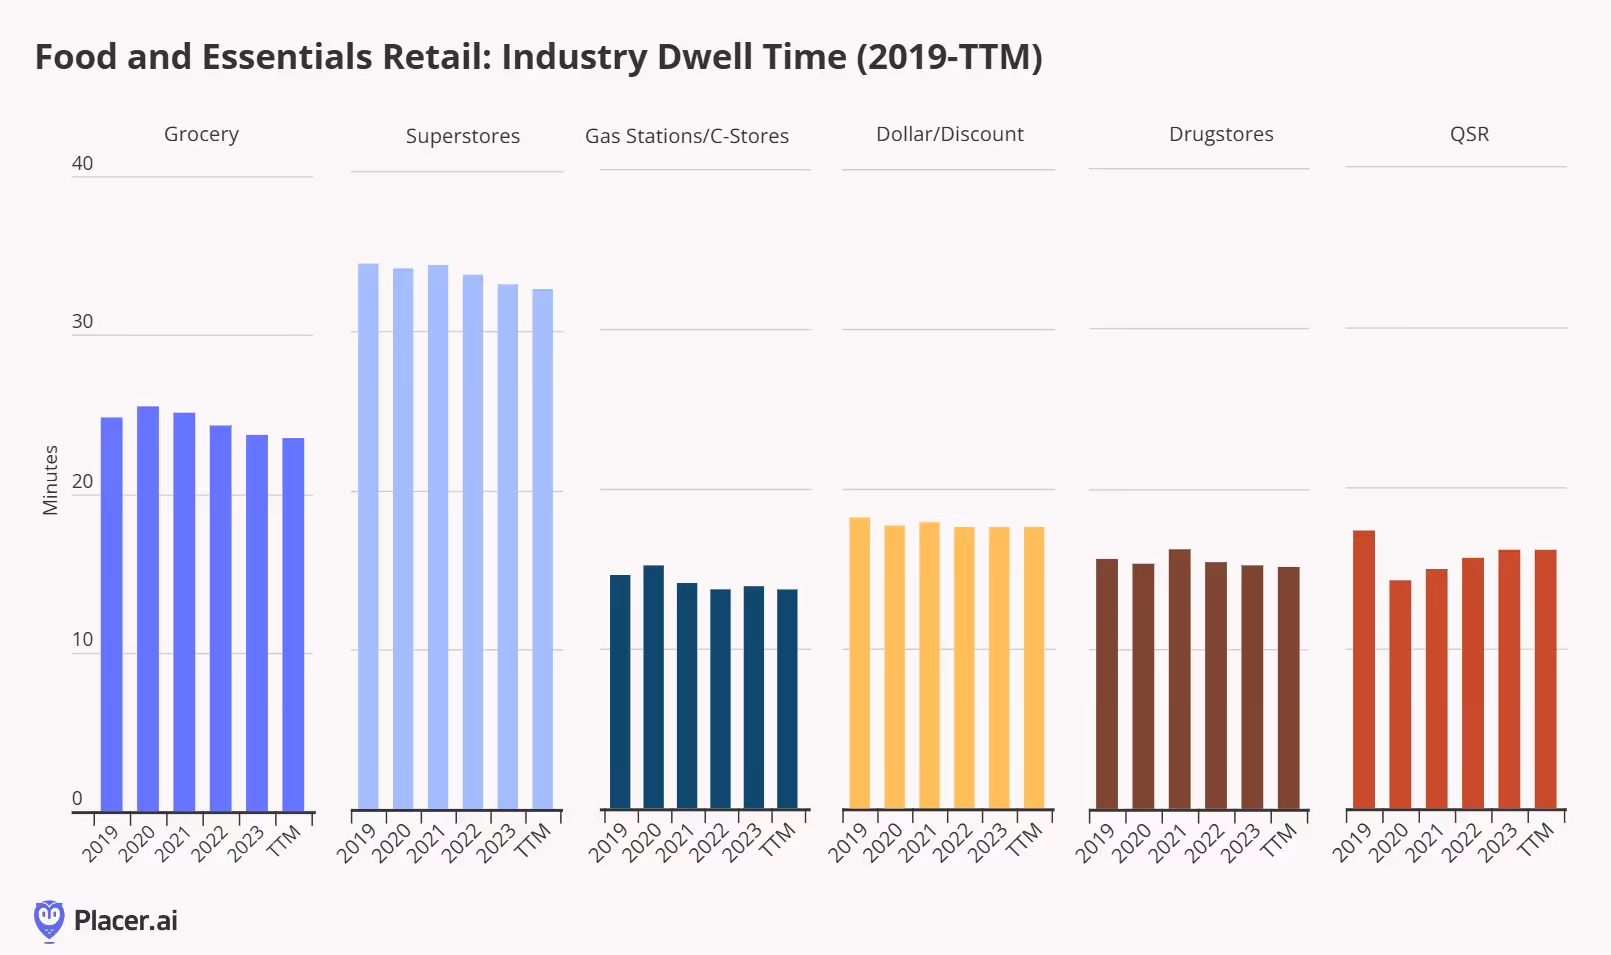
We also thought we’d assess dwell times across the different food and essentials retail categories (for purposes of this analysis, we’ve removed full-service restaurants, which have gone from an average dwell time of 52 minutes in 2019 to 49 minutes over the past twelve months, although we continue to see fine-dining chain dwell times exceed pre-pandemic levels as consumers look to maximize their experience when dining out). Here, we also see two callouts: (1) As consumers make food purchases across a wider number of channels, dwell time has decreased for most, matching the decrease in units per transaction that we've called out in the past. We did see dwell times increase for a few categories during the back half of 2023 which we believe was due to consumers engaging in price comparisons, but this has reversed in 2024 as consumers have now solidified new shopping routines (i.e., knowing what stores to get what deals); and (2) QSR dwell time remains below pre-pandemic levels, which isn’t surprising given that a higher percentage of transactions are now taking place via drive-thru and takeout orders. However, the increase in dwell time the past few years also suggests the potential for improved drive-thru optimization, a topic we recently analyzed.
It’s been quite a year for coffee and beverage chains. Heading into the year, we thought the category would see strong visitation trends due to store expansion, return-to-work, menu innovation, migration, and new approaches to promotional strategies. By and large, that has played out, with mid-single-digit visitation growth on a year-over-year basis (excluding January, which was negatively impacted by inclement weather across much of the country, and April, which was impacted by a calendar shift that resulted in four weekends this year versus five in the year-ago period).

Of course, the category has been much more nuanced. Category-leader Starbucks has seen visits moderate, which played a part in one of the more notable leadership changes in the restaurant industry history. However, as we’ve discussed over the past several years, the shift to drive-thru focused coffee and beverage chains has accounted for much of the growth. Below, we’ve presented visits per location for eight of the leading coffee and beverage chains. Drive-thru chains like Dutch Bros., Scooter’s Coffee, 7 Brew Coffee, and Biggby Coffee all remain well above their pre-pandemic visit per location trends, even as they continue to aggressively expand unit openings. On the other hand, traditional players like Starbucks, Dunkin’, Tim Hortons, and Caribou Coffee have all seen visit per location declines the past several years.
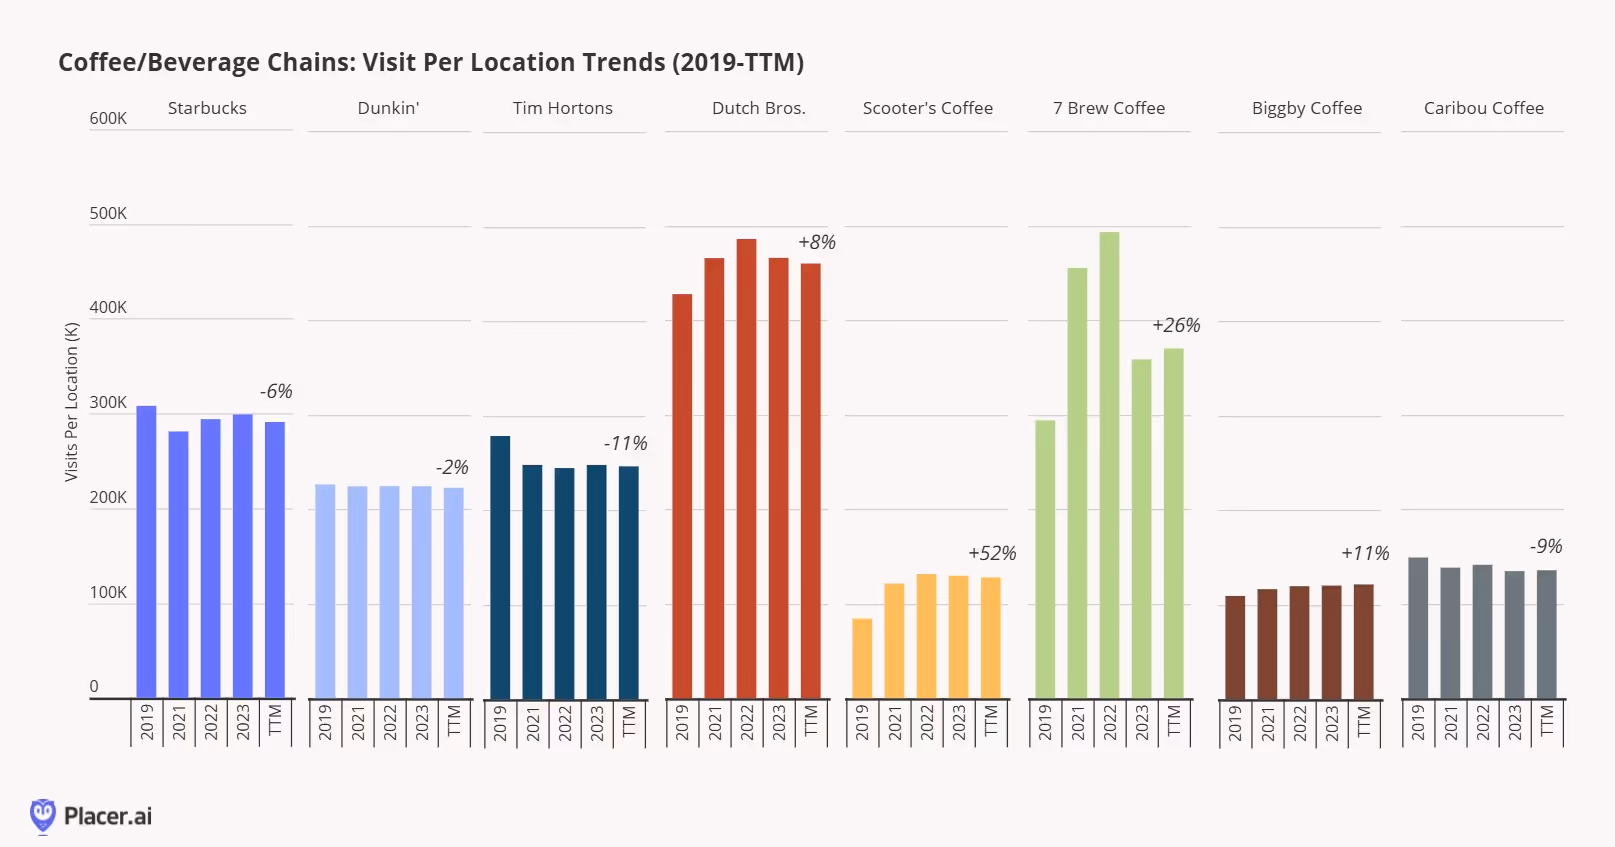
The success of these emergent competitors will likely result in further changes across Starbucks and other legacy coffee chains. New Starbucks CEO Brian Niccol has already made it clear that, going forward, Starbucks stores will have “a clear distinction between “to-go” and “for-here” service”, and we suspect other chains will follow suit.
Now that we’ve cleared the halfway point for 2024 with retailers preparing for back-to-school shopping (and Q2 2024 reporting season), we thought we’d take stock of where we stand from a retail category perspective. Last year, we looked at visit per location data by retail category at the halfway point for the year, which proved to be a useful indicator for what to expect for the rest of the year. We thought we’d revisit the analysis to give some perspective of what to expect in the months to come.
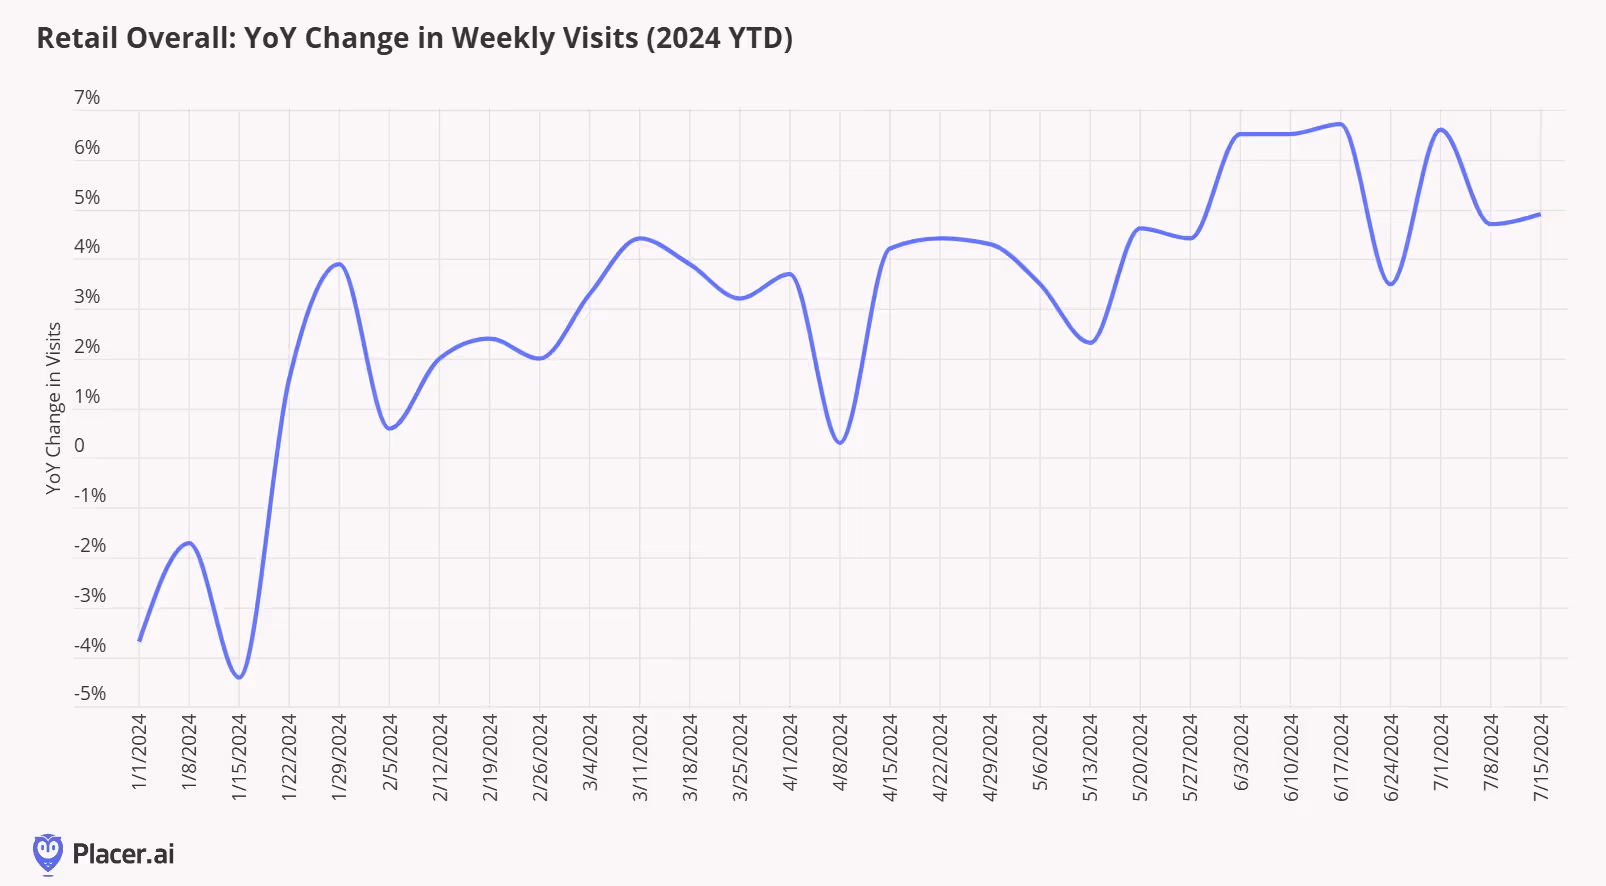
Needless to say, it’s been another volatile year for most retailers, with a tepid start to the year due to weather, followed by solid event/holiday spending in February/March, and a lackluster April (though partly the result of the Easter holiday calendar shift). May, June, and July visitation data offered some encouraging signs, with year-over-year visits increasing to a mid-single-digit level (according to Placer's Industry Trends report). Importantly, increased visits won’t necessarily translate into the same level of sales increases, as visits are continuously being driven by deals/lower price points for many categories.
Based on the positive trendline for retail in general, it shouldn’t be a surprise that the majority of the 25 retail categories we’ve presented show positive growth from a visit per location year-over-year perspective (below).
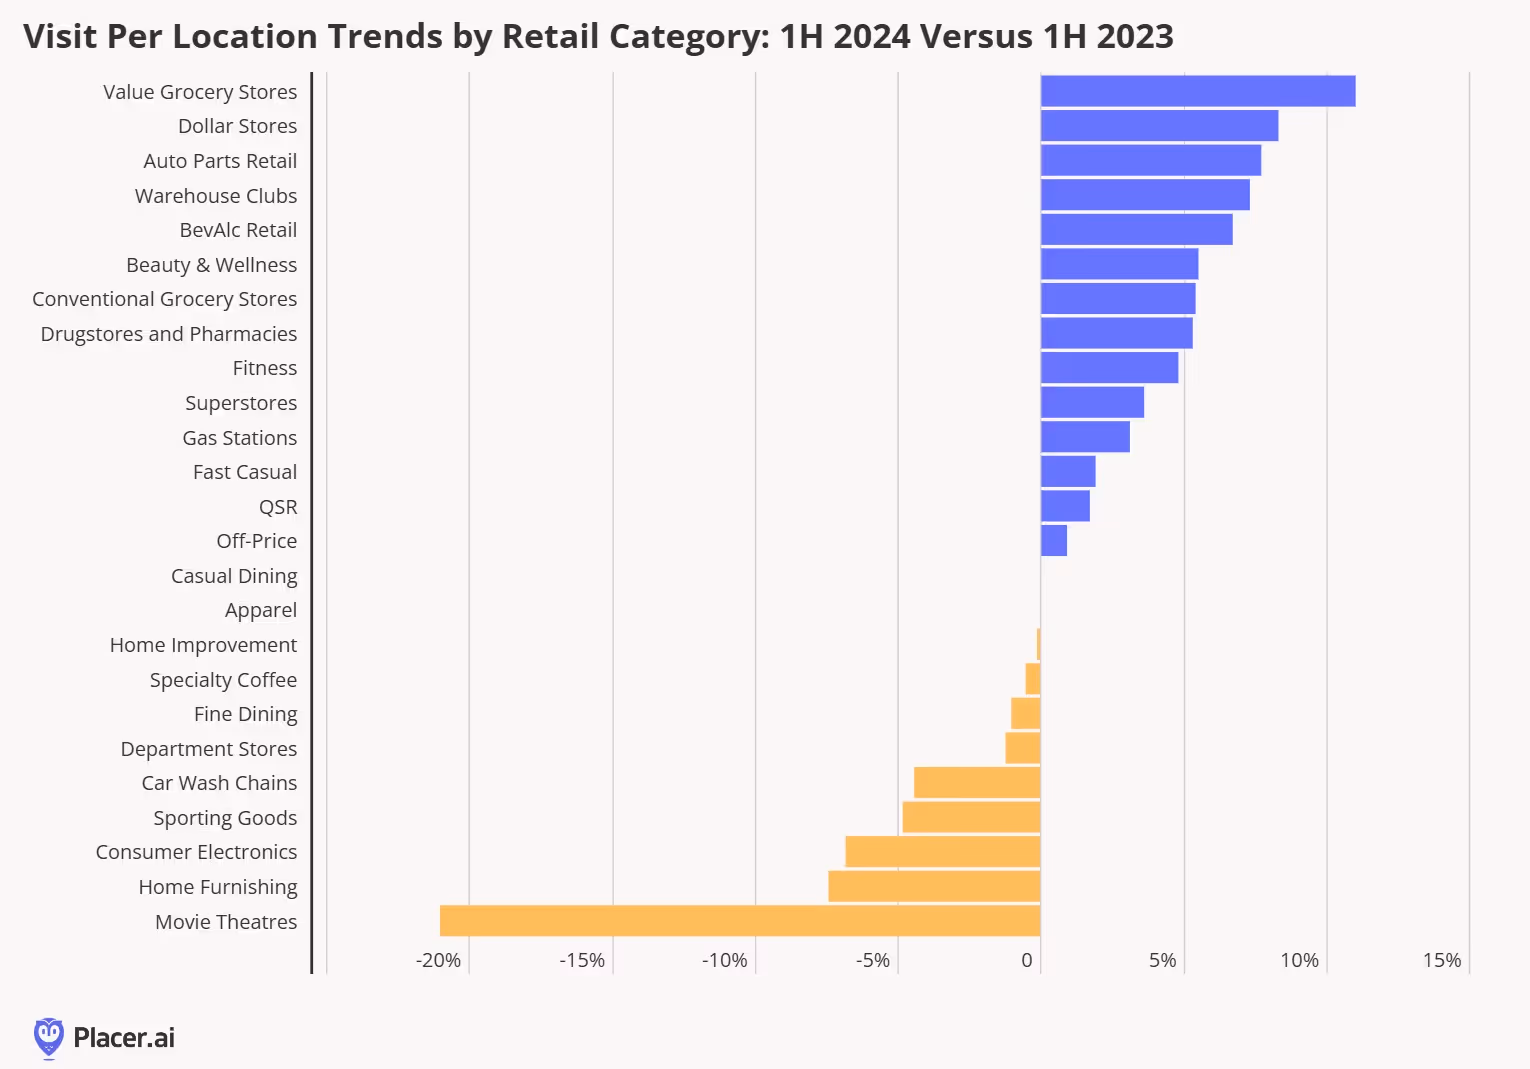
A few notable takeaways from the visit per location analysis:
- Value grocery chains saw the largest increase in visit per location during the first half of the year, up 11% year-over-year. We’ve spoken at length about consumers’ focus on value this year–even as food-at-home prices have moderated–so it should not be a surprise to see this category seeing the most visits per location. Both Aldi and Trader Joe’s have been key contributors to the increase in visits per location.
- Auto parts retail was one of the leading categories with respect to visits per location during the first half of 2024, but these trends may be moderating as we discuss below.
- Like many of the categories seeing visit per location growth, consumers continue to seek out warehouse clubs for value. We also believe that visits from younger trade areas have contributed to the increase in warehouse club visits per location, which we recently analyzed.
- Fitness was the top category for visit per location when we looked at pre- versus post-pandemic visit per location trend last year, but trends have moderated as consumers have pulled back on discretionary spending.
- There were mixed results across the restaurant category, with fast casual and QSR seeing year-over-year gains in visits per location, casual dining running about even to a year ago, and specialty coffee and fine dining seeing year-over-year declines. The QSR and fast casual gains largely reflect consumer’s focus on value, although the visit per location gains started to slow from March-May amid more competitive pricing from grocery stores, c-stores, and casual dining. However, with the rise of $5 bundled meals across the QSR category, we’ve seen visit per location trends rebound a bit in June (and into July). Specialty coffee is down year-over-year but is largely the result of fewer visits from “occasional” Starbucks visitors (which have overshadowed the nice gains we’ve seen from many drive-thru coffee chains this year). Fine dining is down year-over-year, but we continue to see visit per location gains for major holidays and events.
- The decline in movie theaters is not surprising given the lack of tentpole releases this year. However, these trends should improve amid a stronger release schedule.
Last year, our midpoint visit per location trends gave us some ideas as to how the second half of the year might shake out. Based on our first half 2024 visitation data, we expect (1) consumers to continue prioritize value in the second half of the year, especially those chains that have been able to create excitement/newness for their value assortment; (2) consumers will continue to prioritize holidays/events, which bodes well for back-to-school, Halloween, Thanksgiving, and Christmas; (3) we will continue to see better balance between experiences and goods this year (as we've discussed in the past).
Another year, another acquisition for casual-dining restaurant leader Darden Restaurants. Following up last year’s acquisition of Ruth’s Chris Steakhouse, Darden plans to acquire Chuy's for $605M (representing 10.3x Chuy’s trailing-twelve-month adjusted EBITDA of $59, or 8.2x adjusting for run-rate G&A costs that can be eliminated by adding Chuy’s to the Darden portfolio). Chuy’s is among the leading players in the Mexican casual-dining space in terms of revenue ($451M in revenue during 2023, adjusting for the extra week in the reporting calendar), average revenue per unit ($4.5M), and restaurant-level EBITDA (20%).
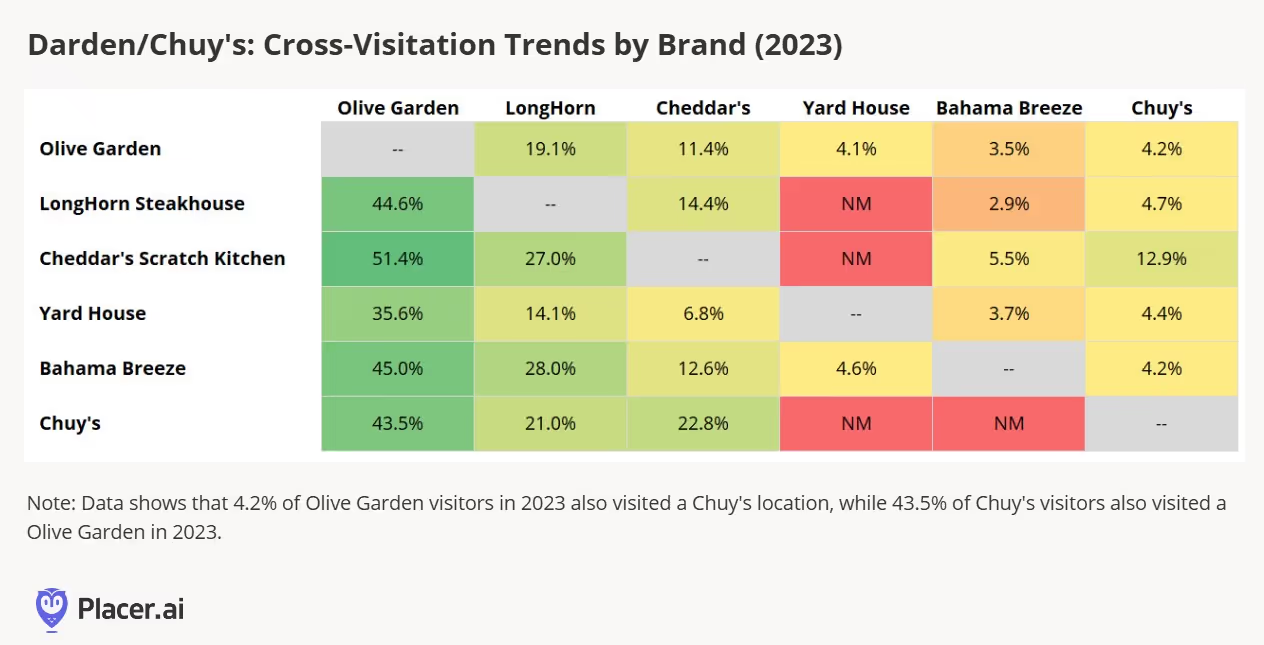
The acquisition of Chuy’s makes sense to us on a number of levels. First, and most obviously, Chuy’s fills a gap in the Darden portfolio. The company already owns the top player among casual-dining Italian chains (Olive Garden) and the number-two player in casual-dining steakhouses in addition to its other casual-dining (Cheddar’s, Yard House, Bahama Breeze) and fine-dining (Ruth’s Chris, The Capital Grille, Eddie V's, Seasons 52) concepts. By adding a casual-dining Mexican concept to its portfolio, we believe there will be an opportunity to attract incremental visitors. Below, we’ve presented cross visitation for Darden’s casual-dining brands and Chuy’s in 2023, and we see minimal overlap (although the cross-visit data is admittedly impacted by chain size and geography). According to our data, only 4%-5% of visitors to Darden’s existing restaurants also visited a Chuy’s location in 2023 (with the exception of Cheddar’s, which saw a 12.9% cross-visitation percentage).
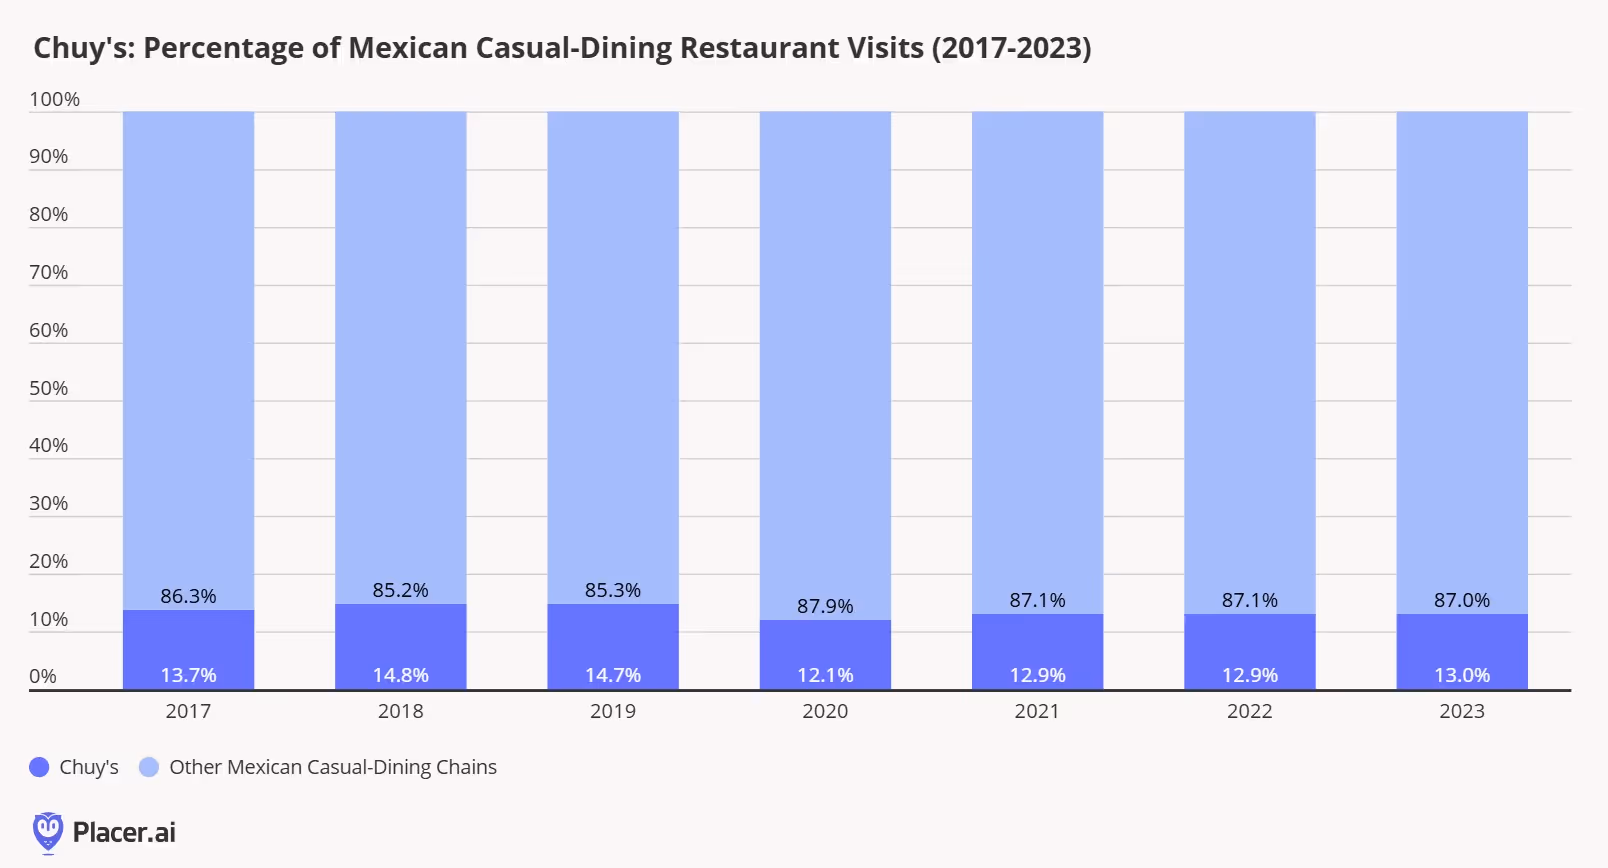
Second, despite Chuy’s being the leading player in the Mexican casual dining space, it’s still a relatively fragmented category that is ripe for consolidation. Below, we show the share of visitation data for Chuy’s compared to almost 20 other full-service Mexican restaurant chains from 2017-2023. Despite Chuy’s growth, its share of visits relative to the rest of the category has remained relatively healthy in the 12%-15% range. Backed by Darden’s purchasing, advertising, and real estate scale advantages, we see a meaningful opportunity to consolidate share of visits going forward, including visit per location improvement.
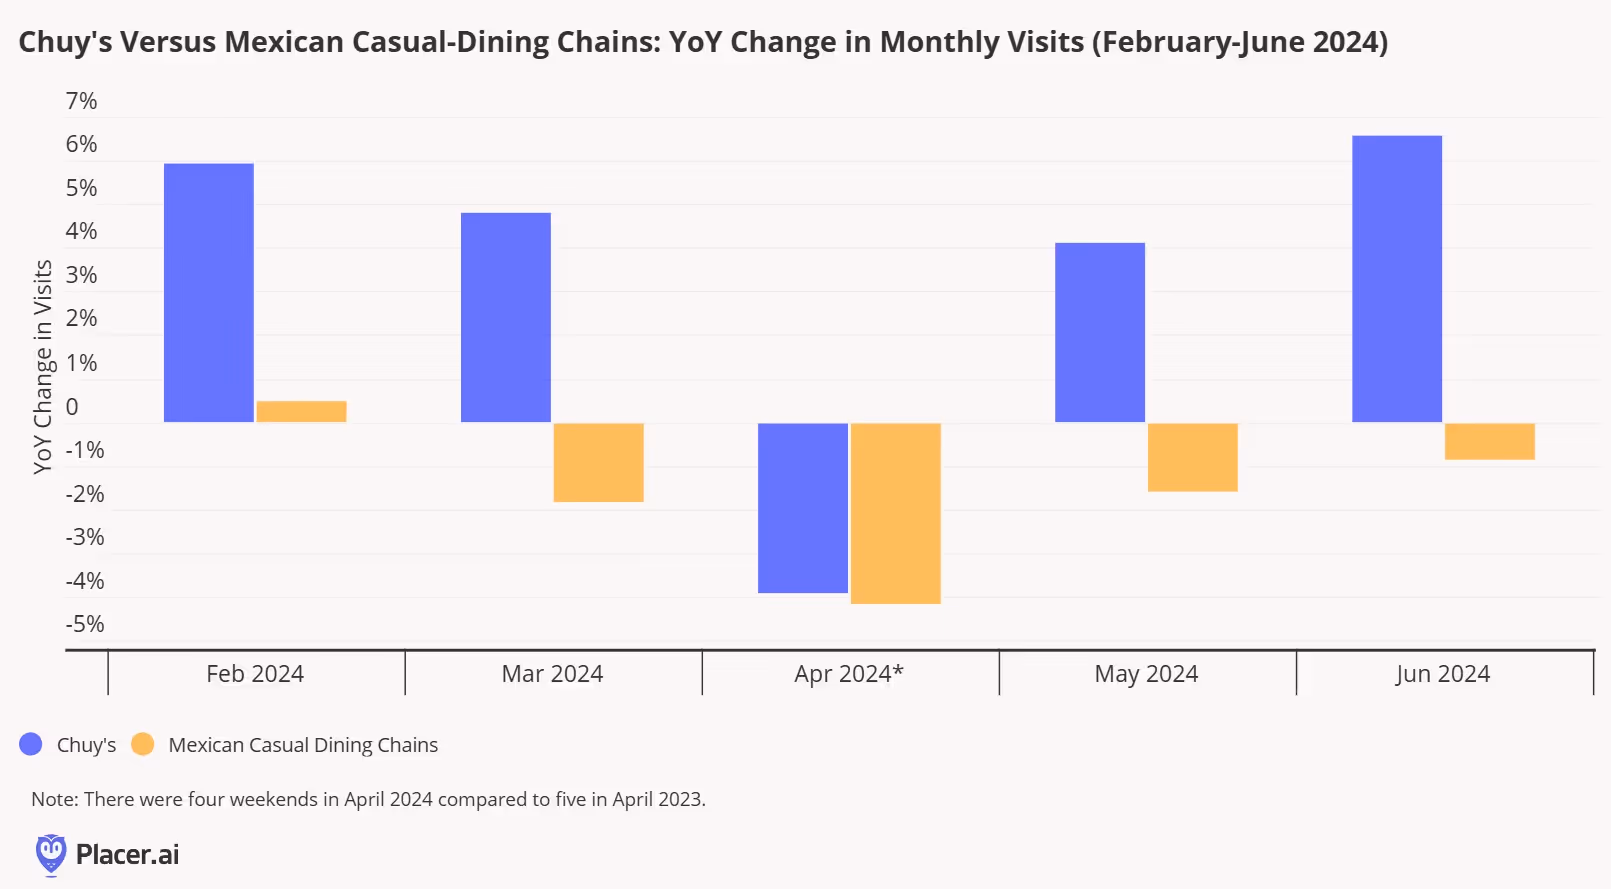
Chuy’s has been one of the leaders in the Mexican casual-dining chains in terms of visitation growth this year, outpacing monthly visits for the category by 5% on average (below). While integration will take time, applying guest experience, menu innovation, pricing, and marketing best practices from Darden should help to maintain this leadership.
At 101 company-owned restaurants today, Chuy’s is comparable to several other brands in the Darden portfolio (including Yard House at 88 units and Ruth’s Chris at 79). The chain is well established in Texas (44 company-owned units) but has a relatively small presence in other states across the Southeast and Midwest (below).
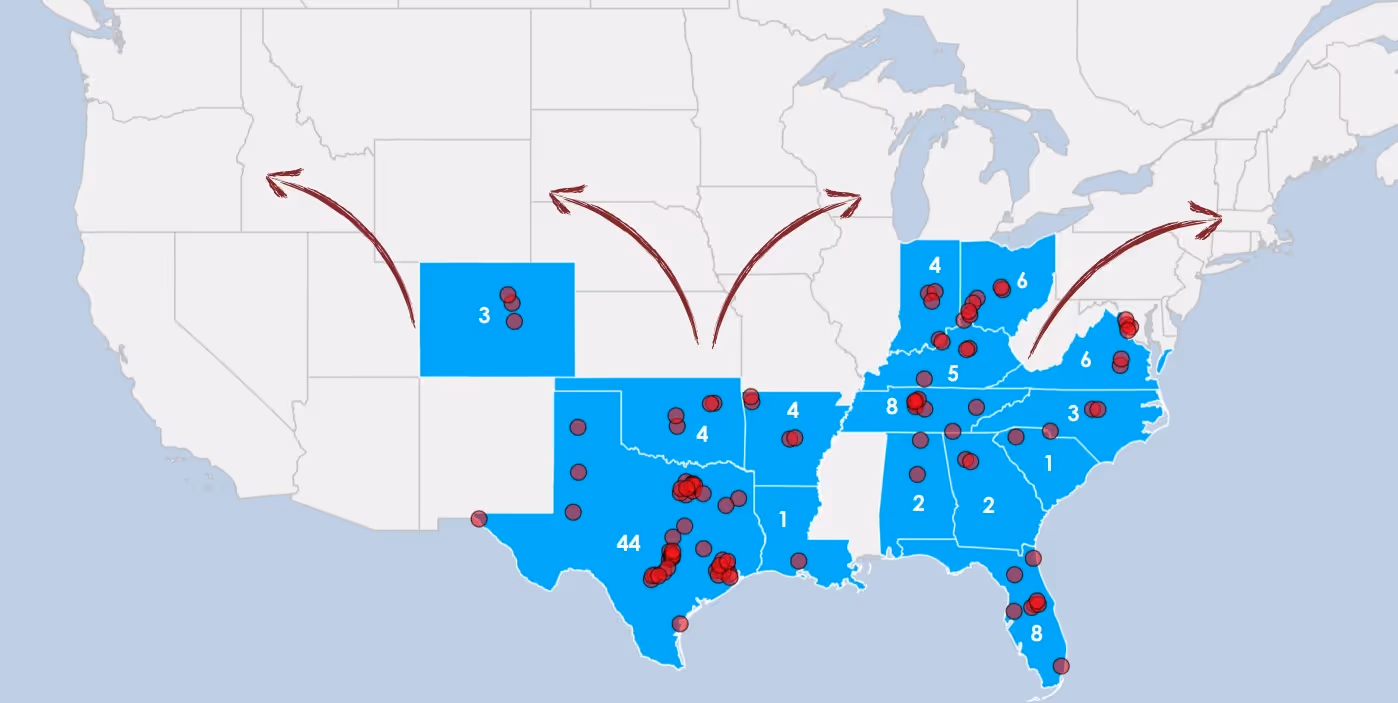
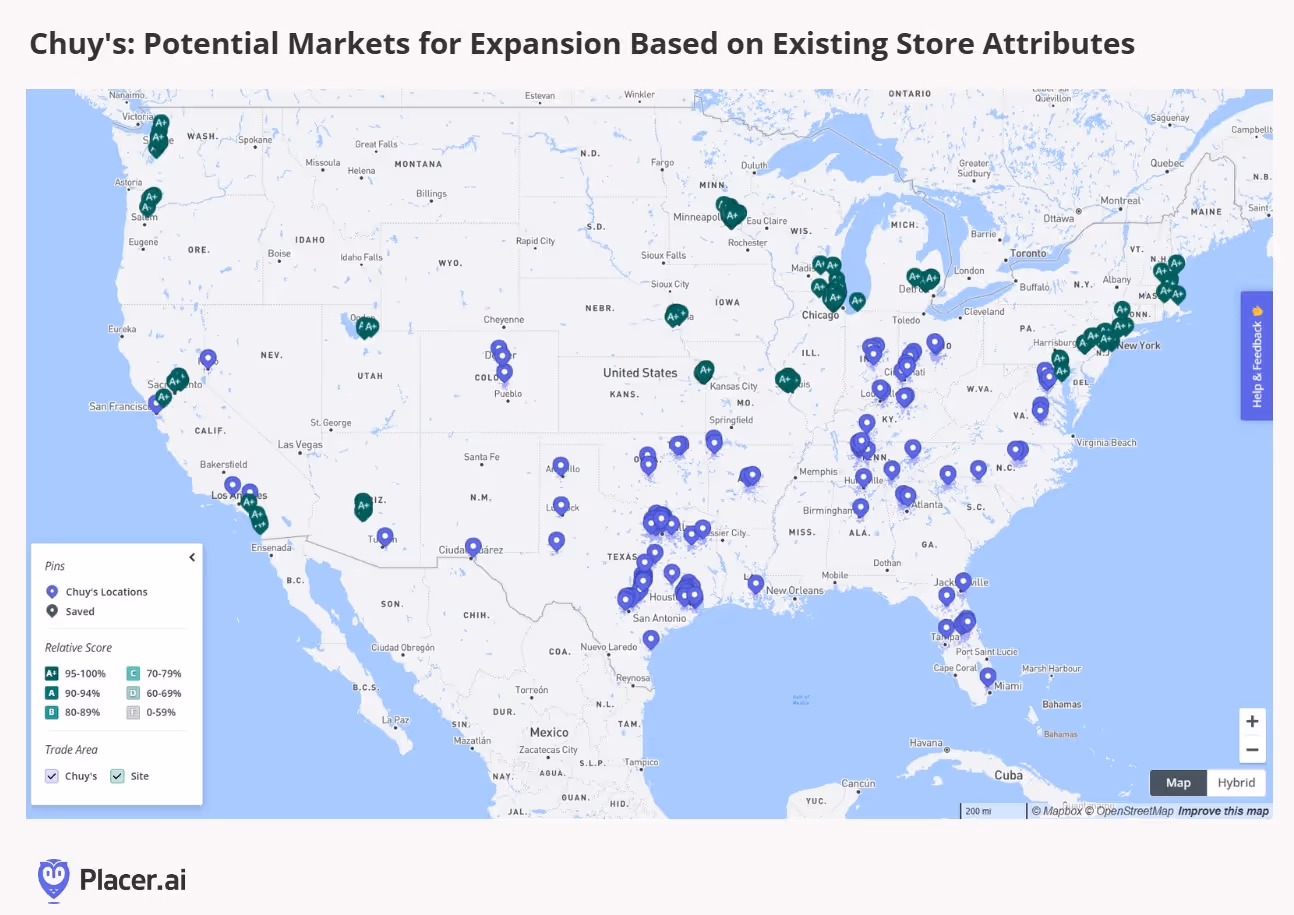
As Darden and Chuy’s management pointed out in a conference call to discuss the transaction, there are significant opportunities in both existing and new markets. Placer’s Site Selection tool (which identifies the characteristics of Chuy’s top locations–including trade area populations, demographic fit, cannibalization risk, and competition density–and finds markets/sites with similar characteristics) sees the best fits for expansion in several West, Midwest, and Northeast markets.
Food retail’s “Battle Royale” officially moved on to its next round with the introduction of McDonald’s $5 Meal Deal on June 25. We’ve previously discussed how value-oriented grocers have disrupted McDonald’s and the broader QSR category and how casual dining chains shot the first shots in this summer’s value wars with extreme value offerings, but given McDonald’s reach, we wanted to take a closer look at this promotion and its ripple effect across the food retail landscape.
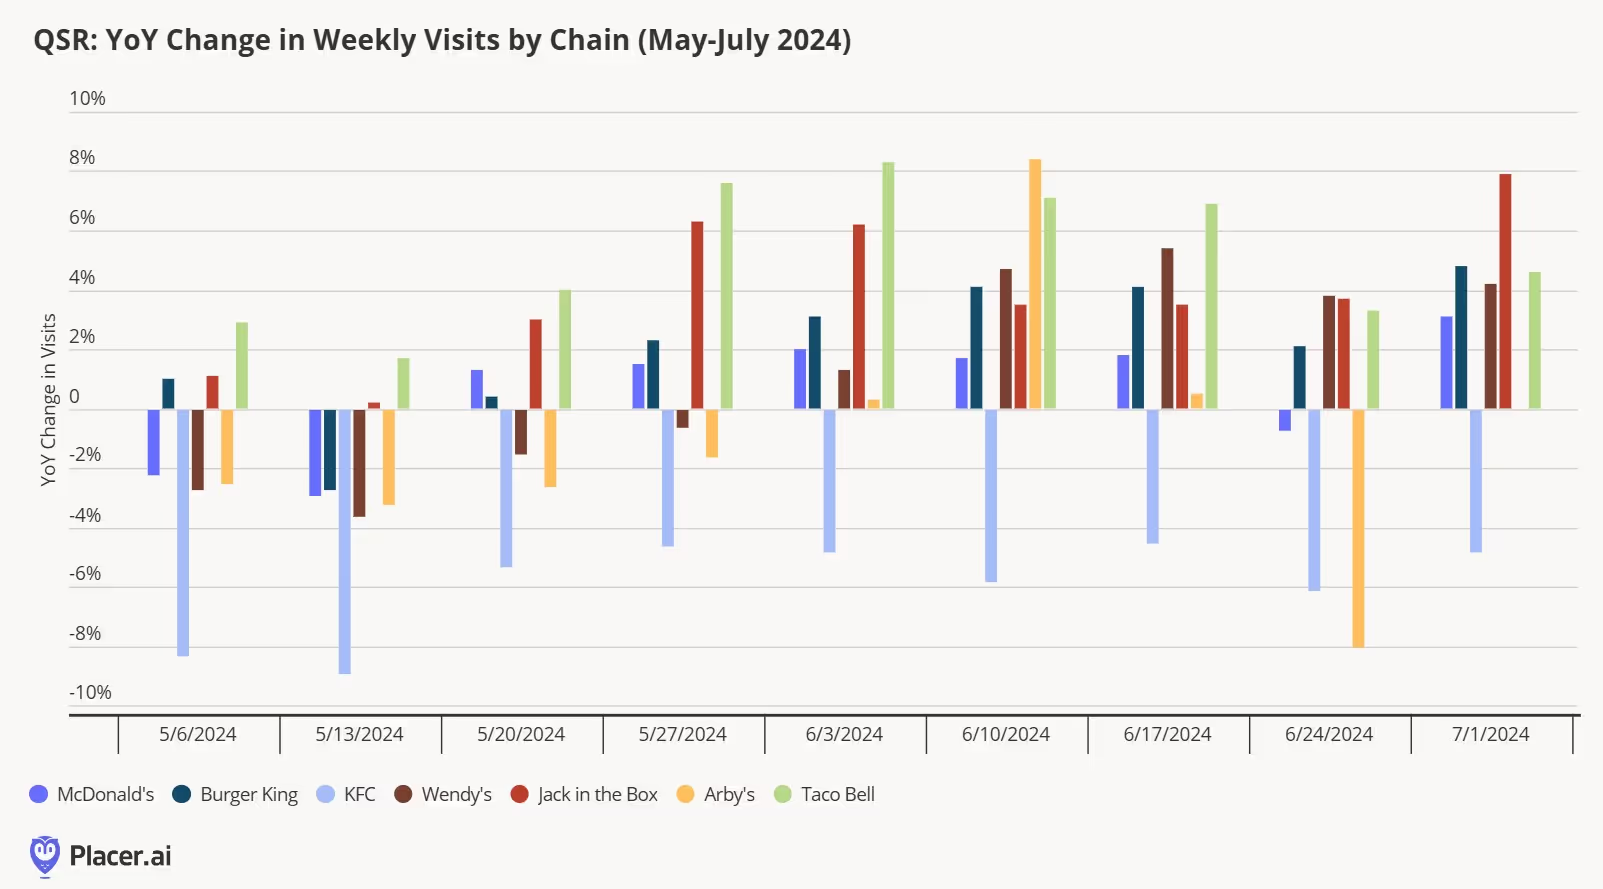
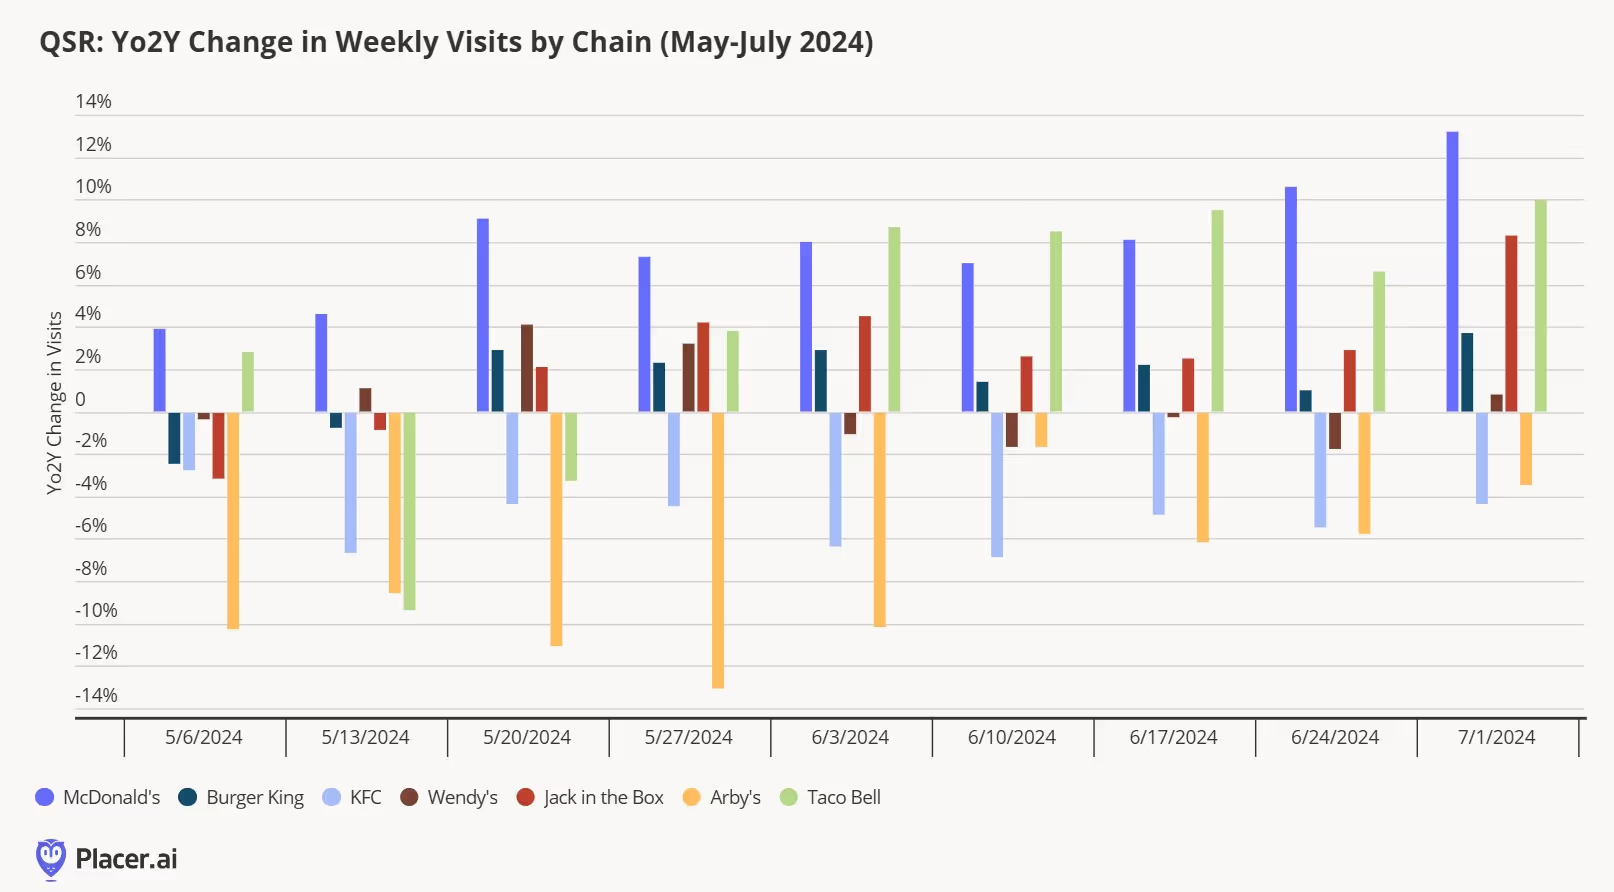
The Placer Blog looked at the impact of several recent limited time offers across the restaurant industry this week, but we thought we’d specifically look at McDonald’s and its direct competitors. After slower year-over-year visitation trends during April and the first half of May, we saw much stronger trends across the QSR category in June, especially those with bundled meal promotions like Jack in the Box, Wendy’s, Arby’s, and Burger King. McDonald’s visits actually declined year-over-year during the first week of the $5 Meal Deal promotion, but that was more of a function of lapping last year’s viral Grimace Shake promotion (the strength of the year-over-two-year visit trends below also supports this). Last week’s visitation trends accelerated on both a one- and two-year basis, reinforcing how important value is for driving visits for QSR consumers.
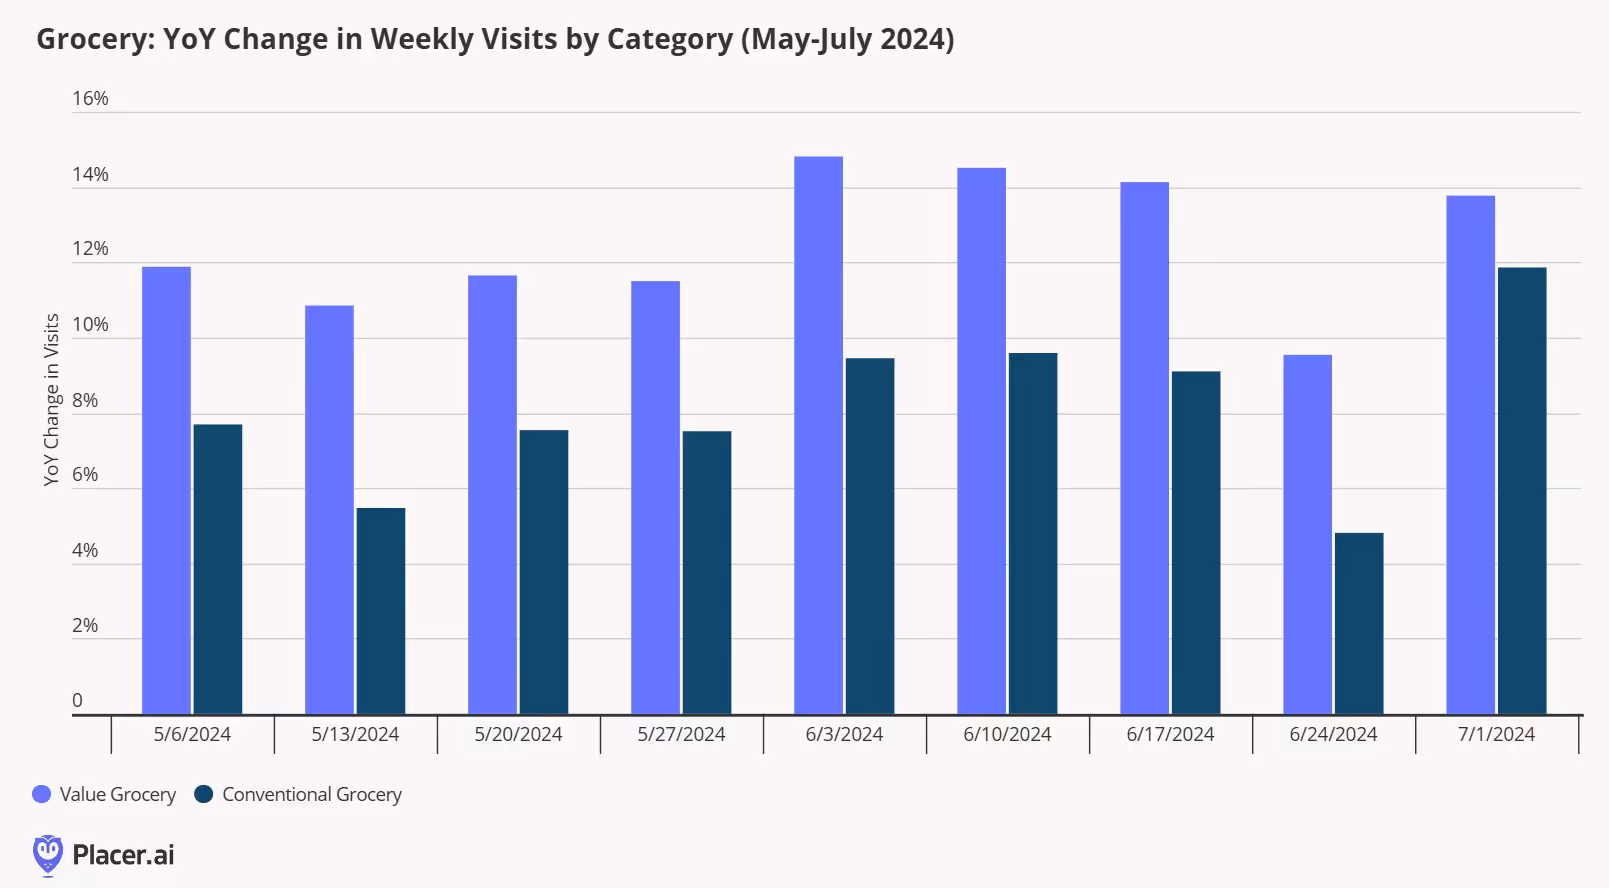
While consumers have responded positively to McDonald’s and other QSR chains’ bundled value promotions, we’ve yet to see a material impact on grocery visits over the same time period (both value and conventional grocers continue to see positive year-over-year growth). To us, there are probably a few reasons for this: (1) grocery stores have also been promotional over the corresponding period, something we’ve called out a few times the past few months; (2) consumers are still shopping a wider number of total food retail locations as they seek out deals and have incorporated QSR bundled value meals into their current shopping behavior; and (3) distortion in year-over-year numbers due to last week’s 4th of July holiday (which saw strong year-over-year visit trends).
In recent weeks, we’ve analyzed auto dealers and convenience stores, so we thought we’d extend the conversation by taking a look at the car wash industry. The car wash industry in the United States has been one of the fastest growing retail categories coming out of the pandemic due to the increasing number of vehicles on the road, an increase in average vehicle age, a shift to a membership-based model for many operators, as well as advancements in car wash technology that have made services more efficient and automated. This shift is evidenced by the fact that around 80% of car washes are now done at professional locations, compared to 48% in 1994 according to the International Car Wash Association.
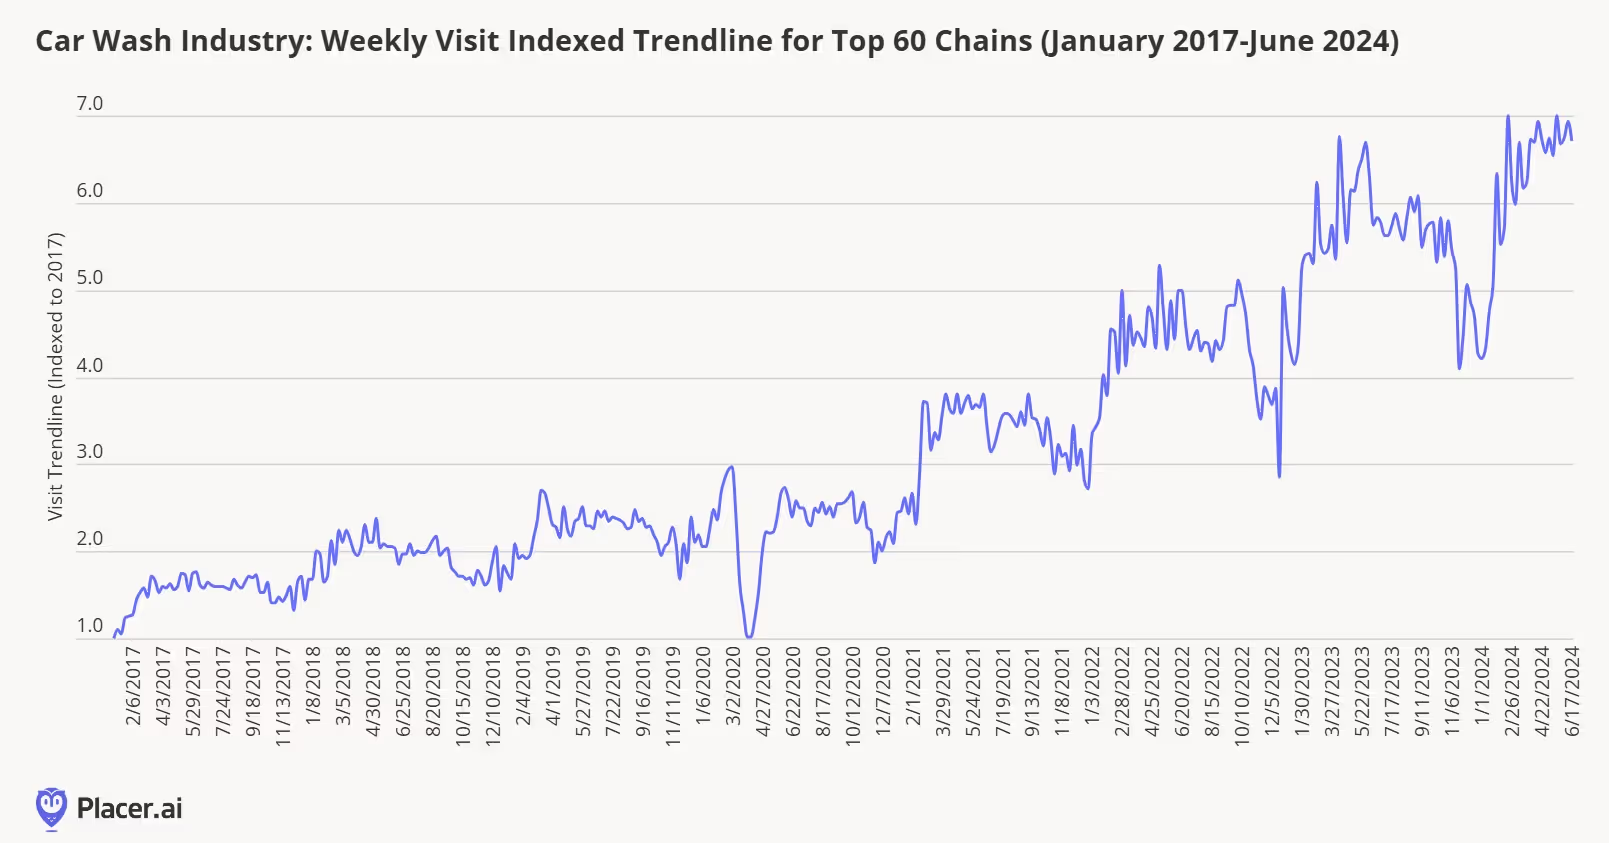
According to car wash trade groups, there are approximately 65,000 car wash locations across the nation. Mister Car Wash is the largest car wash chain in the U.S., operates more than 480 locations across 21 states. However, the category remains highly fragmented, with nearly three-fourths of industry operators having less than 2 locations. This has naturally set the stage for industry consolidation the past several years, with larger companies acquiring smaller operators to expand their footprints. We see the overall growth and consolidation of the category in a visitation trendline of a custom grouping of nearly 60 of the largest car wash chains in the U.S., where total visits have increased by roughly seven times since 2017.
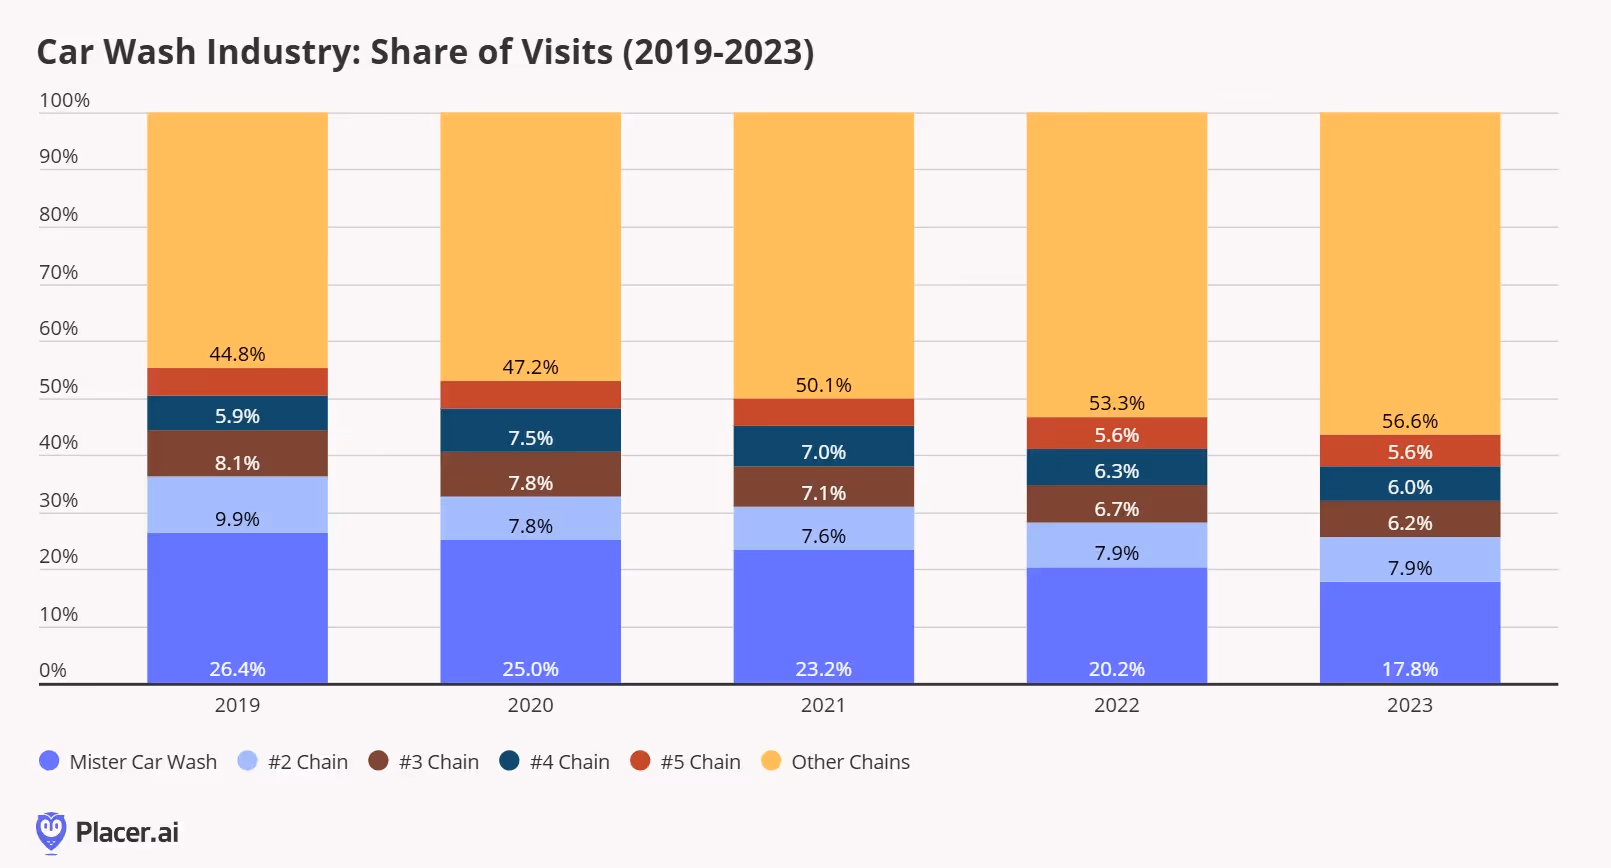
We also see consolidation show up share of visit numbers from 2019-2023, which we show below. Mister Car Wash has remained the largest player in the category with respect to share of visits the past several years by growing both its unit counts (from 322 at the end of 2019 to 482 as of March) and visits per location (up more than 8% over the same time period). There has been movement among the chains ranked number 2 through 6 the past several years, but the group has generally included Quick Quack Car Wash, Take 5 Car Wash, Tommy’s Express Car Wash, and Zips Car Wash. However, the most notable observation from share of visit trends is the tremendous growth in visit share among smaller chains the past several years.
Car washes have been an attractive investment for private equity the past several years, helping to fuel some of the growth of smaller chains. Individual car wash locations generate an estimated $1.5M in annual sales according to industry trade groups–which is slightly ahead of the average unit sales of a quick-service restaurant chain of $1.4 million–while offering lower labor requirements and more predictable results due to the increasing popularity of membership models. In many respects, the growth of the car wash category mirrors the growth we’ve seen across the fitness category the past several years.
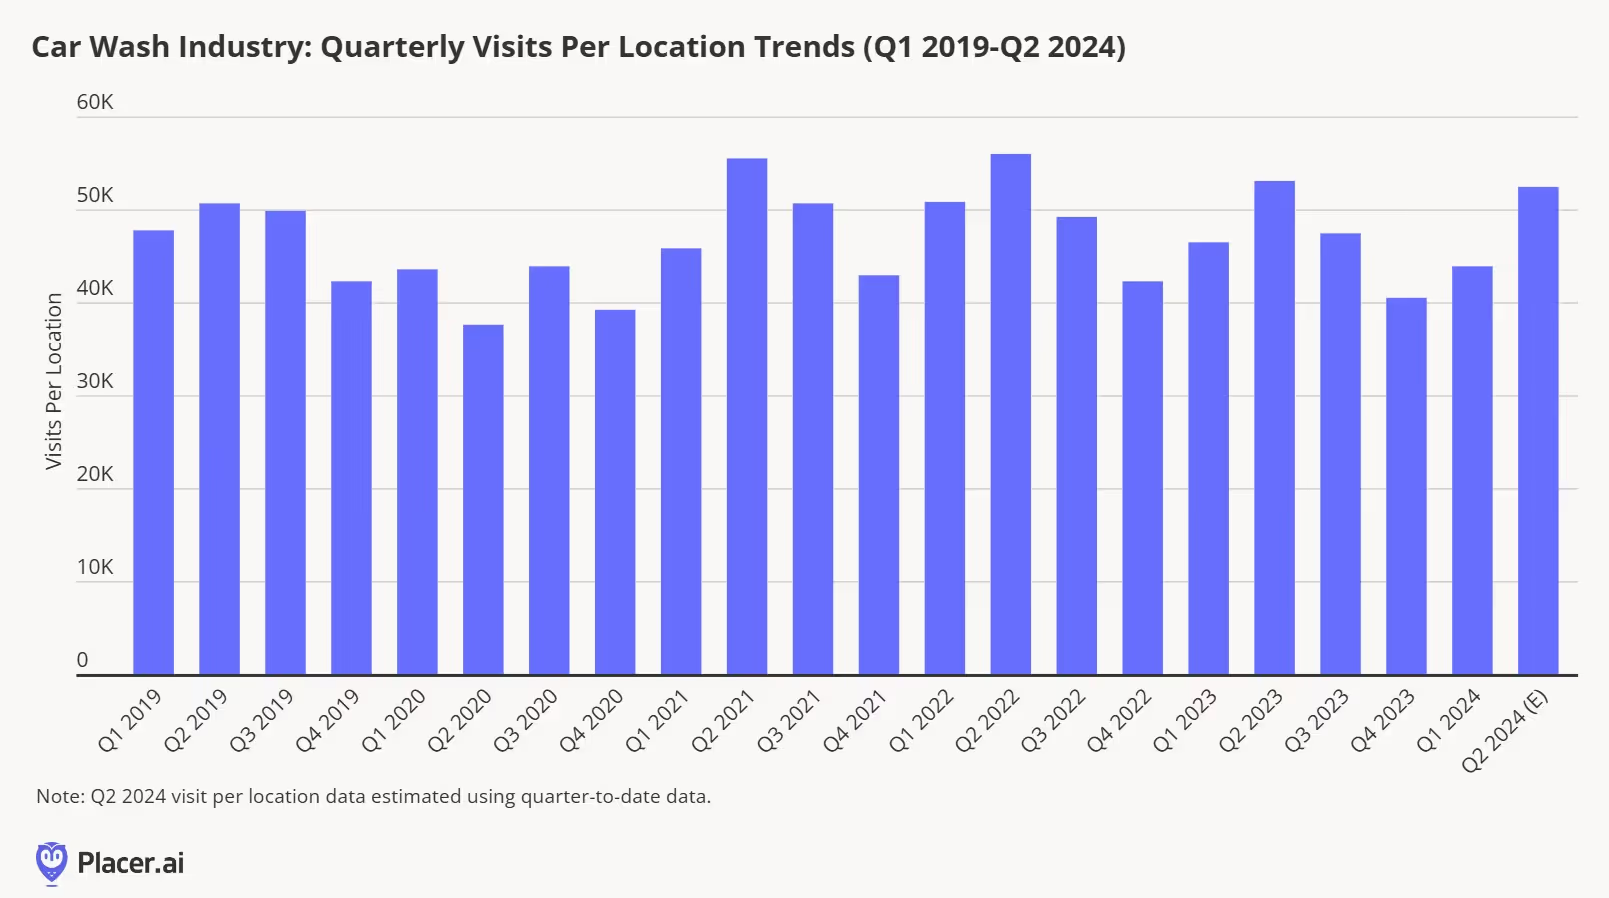
Despite the strong industry growth the past several years, Q1 2024 trends were impacted by a number of factors according to Mister Car Wash’s management team, including increased competition and a lower-income customer cohort that's been under more pressure (inclement weather in January across much of the country also likely played a role). Placer data confirms that Q1 2024 was in fact the weakest quarter from a category visit per location standpoint in several years. However, we’ve seen a rebound in Q2 2024 trends so far, with quarter-to-date visitation trends pacing just behind the year ago period with just a few days left in the quarter.
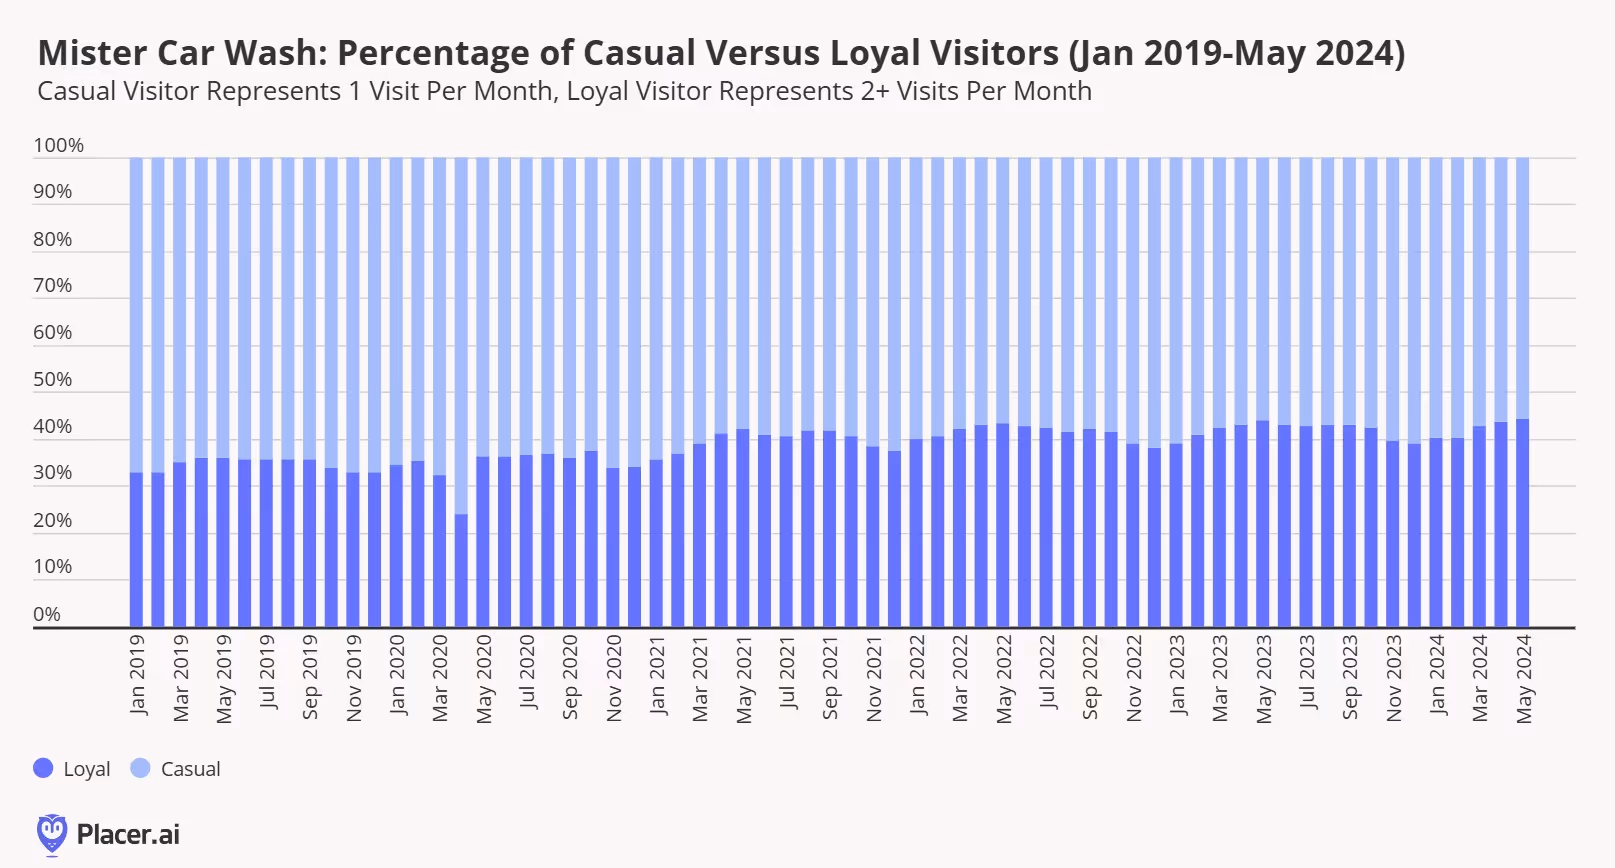
We mentioned that a membership-based approach has helped to drive visitation growth for the category and led to more predictable results, and we see that when we look at visitor loyalty data for Mister Car Wash. According to the company’s most recent annual report, it increased overall Unlimited Car Wash (UWC) monthly subscription penetration to 71% of total wash sales in 2023, up from 68% the year prior. When we look at visits from “casual” (1 visit per month) versus “loyal” (2+ visits per month) customers, we’ve seen a meaningful shift toward more loyal customers the past several years, particularly during peak visitation months in the summer.
Despite a slower start to 2024 due to aforementioned factors, the U.S. car wash industry appears well positioned for continued growth and consolidation due to the continued aging of the auto fleet, population migration trends, the continued shift toward membership-based revenue models, attractive unit economics, and new technological advances.

Introduction
2024 has been another challenging year for retailers. Still-high prices and an uncertain economic climate led many shoppers to trade down and cut back on unnecessary indulgences. Value took center stage, as cautious consumers sought to stretch their dollars as far as possible.
But price wasn’t the only factor driving consumer behavior in 2024. This past year saw the rise of a variety of retail and dining trends, some seemingly at odds with one another. Shoppers curbed discretionary spending, but made room in their budgets for “essential non-essentials” like gym memberships and other wellness offerings. Consumers placed a high premium on speed and convenience, while at the same time demonstrating a willingness to go out of their way for quality or value finds. And even amidst concern about the economy, shoppers were ready to pony up for specialty items, legacy brands, and fun experiences – as long as they didn’t break the bank.
How did these currents – likely to continue shaping the retail landscape into 2025 – impact leading brands and categories? We dove into the data to find out.
Conventional Value Reaching Its Ceiling
Bifurcation has emerged as a foundational principle in retail over the past few years: Consumers are increasingly gravitating toward either luxury or value offerings and away from the ‘middle.’ Add extended economic uncertainty along with rapid expansions and product diversification from top value-oriented retailers, and you have an explosion of visits in the value lane.
But we are seeing a ceiling to that growth – especially in the discount & dollar store space. Throughout 2023 and the first part of 2024, visits to discount & dollar stores increased steadily. But no category can sustain uninterrupted visit growth forever. Since April 2024, year–over-year (YoY) foot traffic to the segment has begun to slow, with September 2024 showing just a modest 0.8% YoY visit increase.
Discount & dollar stores, which attract lower-income shoppers compared to both grocery stores and superstores, have also begun lagging behind these segments in visit-per-location growth. In Q3, the average number of visits to each discount and dollar store location remained essentially flat compared to 2023 (+0.2%), while visits per location to superstores and grocery stores grew by 2.8% and 1.0%, respectively. As 2024 draws to a close, it is the latter segments, which appeal to shoppers with incomes closer to the nationwide median of $76.1K, which are seeing better YoY performance.
The deceleration doesn’t mean that discount retailers are facing existential risk – discount & dollar stores are still extremely strong and well-positioned with focused offerings that resonate with consumers. The visitation data does suggest, however, that future growth may need to focus on initiatives other large-scale fleet expansions. Some of these efforts will involve moving upmarket (see pOpShelf), some will focus on fleet optimization, and others may include new offerings and channels.
Return of the middle anyone?
Innovative and Disruptive Value Shake Up Retail and Dining
Still, in an environment where consumers have been facing the compounded effects of rising prices, value remains paramount for many shoppers. And brands that have found ways to let customers have their cake and eat it too – enjoy specialty offerings and elevated experiences without breaking the bank – have emerged as major visit winners this year.
Trader Joe’s Drives Visits With Private Label Innovation
Trader Joe’s, in particular, has stood out as one of the leading retail brands for innovative value in 2024, a trend that is expected to continue into 2025.
Trader Joe’s dedicated fan base is positively addicted to the chain’s broad range of high-quality specialty items. But by maintaining a much higher private label mix than most grocers – approximately 80%, compared to an industry average of 25% to 30% – the retailer is also able to keep its pricing competitive. Trader Joe’s cultivates consumer excitement by constantly innovating its product line – there are even websites dedicated to showcasing the chain’s new offerings each season. In turn, Trader Joe’s enjoys much higher visits per square foot than the rest of the grocery category: Over the past twelve months, Trader Joe’s drew a median 56 visits per square foot – compared to 23 for H-E-B, the second-strongest performer.
Chili’s Beats QSR at its Own Game
Casual dining chain Chili’s has also been a standout on the disruptive value front this past year – offering consumers a full-service dining experience at a quick-service price point.
Chili’s launched its Big Smasher Burger on April 29th, 2024, adding the item to its popular ‘3 for Me’ offering, which includes an appetizer, entrée, and drink for just $10.99 – lower than than the average ticket at many quick-service restaurant chains. The innovative promotion, which has been further expanded since, continues to drive impressive visitation trends. With food-away-from-home inflation continuing to decelerate, this strategy of offering deep discounts is likely to continue to be a key story in 2025.
The Convenience Myth
Convenience is king, right?
Well, probably not. If convenience truly were king, visitors would orient themselves to making fewer, longer visits to retailers – to minimize the inconvenience of frequent grocery trips and spend less time on the road. But analyzing the data suggests that, while consumers may want to save time, it is not always their chief concern.
Looking at the superstore and grocery segments (among others) reveals that the proportion of visitors spending under 30 minutes at the grocery store is actually increasing – from 73.3% in Q3 2019 to 76.6% in Q3 2024. This indicates that shoppers are increasingly willing to make shorter trips to the store to pick up just a few items.
At the same time, more consumers than ever are willing to travel farther to visit specialty grocery chains in the search of specific products that make the visit worthwhile.
Cross visitation between chains is also increasing – suggesting that shoppers are willing to make multiple trips to find the products they want – at the right price point. Between Q3 2023 and Q3 2024, the share of traditional grocery store visitors who also visited a Costco at least three times during the quarter grew across chains.
Does this mean convenience doesn’t matter? Of course not. Does it indicate that value, quality and a love of specific products are becoming just as, if not more, important to shoppers? Yes.
The implications here are very significant. If consumers are willing to go out of their way for the right products at the right price points – even at the expense of convenience – then the retailers able to leverage these ‘visit drivers’ will be best positioned to grow their reach considerably. The willingness of consumers to forego convenience considerations when the incentives are right also reinforces the ever-growing importance of the in-store experience.
So while convenience may still be within the royal family, the role of king is up for grabs.
Serving Diners Quicker With Automatization
Chipotle Draws Crowds With Autocado
Convenience may not be everything, but the drive for quicker service has emerged as more important than ever in the restaurant space. Diners want their fast food… well, as fast as possible. And to meet this demand, quick-service restaurants (QSRs) and fast-casual chains have been integrating more technology into their operations. Chipotle has been a leader in this regard, unveiling the “Autocado” robot at a Huntington Beach, California location last month. The robot can peel, pit, and chop avocados in record time, a major benefit for the Tex-Mex chain.
And the Autocado seems to be paying off. The Huntington Beach location drew 10.0% more visits compared to the average Chipotle location in the Los Angeles-Long Beach-Anaheim metro area in Q3 2024. Visitors are visiting more frequently and getting their food more quickly – 43.9% of visits at this location lasted 10 minutes or less, compared to 37.5% at other stores in the CBSA.
Are diners flocking to this Chipotle location to watch the future of avocado chopping in action, or are they enticed by shorter wait times? Time will tell. But with workers able to focus on other aspects of food preparation and customer service, the innovation appears to be resonating with diners.
McDonald’s Leans into Automation in Texas
McDonald’s, too, has leaned into new technologies to streamline its service. The chain debuted its first (almost) fully automated, takeaway-only restaurant in White Settlement, TX in 2022 – where orders are placed at kiosks or on app, and then delivered to customers by robots. (The food is still prepared by humans.) Unsurprisingly, the restaurant drives faster visits than other local McDonald’s locations – in Q3 2023, 79.7% of visits to the chain lasted less than 10 minutes, compared to 68.5% for other McDonald’s in the Dallas-Fort Worth-Arlington, TX CBSA. But crucially, the automated location is also busier than other area McDonald’s, garnering 16.8% more visits in Q3 than the chain’s CBSA-wide average. And the location draws a higher share of late-night visits than other area McDonald’s – customers on the hunt for a late-night snack might be drawn to a restaurant that offers quick, interaction-free service.
Evolving Retail Formats - Finding the Right Fit
Changing store formats is another key trend shaping retail in 2024. Whether by reducing box sizes to cut costs, make stores more accessible, or serve smaller growth markets – or by going big with one-stop shops, retailers are reimagining store design. And the moves are resonating with consumers, driving visits while at the same improving efficiency.
Macy’s Draws Local Weekday Visitors With Small-Format Stores
Macy’s, Inc. is one retailer that is leading the small-format charge this year. In February 2024, Macy’s announced its “Bold New Chapter” – a turnaround plan including the downsizing of its traditional eponymous department store fleet and a pivot towards smaller-format Macy’s locations. Macy’s has also continued to expand its highly-curated, small-format Bloomie’s concept, which features a mix of established and trendy pop-up brands tailored to local preferences.
And the data shows that this shift towards small format may be helping Macy’s drive visits with more accessible and targeted offerings that consumers can enjoy as they go about their daily routines: In Q3 2024, Macy’s small-format stores drew a higher share of weekday visitors and of local customers (i.e. those coming from less than seven miles away) than Macy’s traditional stores.
Harbor Freight Tools and Ace Hardware Serve Smaller Growth Markets With Less Square Footage
Small-format stores are also making inroads in the home improvement category. The past few years have seen consumers across the U.S. migrating to smaller suburban and rural markets – and retailers like Harbor Freight Tools and Ace Hardware are harnessing their small-format advantage to accommodate these customers while keeping costs low.
Harbor Freight tools and Ace Hardware’s trade areas have a high degree of overlap with some of the highest growth markets in the U.S., many of which have populations under 200K. And while it can be difficult to justify opening a Home Depot or Lowe’s in these hubs – both chains average more than 100,000 square feet per store – Harbor Freight Tools and Ace Hardware’s smaller boxes, generally under 20,000 square feet, are a perfect fit.
This has allowed both chains to tap into the smaller markets which are attracting growing shares of the population. And so while Home Depot and Lowe’s have seen moderate visits declines on a YoY basis, Harbor Freight and Ace Hardware have seen consistent YoY visit boosts since Q1 2024 – outperforming the wider category since early 2023.
Hy-Vee Bucks the Trend by Going Big
Are smaller stores a better bet across the board? At the end of the day, the success of smaller-format stores depends largely on the category. For retail segments that have seen visit trends slow since the pandemic – home furnishings and consumer electronics, for example – smaller-format stores offer brands a more economical way to serve their customers. Retailers have also used smaller-format stores to better curate their merchandise assortments for their most loyal customers, helping to drive improved visit frequency.
That said, a handful of retailers, such as Hy-Vee, have recently bucked the trend of smaller-format stores. These large-format stores are often designed as destination locations – Hy-Vee’s larger-format locations usually offer a full suite of amenities beyond groceries, such as a food hall, eyewear kiosk, beauty department, and candy shop. Rather than focusing on smaller markets, these stores aim to attract visitors from surrounding areas.
Visit data for Hy-Vee’s large-format store in Gretna, Nebraska indicates that this location sees a higher percentage of weekend visits than other area locations – 37.7% compared to 33.1% for the chain’s Omaha CBSA average – as well as more visits lasting over 30 minutes (32.9% compared to 21.9% for the metro area as a whole). For these shoppers, large-format, one-stop shops offer a convenient – and perhaps more exciting – alternative to traditionally sized grocery stores. The success of the large-format stores is another sign that though convenience isn’t everything in 2024, it certainly resonates – especially when paired with added-value offerings.
A Resurgence of Legacy Brands
Many retail brands have entrenched themselves in American culture and become an extension of consumers' identities. And while some of these previously ubiquitous brands have disappeared over the years as the retail industry evolved, others have transformed to keep pace with changing consumer needs – and some have even come back from the brink of extinction. And the quest for value notwithstanding, 2024 has also seen the resurgence of many of these (decidedly non-off-price) legacy brands.
In apparel specifically, Gap and Abercrombie & Fitch – two brands that dominated the cultural zeitgeist of the 1990s and early 2000s before seeing their popularity decline somewhat in the late aughts and 2010s – may be staging a comeback. Bed Bath & Beyond, a leader in the home goods category, is also making a play at returning to physical retail through partnerships.
Anthropologie, another legacy player in women’s fashion and home goods, is also on the rise. Anthropologie’s distinctive aesthetic resonates deeply with consumers – especially women millennials aged 30 to 45. And by capturing the hearts of its customers, the retailer stands as a beacon for retailers that can hedge against promotional activity and still drive foot traffic growth.
And visits to the chain have been rising steadily. In Q4 2023, the chain experienced a bigger holiday season foot traffic spike than pre-pandemic, drawing more overall visits than in Q4 2019. And in Q3 2024, visits were higher than in Q3 2023.
Meeting the Evolving Needs of Millennials
And speaking of the 35 to 40 set – the generation that all retailers are courting? Millennials. Does that sound familiar? Yes, because this is the same generational cohort that retailers tried to target a decade ago. As millennials have aged into the family-formation stage of life, their retail needs have evolved, and the industry is now primed to meet them.
Sam’s Club Draws Value-Conscious Singles and Starters
From the revival of nostalgic brands like the Limited Too launch at Kohl’s to warehouse clubs expanding memberships to younger consumers as they move to suburban and rural communities, there are myriad examples of retailers reaching out to this cohort. And Sam’s Club offers a prime example of this trend.
Over the past few years, millennials and Gen-Zers have emerged as major drivers of membership growth at Sam’s Club, drawn to the retailer’s value offerings and digital upgrades – like the club’s Scan & Go technology. Over the same period, Sam’s Club has grown the share of “Singles and Starters” households in its captured market from 6% above the national benchmark in Q3 2019 to 15% in Q3 2024. And with plans to involve customers in co-creating products for its private-label brand, Sam’s Club may continue to grow its market share among this value-conscious – but also discerning and optimistic – demographic.
Taco Bell Brings in Crowds With Value Nostalgia Menu
Millennials are also now old enough to wax nostalgic about their youth – and brands are paying attention. This summer, Taco Bell leaned into nostalgia with a promotion bringing back iconic menu items from the 60s, 70s, 80s, and 90s – all priced under $3. The promotion, which soft-launched at three Southern California locations in August, was so successful that the company is now offering the specials nationwide. The three locations that trialed the “Decades Menu” saw significant boosts in visits during the promotional period compared to their daily averages for August. And people came from far and wide to sample the offerings – with a higher proportion of visitors traveling over seven miles to reach the stores while the items were available.
What Lies Ahead?
Hot on the heels of a tumultuous 2023, 2024’s retail environment has certainly kept retailers on their toes. While embracing innovative value has helped some chains thrive, other previously ascendant value segments, including discount & dollar stores, may have reached their growth ceilings. Consumers clearly care about convenience – but are willing to make multiple grocery stops to find what they need. At the same time, legacy brands are plotting their comeback, while others are harnessing the power of nostalgia to drive millennials – and other consumers – through their doors.

