


.svg)


Heading into the Q3 2024 retailer reporting period, most expected Walmart to continue gaining market share from essentials-focused retailers. In our coverage of Walmart’s Q2 2024 update, we highlighted the chain’s significant disruption in the grocery category, driven by everyday low pricing, Walmart+ store delivery orders, store remodeling efforts, an improved selection of premium merchandise, and a broadened marketplace offering. These strategies notably boosted visits among higher-income households earning $100,000 or more annually.
While Walmart did indeed disrupt essentials retailers this quarter, what stood out even more was its impact across discretionary categories. Management reported low-single-digit comparable sales growth in general merchandise, with mid-single-digit unit growth offsetting low-to-mid single-digit price deflation. Categories like home, toys, and hardlines led this growth, complemented by strength in beauty, fashion, and apparel. Walmart’s marketplace played a key role in this success, offering consumers a broader selection of brands and items than in-store. Marketplace sales in beauty, toys, hardlines, and home each grew by 20% year-over-year.
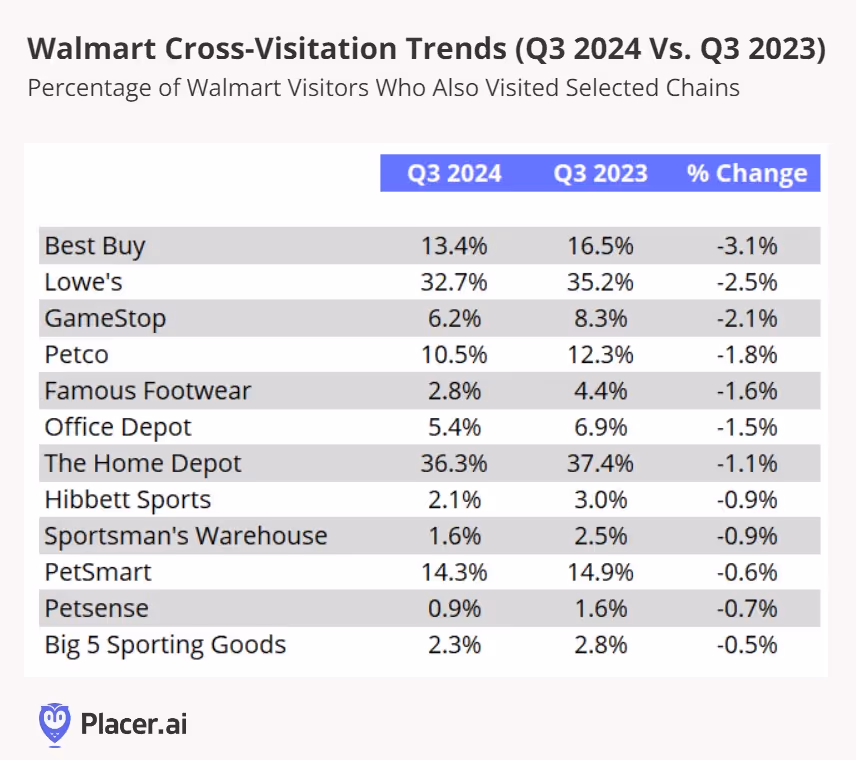
To assess Walmart’s impact on other general merchandise retailers, we analyzed cross-visitation trends. Our data indicates that year-over-year cross-visitation between Walmart and other hardgoods retailers like Best Buy, GameStop, Lowe’s, Home Depot, Hibbett Sports, Sportsman Warehouse, and Big 5—as well as pet retailers like Petco and PetSmart—declined. This suggests a potential shift in consumer behavior, with shoppers consolidating more of their general merchandise purchases at Walmart.
To confirm Walmart's impact on general merchandise, we analyzed visitation trends across several discretionary categories from July to November 2024 (below). With the exceptions of beauty and home furnishings—more on that category in a minute—most categories experienced year-over-year declines throughout much of the August to October quarter. Notably, mid-October brought a temporary improvement in visit trends, coinciding with major promotional events such as Amazon’s Big Deal Days, Walmart’s Holiday Deals Event, and Target’s Circle Week, underscoring how deal-driven consumers are in today’s environment. Following these promotions, shopping activity largely paused until last week, when Black Friday deal announcements began to drive renewed interest.
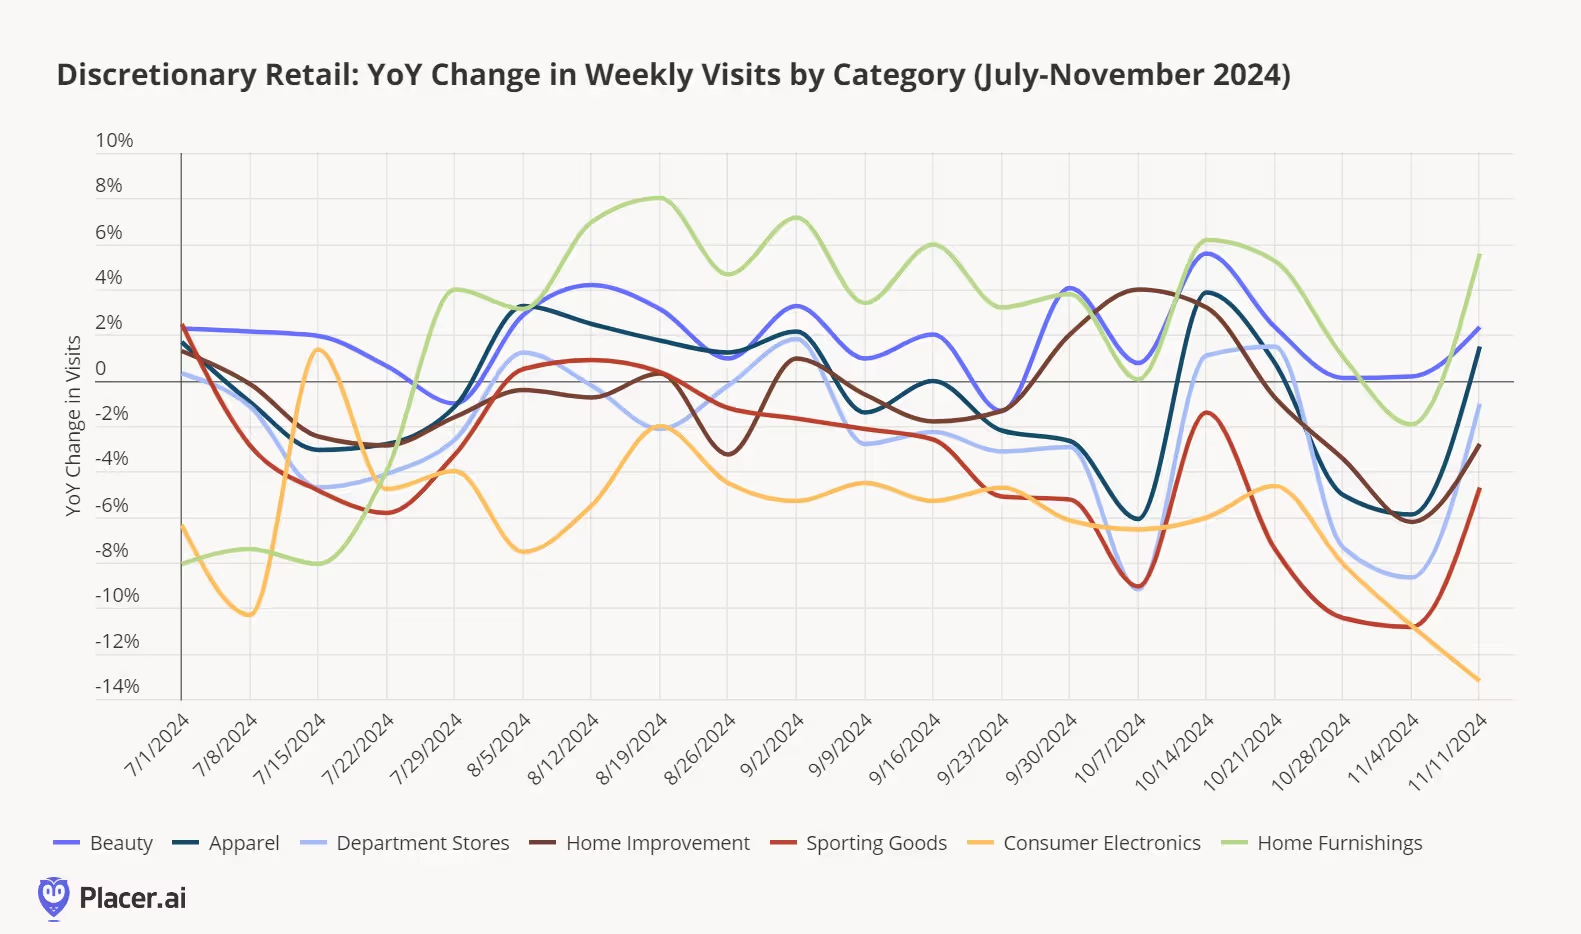
Home furnishings deserve a closer look. Earlier this year, we noted strong visit trends in housewares retail, and that momentum has largely continued. Mattress retailers, which began the year on a high note, have also maintained positive year-over-year visitation growth in the second half of 2024. Notably, furniture retailers—both value-focused and full-priced—saw year-over-year visitation gains during the quarter, though there was a slight pause in November as consumers waited for Black Friday deals.

These trends align with the third-quarter 2024 update from Williams-Sonoma, where management highlighted improvements in furniture sales at its West Elm and Pottery Barn brands. Additionally, the company cited strength in seasonal items and housewares, suggesting that Walmart’s strong performance in the home category reflects both broader industry trends and its own merchandising improvements. These patterns may also mark the early stages of a new home furnishings cycle as we near the five-year anniversary of the COVID-19 pandemic.
Walmart’s strong performance in discretionary categories serves as a warning to other discretionary retailers to elevate their strategies ahead of the holiday shopping season. With in-store merchandise enhancements and a robust third-party marketplace offering access to over 700 million stock-keeping units (SKUs), Walmart is positioned to be even more competitive this holiday season.
This week, we attended the Restaurant Finance & Development Conference (RFDC) in Las Vegas, a gathering of industry leaders including senior executives, real estate professionals, franchise groups, investors, and analysts. Similar to insights from last month’s Fast Casual Executive Summit, many operators acknowledged that 2024 has been a challenging year but expressed cautious optimism as they look ahead to 2025.
Restaurant operators have faced numerous headwinds this year, including inconsistent weather, heightened promotional activity across all tiers, increased competition from other food retail channels, elevated labor costs and shortages, and unfavorable lease terms contributing to a rise in bankruptcies. In Q3 2024, most restaurant chains experienced flat or declining visit-per-location trends, as shown below.
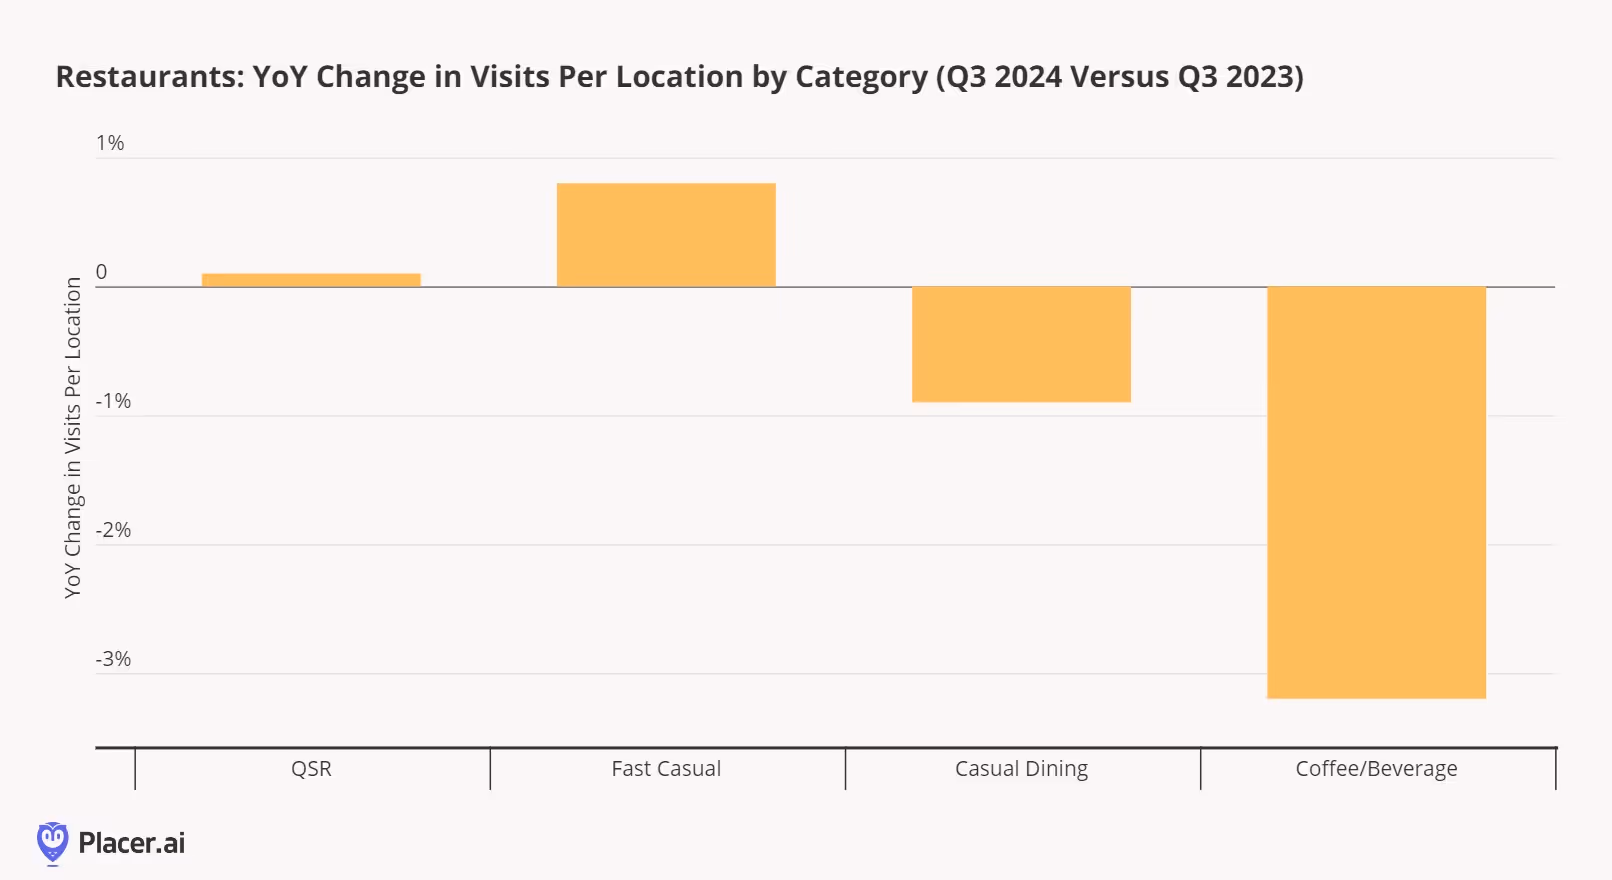
Still, some chains managed to achieve impressive growth in visitation per location this past quarter. Below, we highlight the top-performing limited-service restaurant chains (including QSR, fast casual, and coffee/beverage categories with more than 20 units) based on year-over-year visitation per location during Q3 2024.
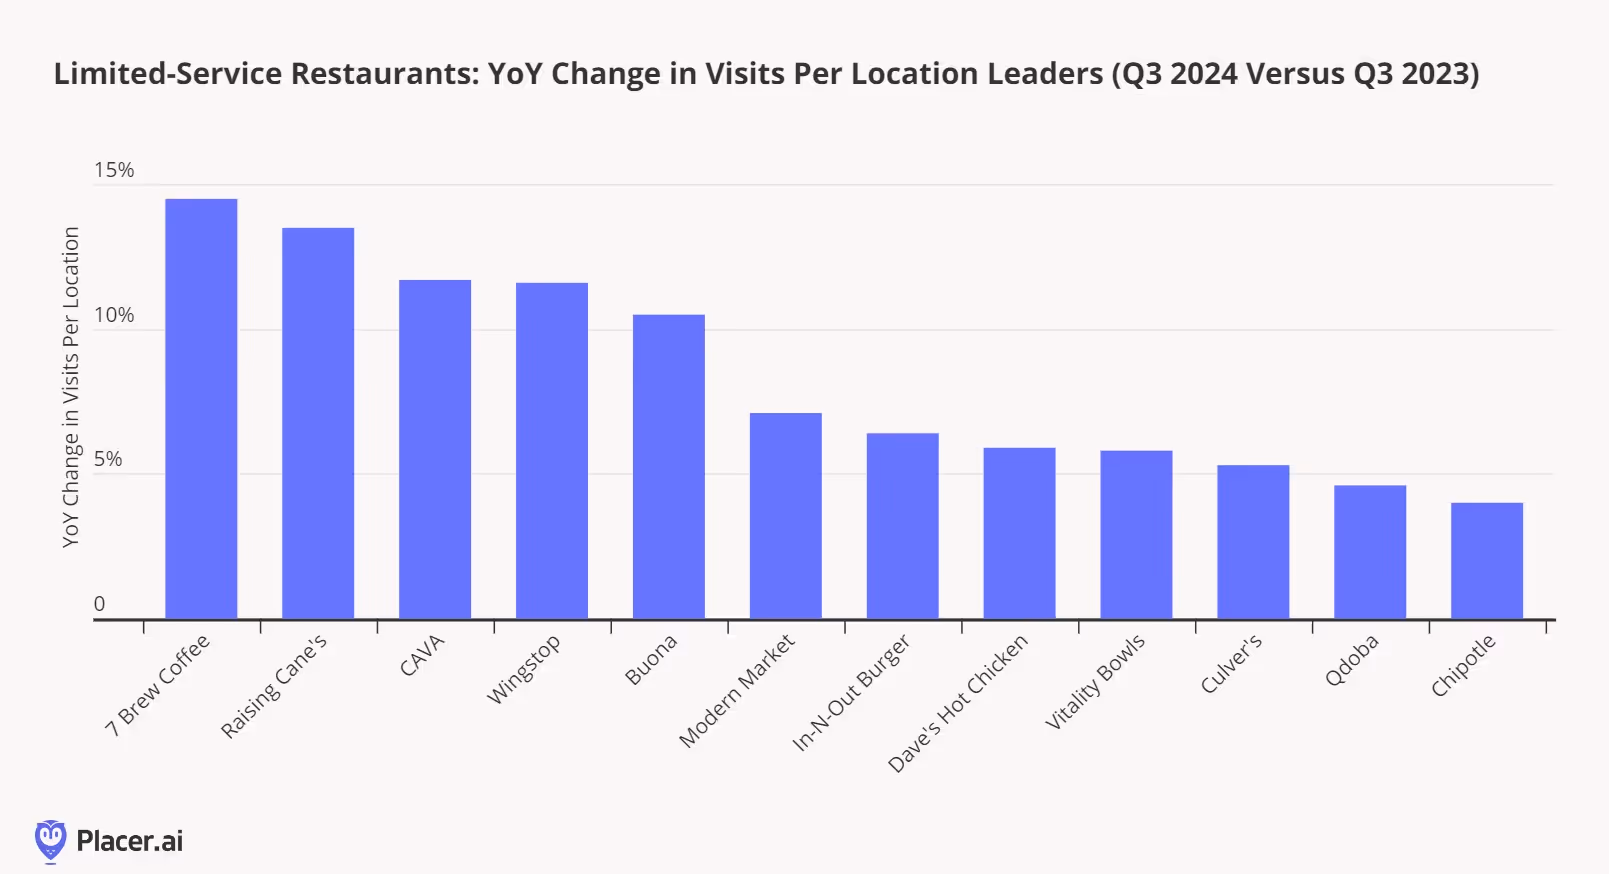
The most striking takeaway from this chart is that these standout restaurant chains largely avoided the "value wars" seen across the industry this year. Instead, they leaned on menu innovation—chains like CAVA, Chipotle, and Wingstop introduced new offerings that didn’t overly complicate preparation—and operational excellence, particularly in drive-thru efficiency, with leaders such as 7 Brew, Raising Cane’s, In-N-Out, and Culver’s driving visit growth.
Reflecting on the success of these chains, it’s unsurprising that a major theme among restaurant operators at the RFDC event was maximizing returns from existing locations rather than prioritizing unit expansion in 2025. Many chains emphasized improving operations, including simplifying menus to boost throughput while still allowing limited-time offers to drive demand. Others highlighted technology-driven solutions, such as automated make lines and AI-powered voice ordering for drive-thrus. Additionally, executives explored alternative strategies to enhance unit-level returns, including expanded catering services and leveraging retail media opportunities.
What else is on restaurant operators’ minds as we look ahead to 2025?
- Restaurant value wars not going away in the first half of 2025. Despite a renewed focus on optimizing menus and operations, restaurant value wars are not disappearing anytime soon—at least not in the first half of 2025. Chili’s reported a 14.1% growth in comparable sales during the July-September 2024 quarter, driven by its popular "3 for Me" value campaign, with transaction growth of 6.5% and a 10.1% rise in visits per location according to Placer data. Other casual dining operators are responding with similar value-driven promotions, such as Applebee’s “Really BIG Meal Deal” and Red Robin’s “$10 Gourmet Cheeseburger Deal.” Meanwhile, McDonald’s is extending its $5 Meal Deal into December, signaling that other QSR chains will likely follow suit with bundled value offerings into next year.
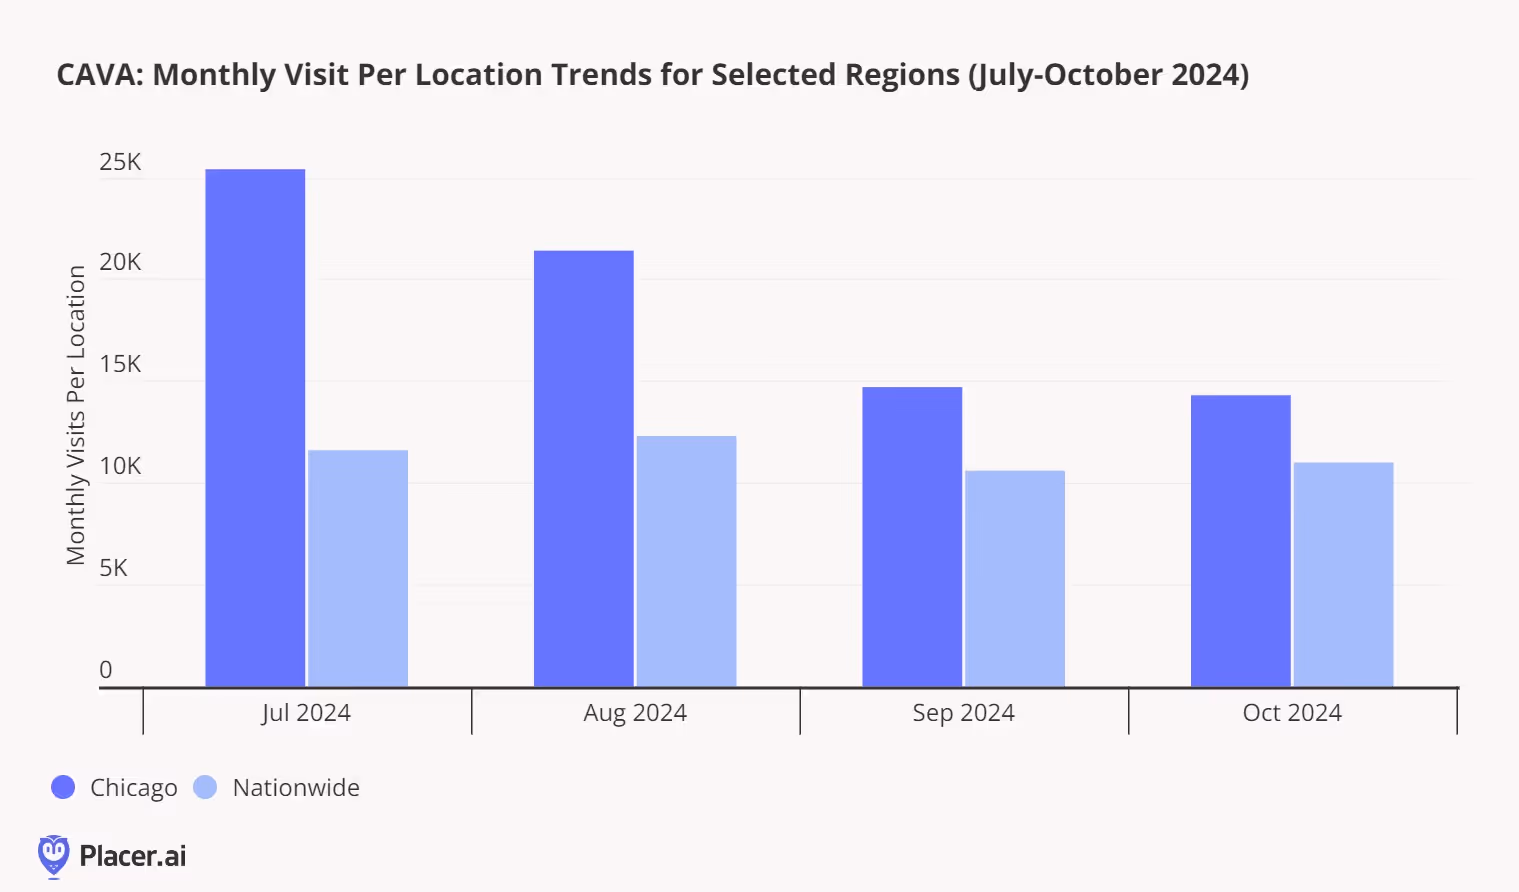
- CAVA's continued momentum. CAVA’s remarkable performance also stood out--something Placer's blog team recently highlighted--including an 18.1% increase in same-restaurant sales during Q3 2024, bolstered by 12.9% transaction growth. As the chain diversifies its visitor base and boosts visits per location, it has effectively managed increased demand through innovations such as Garlic Ranch Pita Chips, a refreshed loyalty program, seasonal menu additions, and its "Project Soul" store format—which emphasizes human connection with softer seating, greenery, and a warmer design palette. CAVA’s successful market entry into Chicago further underscores its growth potential. Notably, the chain's visit-per-location trends in Chicago remain ahead of nationwide trends, positioning it for success as it plans to enter South Florida and additional Midwest markets. At a time when many early-stage restaurant chains struggle with expansion, CAVA’s results showcase its operational strength and ability to capture new market opportunities.
- Starbucks turnaround in focus. Starbucks' turnaround efforts were a frequent topic at this year’s RFDC show. The chain recently debuted new TV ads, reminiscent of Starbucks CEO Brian Niccol’s successful turnaround playbook during his time at Chipotle. Niccol’s strategy to enhance the customer experience, reduce bottlenecks and operational complexities, and refine the Mobile Order and Pay system remains promising but will require time to take full effect. Expect further menu updates in early 2025, including a more streamlined offering—beyond the already announced discontinuation of the olive-oil-infused Oleato drinks.
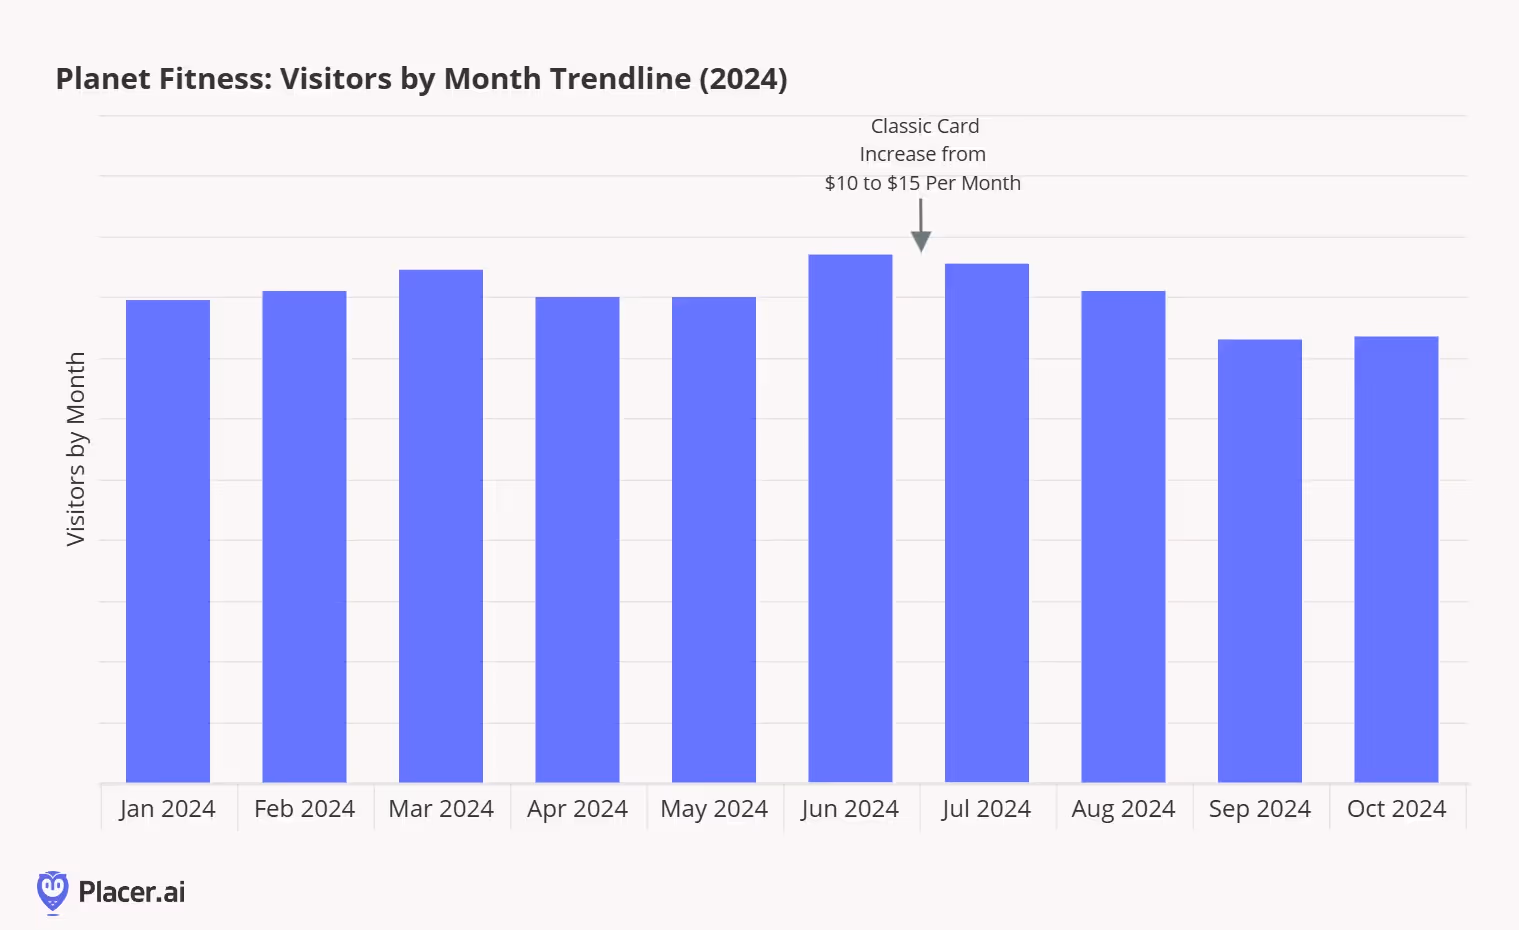
In late 2022, we suggested that fitness clubs in a post-pandemic environment were better positioned to withstand a slower macroeconomic climate than in the past. This was due to lower monthly fee business models, increased workout frequency among consumers, a shift toward younger members, and reduced seasonality. With Planet Fitness reporting its Q3 2024 results this week and ten months of visitation data available for 2024, we decided to revisit that thesis—especially in light of the company’s decision to raise the monthly price of its Classic Card from $10 to $15 in late June.
In the third quarter, Planet Fitness posted systemwide same-club sales growth of 4.3% (4.5% growth in franchisee clubs and 3.4% growth in corporate-owned clubs). Approximately 50% of the Q3 2024 comp increase was driven by net member growth, with the remaining balance attributed to rate increases. Our data indicates that the decline in visitors has been relatively modest since the Classic Card price hike. Management corroborated this, noting they “expected a slight decline in membership in Q3 2024, which was more than offset by the rate improvement on the Classic Card and a higher Black Card mix.”
During the quarter, 63.1% of Planet Fitness members were Black Card members (paying $25 per month), up from 62.1% in the same period last year. Management noted that new members are increasingly opting for the higher-priced Black Card membership, likely due to the added value of extra amenities, including access to all club locations, unlimited guest privileges, unlimited use of massage chairs and tanning beds, and discounts on cooler drinks, compared to the base membership.
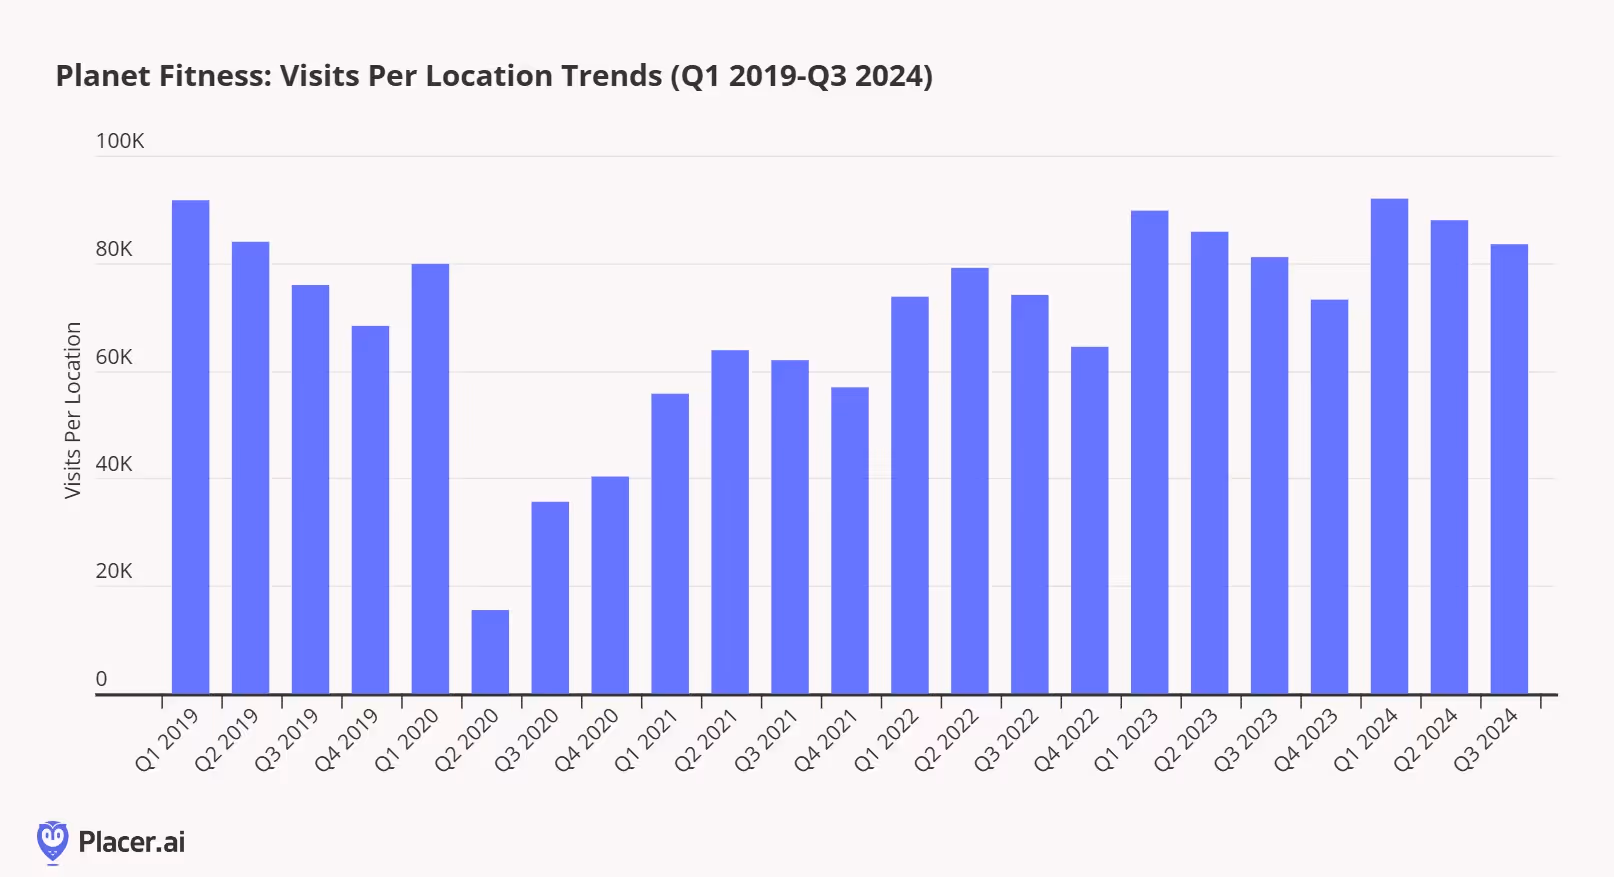
Planet Fitness’ visit-per-location trends further support our thesis that fitness clubs are more resilient to macroeconomic pressures than they were pre-pandemic. In 2019, Planet Fitness averaged nearly 92,000 visits per location in the first quarter, dropping to 68,000 in the fourth quarter—a 25% decrease. This year, Planet Fitness again began with 92,000 visits per location in the first quarter and is projected to close the year with 76,000-78,000 visits per location. This would represent a year-end decrease in the mid-teens, indicating a more stable membership base and lower churn rates than in past years.
Fitness clubs still face challenges in today’s consumer environment. For instance, Equinox-owned Blink Fitness filed for bankruptcy earlier this year, citing pandemic-related deferred rent payments and other factors in its filing. (On a related note, Planet Fitness reportedly made a bid for Blink Fitness this week.) Nonetheless, Planet Fitness' resilience underscores that fitness club unit economics have evolved over the past several years, potentially making them better equipped to handle diverse consumer environments.
It’s been an eventful week for the QSR Burger category, with much of the focus on this week’s quarterly updates focusing on events that took place after Q3 2024 ended. Let’s start with McDonald’s, where an E.Coli outbreak overshadowed what was largely a positive quarter of visitation gains, where the chain had reversed the visitation declines that it saw during the driven year-over-year visitation increases through its $5 Meal Deal and Collector’s Edition promotion (below).
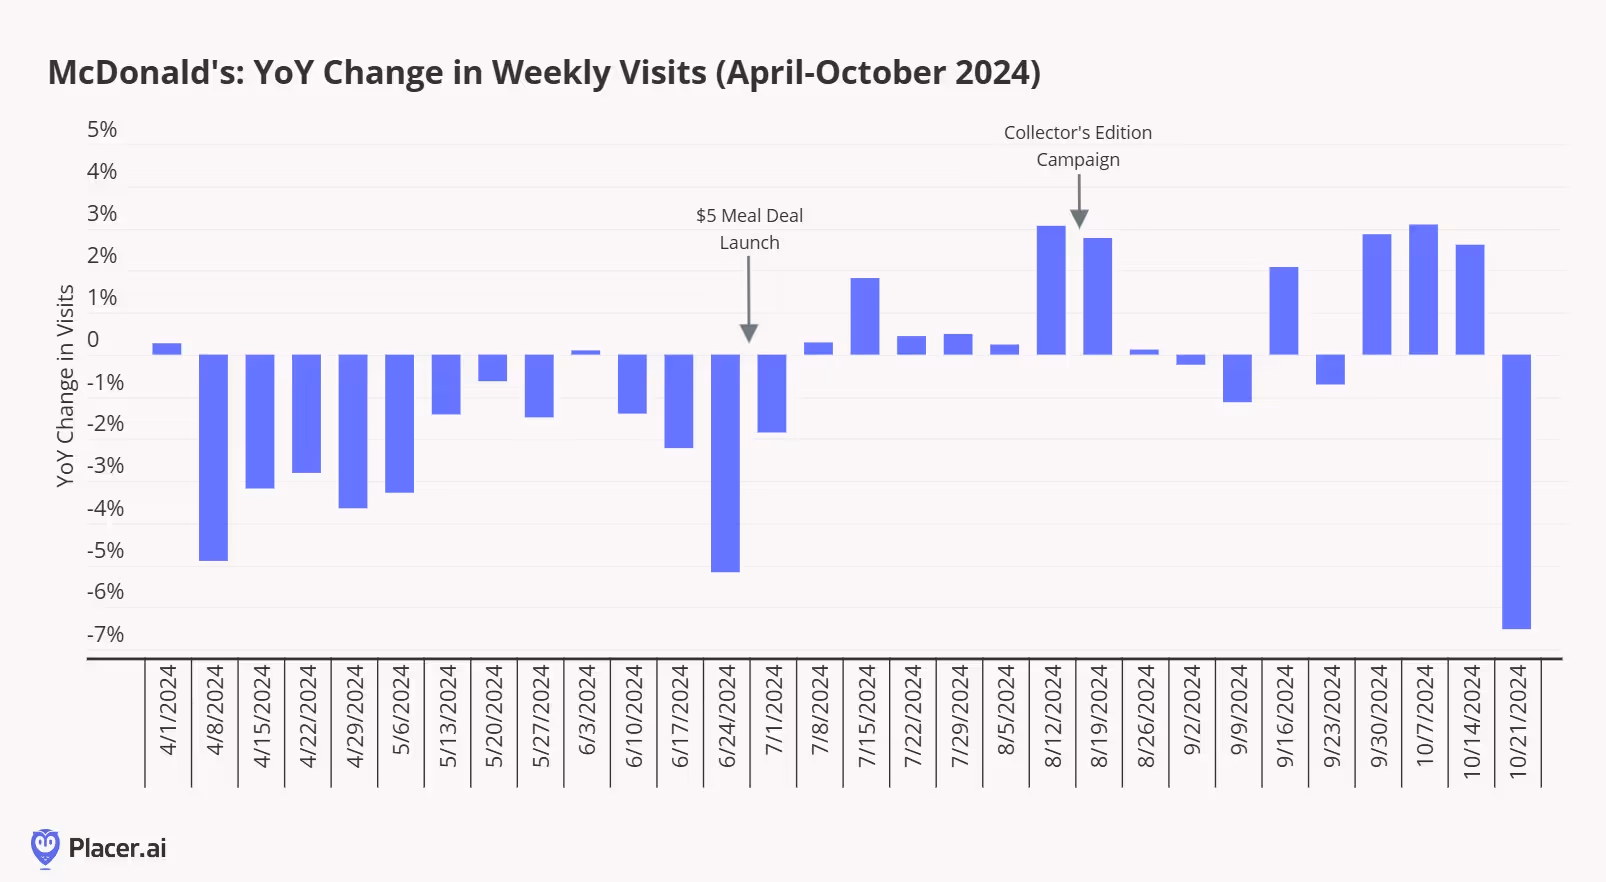
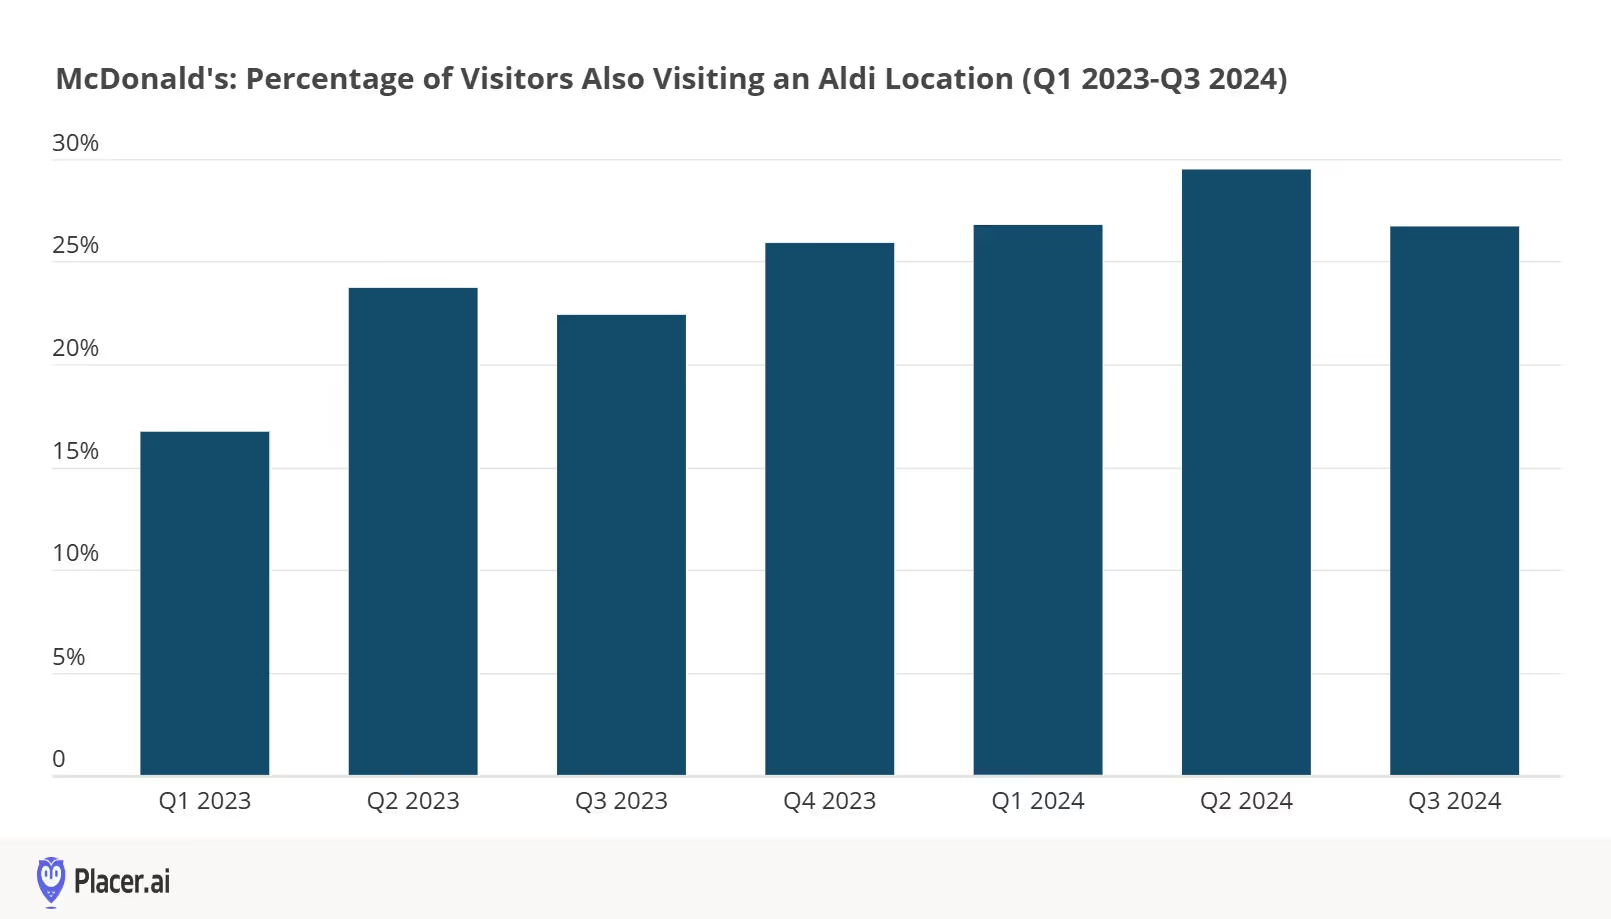
According to the company, the $5 Meal Deal “continued drawing customers back into our restaurants throughout the quarter, maintaining an average check north of $10 and being profitable for our franchisees.” Importantly, McDonald’s management also called out that the $5 Meal Deal is gaining traction among low-income consumers and that it “successfully [grew] traffic share with this group for the first time in over a year.” Our data indicates this as well. Over the past several months, we’ve looked at McDonald’s cross visitation trends with Aldi as a barometer of its traction with lower-income consumers. The percentage of McDonald’s visitors that also visited an Aldi had been steadily increasing through Q2 2024, but we did see a reversal of this trend in Q3 2024, suggesting that more consumers are finding value at the chain. The company remains committed to having the $5 Meal Deal on its menus until December as it works towards “sustainable guest count-led growth.”
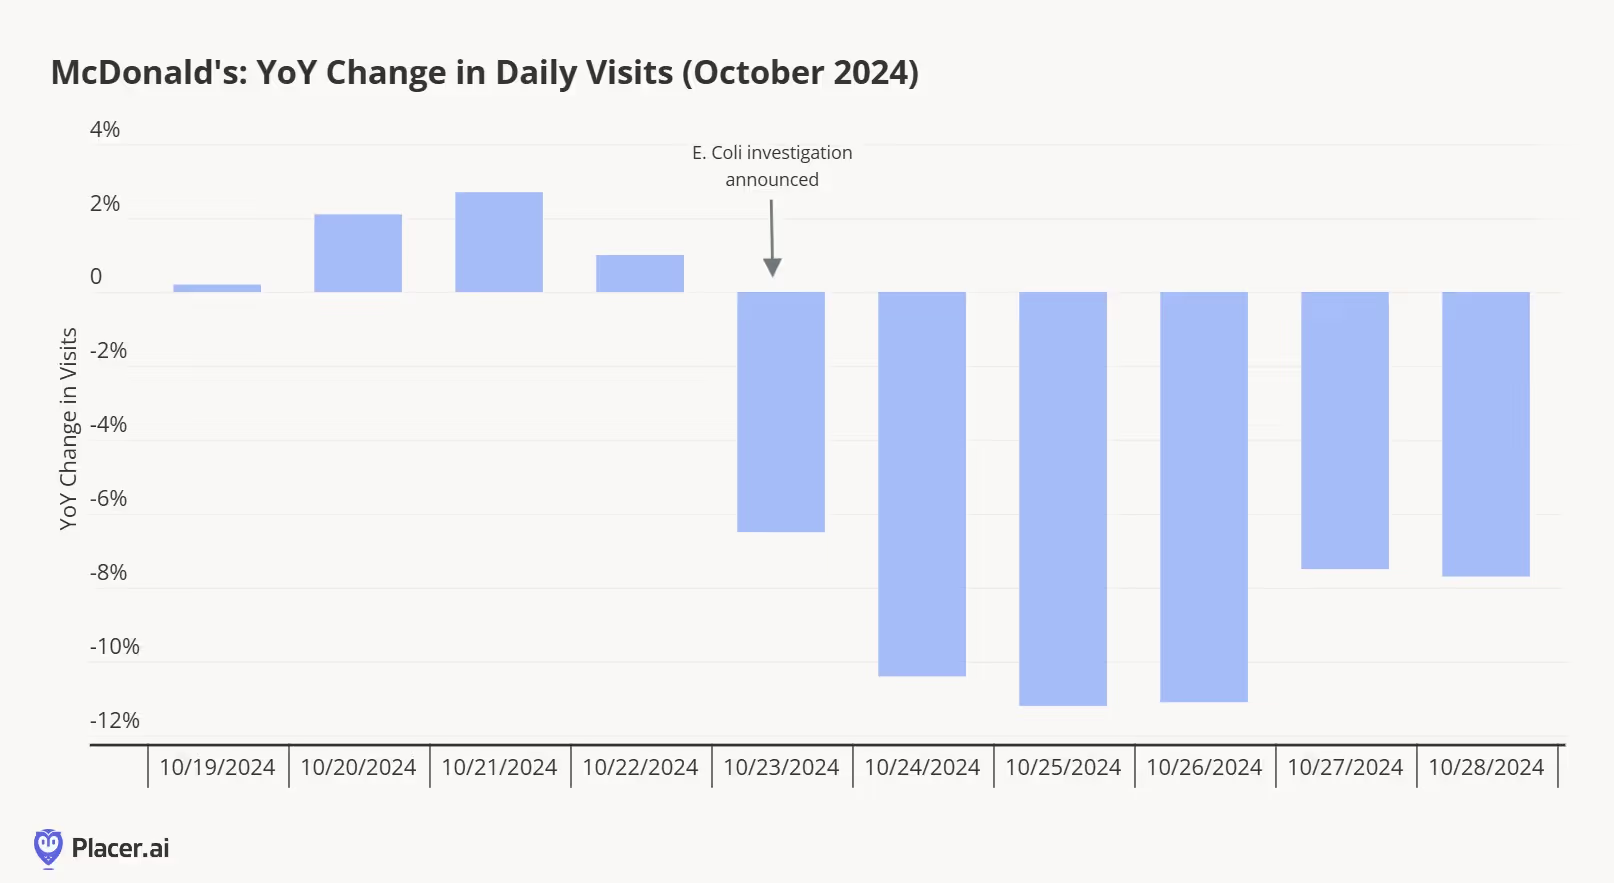
McDonald’s E. Coli outbreak did have a negative impact on visitation trends, but these trends may be short-lived. Our data indicated a 6.5% decline in year-over-year visits nationwide on Wednesday, Oct. 25 (the day after the E. Coli outbreak investigation was announced), 10%-11% declines from Oct. 26-Oct. 28, and 7%-8% declines from Oct 29-30. It’s natural to compare this situation to Chipotle’s E. Coli outbreak in 2015, where visitation trends were severely impacted for many months. However, there are meaningful differences between McDonald’s and Chipotle’s cases. First, McDonald’s was quickly able to identify and communicate the source of the outbreak–slivered onions from a Colorado Springs facility at supplier Taylor Farms, which were immediately removed from the company’s supply chain–while also ruling out its beef patties as a source, which has helped to keep the outbreak relatively contained. Second, in addition to an E. Coli outbreak, Chipotle also faced a norovirus outbreak, calling into question the safety of the chain’s entire supply chain. These differences help to explain why we may already be seeing visitation declines inflect at McDonald’s.
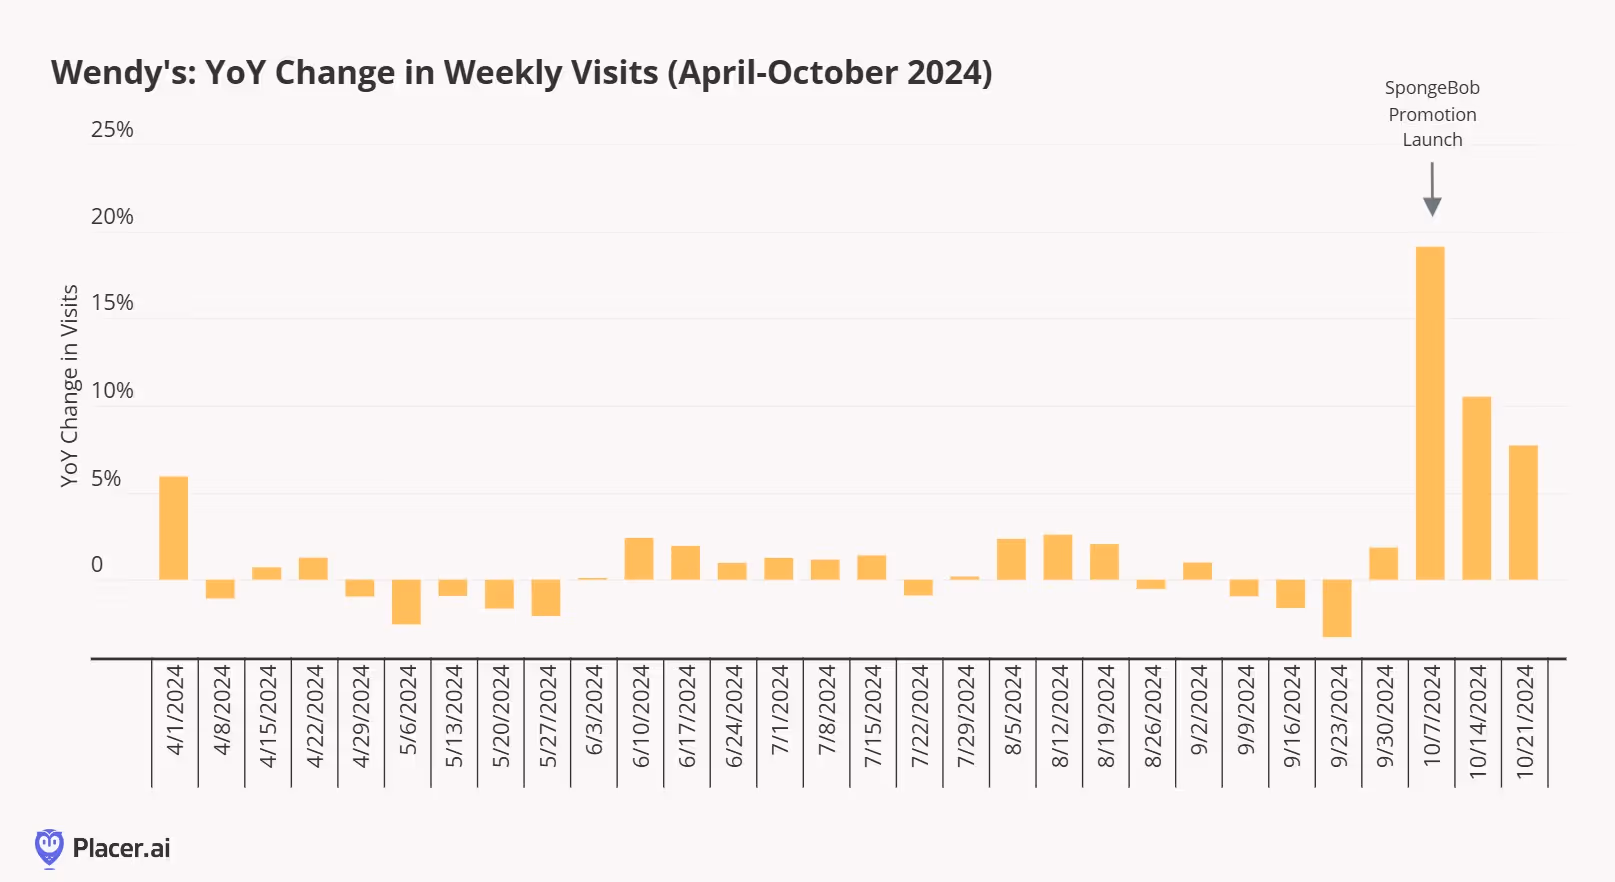
McDonald’s Collector’s Edition was not the only nostalgia-driven promotion driving visits in recent weeks, as Wendy’s Krabby Patty Burger and Pineapple Under the Sea Frosty celebrating SpongeBob's 25th anniversary drove a meaningful lift in visits (below). In fact, this might be the most successful limited-time-offer promotion that we’ve seen across the QSR sector since McDonald’s Adult Happy Meal in October 2022. Importantly, this promotion innovated on existing core menu items without adding complexity. Given the strong visitation lift, we expect more nostalgia-themed promotions in the year ahead.
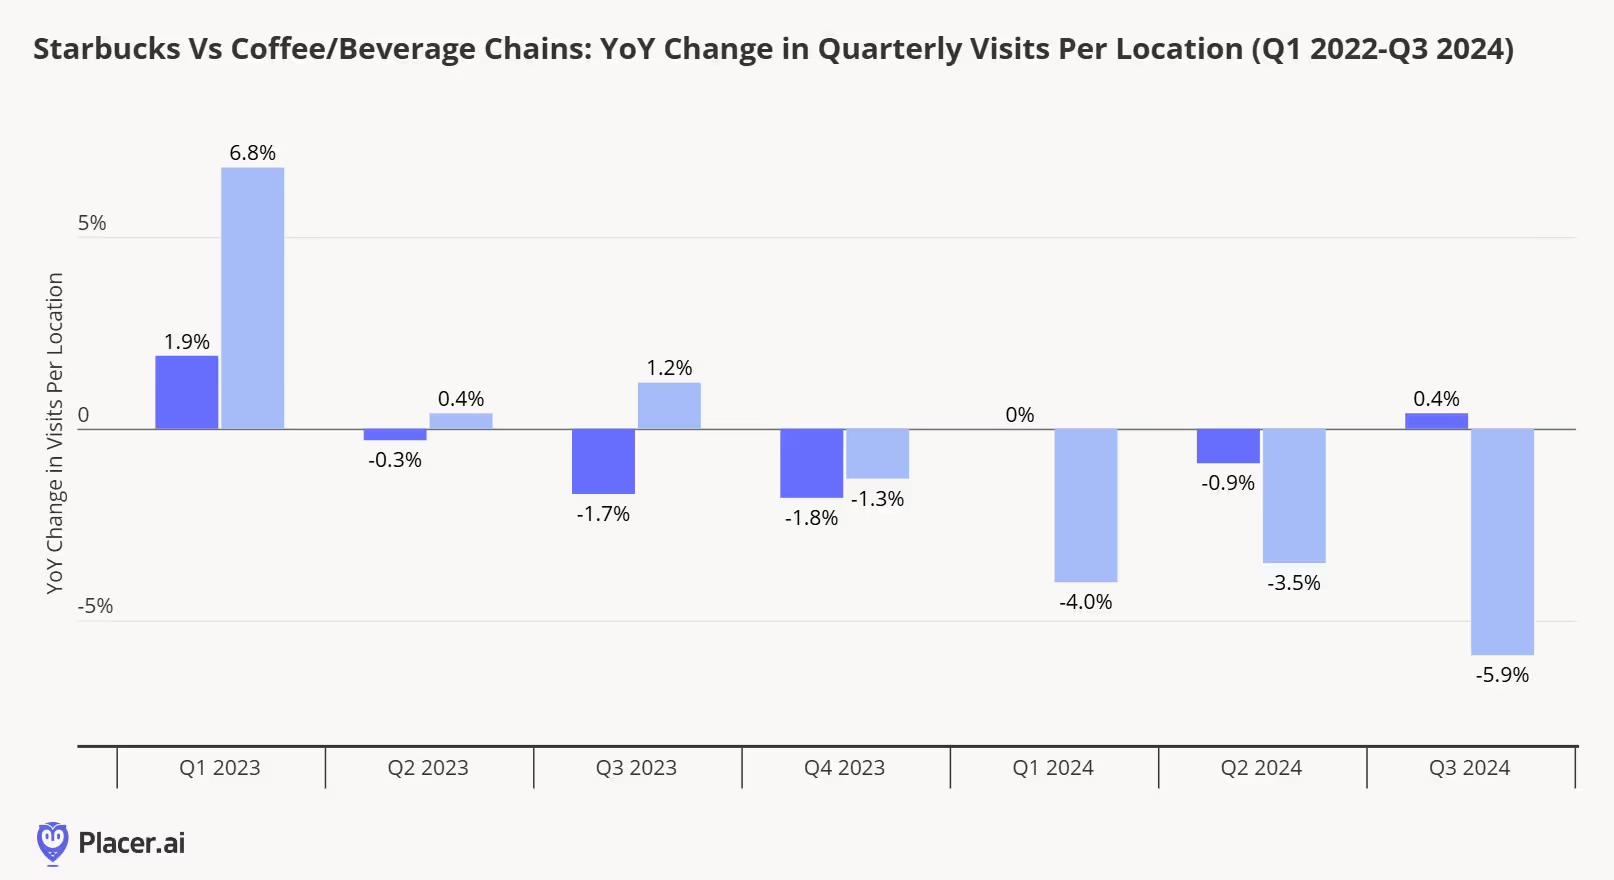
Starbucks’ preliminary fiscal Q4 2024 (July-September 2024) results--including a 10% decline in comparable transactions in its North America segment--reinforce that the company has "drifted from its core", as new Starbucks CEO Brian Niccol discussed following the release. The results also come at a time when other coffee and beverage chains are seeing year-over-year visit increases, reinforcing that new product innovations aren't connecting with consumers–management explained that “accelerated investments in an expanded range of product offerings coupled with more frequent in-app promotions and integrated marketing to entice frequency across the customer base did not improve customer behaviors.” (The difference between our visit per location figure and Starbucks’ reported number is likely due to lower coverage of urban stores in our platform).
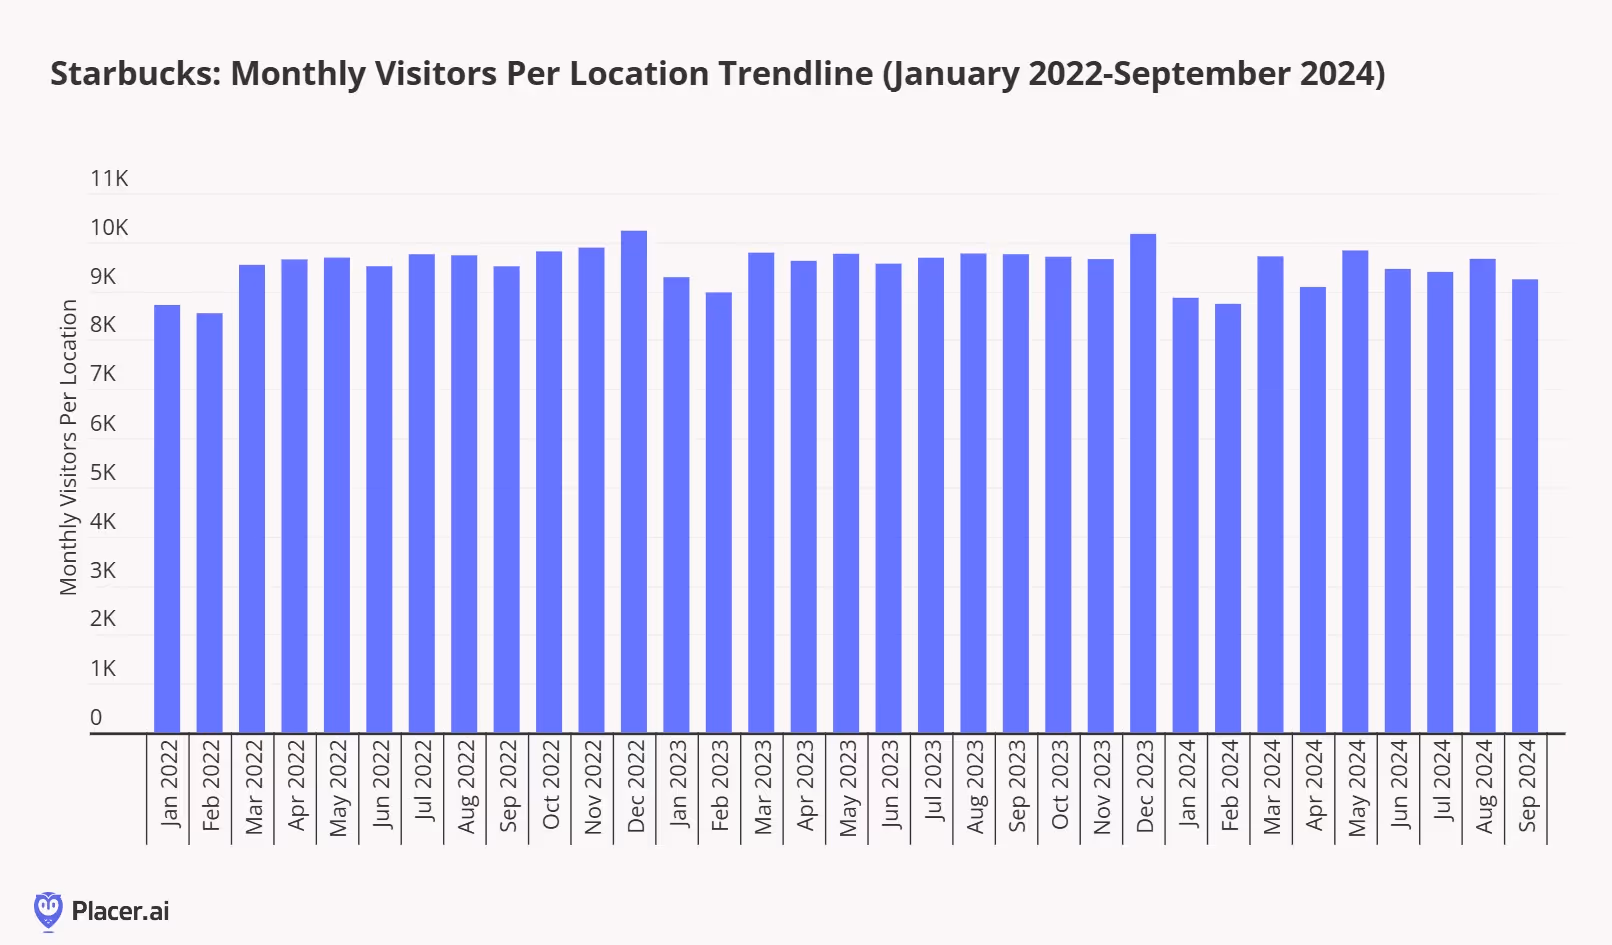
As we wrote when Niccol assumed the CEO role in August, Starbucks’ transformation won’t happen overnight, but the data behind Niccol’s early strategies at Chipotle still hints at a successful turnaround. Niccol's plan to improve the Starbucks customer experience, remove bottlenecks and operational complexities (including a more streamlined menu), and refine Mobile Order and Pay is a sound strategy, but it will take time to implement. Positively, we believe that Starbucks has a strong foundation to work from. Below, we show the monthly visitor per location trend line since the beginning of 2022. While declines in visit frequency is something the company will work to address with its current initiatives, the number of visitors coming into each location generally remains strong (down only 2%-3% per month on average thus far in 2024). Assuming the company can execute Niccol’s plan to reduce bottlenecks and operation complexities, Starbucks’ wide visitor reach should drive improved engagement and visit frequency.
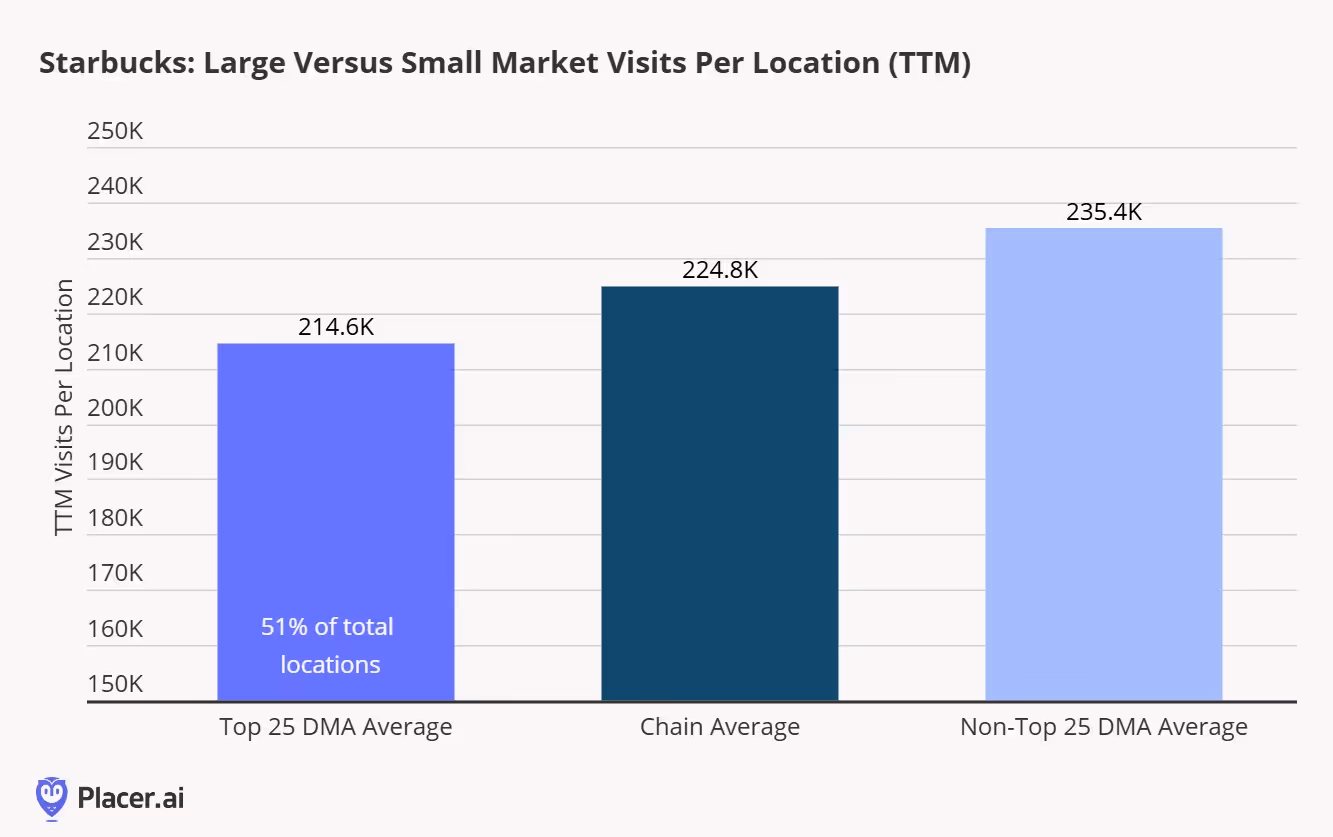
As we also pointed out a few months ago, we believe that Starbucks’ success in smaller underpenetrated markets have been somewhat overlooked. We analyzed Starbucks’ unit expansion opportunities in detail in September 2022, and we’ve seen progress on this initiative since then. Starbucks’ recent store development effects have been focused on “Tier 2 and Tier 3 cities where we see population growth and forecast both underserved demand and high incrementality.” We’ve revisited our visit per location data for Starbucks’ Top 25 designated market areas (DMAs) versus non-Top 25 DMAs over the last 12 full months below, and similar to our last update, Starbucks is seeing higher visits per location in its non-Top 25 markets. Many of these non-Top 25 DMA stores have been opened in the past 12-18 months, which suggests improved metrics as operational complexities are reduced and these locations enter the same-store sales base.

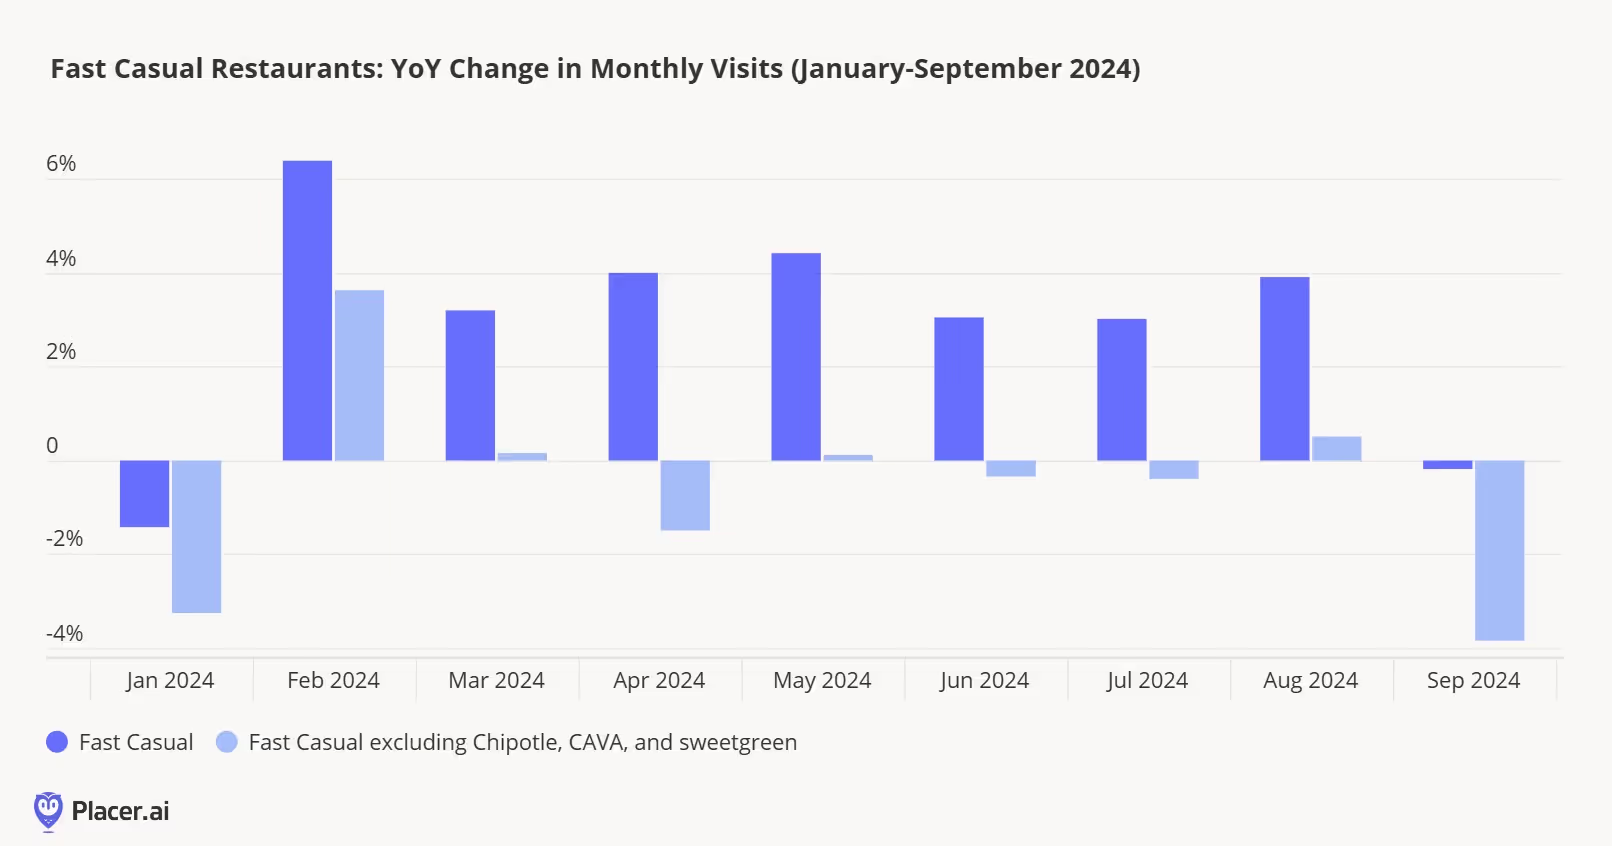
Most chains attending the 2024 Fast Casual Executive Summit in Denver acknowledged that this year has been difficult (unless you happen to be Chipotle, CAVA, or sweetgreen). We’ve highlighted a number of the challenges restaurant operators faced this past year, including inclement weather to start the year, the restaurant value wars of 2024, encroachment from other food retail channels, and the rising cost of operating a restaurant, which has resulted in increased bankruptcies. Our data validates this stance–our data shows that the fast casual category excluding the three aforementioned chains has seen year-over-year visitation declines.
Why are these three chains outperforming? As we’ve discussed in the past, we believe it comes down to (1) innovation; and (2) operational excellence. Recently, we looked at the importance of Chipotle’s Chicken al Pastor relaunch for Q2 2024 sales trends, sweetgreen’s increase in comparable visits that was helped by the launch of Caramelized Garlic Steak as a protein option, and CAVA’s exceptionally strong visitation trends due the launch of grilled steak at the beginning of June. However, innovation is only part of the outperformance, as each of these chains have also done a great job integrating their digital ordering platforms and in-store assembly line efforts, allowing for greater customization (something consumers appear to be willing to pay a premium for) and driving some of the strongest throughput numbers we’ve observed with our data.
The executives we spoke to at this week’s event had a gameplan to overcome these challenges in 2025.
- Navigating value wars. Most operators we spoke to at the event acknowledged that the Restaurant Value Wars of 2024 and more promotional pricing by grocery stores/superstores, and increased competition from c-stores has been a headwind this year. Despite consumers being very deal-driven consumers, most fast casual operators we spoke to planned to follow in Chipotle, CAVA, and sweetgreen’s innovation to drive improved visits rather than utilizing bundled value meals.
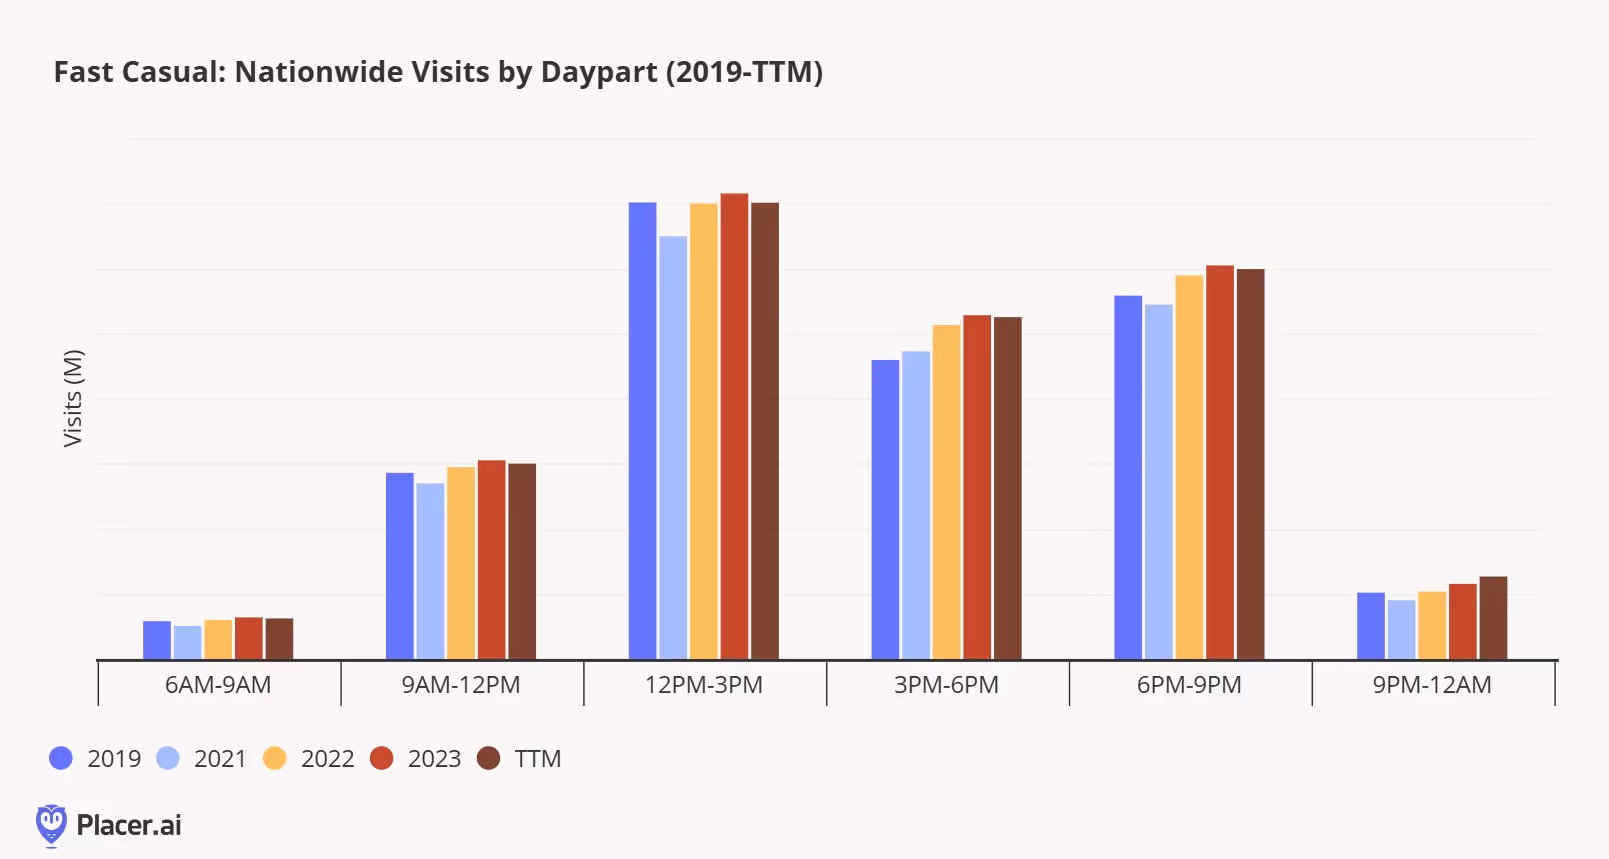
- Shift in consumer daypart preferences changes restaurant operations. Changes in consumers’ daily routines was a frequent topic at the event, including fewer visits during the early morning daypart, steady visit trends in the late morning, and early afternoon dayparts, but also an increase in dinner and late night dayparts (a topic we’ve looked at with Chipotle in the past as well). Some chains have reallocated labor or increasingly utilizing third-party delivery companies to accommodate these changes in demand.
- “Familiarity” and its role in market expansion. One executive we spoke with believed “familiarity” was a key motivating factor for consumers in a more challenging macroeconomic environment. Put another way, consumers have less discretionary dollars after years of elevated food, rent, healthcare, and insurance inflation, so when they choose to dine out, they are turning to brands they are familiar with and trust. As such, this preference for familiar brands may be negatively impacting brands when they enter a new market. Historically speaking, a restaurant brand that opens a location in a new market expects to see 75% of the sales/visits that a location in an established market does. It varies by concept and market, but our data suggests that new restaurant visit trends are much lower for those chains that are expanding to new markets for the first time. Not surprising, many operators told us their 2025 expansion plans would focus more on in-filling existing markets rather than expanding to new markets.
Another executive told us that the currently challenging backdrop would ultimately make chains better operators. Not every chain can be Chipotle, CAVA, or sweetgreen, but there are still a lot of their strategies that restaurants can adopt to improve their own operations.

Introduction
2024 has been another challenging year for retailers. Still-high prices and an uncertain economic climate led many shoppers to trade down and cut back on unnecessary indulgences. Value took center stage, as cautious consumers sought to stretch their dollars as far as possible.
But price wasn’t the only factor driving consumer behavior in 2024. This past year saw the rise of a variety of retail and dining trends, some seemingly at odds with one another. Shoppers curbed discretionary spending, but made room in their budgets for “essential non-essentials” like gym memberships and other wellness offerings. Consumers placed a high premium on speed and convenience, while at the same time demonstrating a willingness to go out of their way for quality or value finds. And even amidst concern about the economy, shoppers were ready to pony up for specialty items, legacy brands, and fun experiences – as long as they didn’t break the bank.
How did these currents – likely to continue shaping the retail landscape into 2025 – impact leading brands and categories? We dove into the data to find out.
Conventional Value Reaching Its Ceiling
Bifurcation has emerged as a foundational principle in retail over the past few years: Consumers are increasingly gravitating toward either luxury or value offerings and away from the ‘middle.’ Add extended economic uncertainty along with rapid expansions and product diversification from top value-oriented retailers, and you have an explosion of visits in the value lane.
But we are seeing a ceiling to that growth – especially in the discount & dollar store space. Throughout 2023 and the first part of 2024, visits to discount & dollar stores increased steadily. But no category can sustain uninterrupted visit growth forever. Since April 2024, year–over-year (YoY) foot traffic to the segment has begun to slow, with September 2024 showing just a modest 0.8% YoY visit increase.
Discount & dollar stores, which attract lower-income shoppers compared to both grocery stores and superstores, have also begun lagging behind these segments in visit-per-location growth. In Q3, the average number of visits to each discount and dollar store location remained essentially flat compared to 2023 (+0.2%), while visits per location to superstores and grocery stores grew by 2.8% and 1.0%, respectively. As 2024 draws to a close, it is the latter segments, which appeal to shoppers with incomes closer to the nationwide median of $76.1K, which are seeing better YoY performance.
The deceleration doesn’t mean that discount retailers are facing existential risk – discount & dollar stores are still extremely strong and well-positioned with focused offerings that resonate with consumers. The visitation data does suggest, however, that future growth may need to focus on initiatives other large-scale fleet expansions. Some of these efforts will involve moving upmarket (see pOpShelf), some will focus on fleet optimization, and others may include new offerings and channels.
Return of the middle anyone?
Innovative and Disruptive Value Shake Up Retail and Dining
Still, in an environment where consumers have been facing the compounded effects of rising prices, value remains paramount for many shoppers. And brands that have found ways to let customers have their cake and eat it too – enjoy specialty offerings and elevated experiences without breaking the bank – have emerged as major visit winners this year.
Trader Joe’s Drives Visits With Private Label Innovation
Trader Joe’s, in particular, has stood out as one of the leading retail brands for innovative value in 2024, a trend that is expected to continue into 2025.
Trader Joe’s dedicated fan base is positively addicted to the chain’s broad range of high-quality specialty items. But by maintaining a much higher private label mix than most grocers – approximately 80%, compared to an industry average of 25% to 30% – the retailer is also able to keep its pricing competitive. Trader Joe’s cultivates consumer excitement by constantly innovating its product line – there are even websites dedicated to showcasing the chain’s new offerings each season. In turn, Trader Joe’s enjoys much higher visits per square foot than the rest of the grocery category: Over the past twelve months, Trader Joe’s drew a median 56 visits per square foot – compared to 23 for H-E-B, the second-strongest performer.
Chili’s Beats QSR at its Own Game
Casual dining chain Chili’s has also been a standout on the disruptive value front this past year – offering consumers a full-service dining experience at a quick-service price point.
Chili’s launched its Big Smasher Burger on April 29th, 2024, adding the item to its popular ‘3 for Me’ offering, which includes an appetizer, entrée, and drink for just $10.99 – lower than than the average ticket at many quick-service restaurant chains. The innovative promotion, which has been further expanded since, continues to drive impressive visitation trends. With food-away-from-home inflation continuing to decelerate, this strategy of offering deep discounts is likely to continue to be a key story in 2025.
The Convenience Myth
Convenience is king, right?
Well, probably not. If convenience truly were king, visitors would orient themselves to making fewer, longer visits to retailers – to minimize the inconvenience of frequent grocery trips and spend less time on the road. But analyzing the data suggests that, while consumers may want to save time, it is not always their chief concern.
Looking at the superstore and grocery segments (among others) reveals that the proportion of visitors spending under 30 minutes at the grocery store is actually increasing – from 73.3% in Q3 2019 to 76.6% in Q3 2024. This indicates that shoppers are increasingly willing to make shorter trips to the store to pick up just a few items.
At the same time, more consumers than ever are willing to travel farther to visit specialty grocery chains in the search of specific products that make the visit worthwhile.
Cross visitation between chains is also increasing – suggesting that shoppers are willing to make multiple trips to find the products they want – at the right price point. Between Q3 2023 and Q3 2024, the share of traditional grocery store visitors who also visited a Costco at least three times during the quarter grew across chains.
Does this mean convenience doesn’t matter? Of course not. Does it indicate that value, quality and a love of specific products are becoming just as, if not more, important to shoppers? Yes.
The implications here are very significant. If consumers are willing to go out of their way for the right products at the right price points – even at the expense of convenience – then the retailers able to leverage these ‘visit drivers’ will be best positioned to grow their reach considerably. The willingness of consumers to forego convenience considerations when the incentives are right also reinforces the ever-growing importance of the in-store experience.
So while convenience may still be within the royal family, the role of king is up for grabs.
Serving Diners Quicker With Automatization
Chipotle Draws Crowds With Autocado
Convenience may not be everything, but the drive for quicker service has emerged as more important than ever in the restaurant space. Diners want their fast food… well, as fast as possible. And to meet this demand, quick-service restaurants (QSRs) and fast-casual chains have been integrating more technology into their operations. Chipotle has been a leader in this regard, unveiling the “Autocado” robot at a Huntington Beach, California location last month. The robot can peel, pit, and chop avocados in record time, a major benefit for the Tex-Mex chain.
And the Autocado seems to be paying off. The Huntington Beach location drew 10.0% more visits compared to the average Chipotle location in the Los Angeles-Long Beach-Anaheim metro area in Q3 2024. Visitors are visiting more frequently and getting their food more quickly – 43.9% of visits at this location lasted 10 minutes or less, compared to 37.5% at other stores in the CBSA.
Are diners flocking to this Chipotle location to watch the future of avocado chopping in action, or are they enticed by shorter wait times? Time will tell. But with workers able to focus on other aspects of food preparation and customer service, the innovation appears to be resonating with diners.
McDonald’s Leans into Automation in Texas
McDonald’s, too, has leaned into new technologies to streamline its service. The chain debuted its first (almost) fully automated, takeaway-only restaurant in White Settlement, TX in 2022 – where orders are placed at kiosks or on app, and then delivered to customers by robots. (The food is still prepared by humans.) Unsurprisingly, the restaurant drives faster visits than other local McDonald’s locations – in Q3 2023, 79.7% of visits to the chain lasted less than 10 minutes, compared to 68.5% for other McDonald’s in the Dallas-Fort Worth-Arlington, TX CBSA. But crucially, the automated location is also busier than other area McDonald’s, garnering 16.8% more visits in Q3 than the chain’s CBSA-wide average. And the location draws a higher share of late-night visits than other area McDonald’s – customers on the hunt for a late-night snack might be drawn to a restaurant that offers quick, interaction-free service.
Evolving Retail Formats - Finding the Right Fit
Changing store formats is another key trend shaping retail in 2024. Whether by reducing box sizes to cut costs, make stores more accessible, or serve smaller growth markets – or by going big with one-stop shops, retailers are reimagining store design. And the moves are resonating with consumers, driving visits while at the same improving efficiency.
Macy’s Draws Local Weekday Visitors With Small-Format Stores
Macy’s, Inc. is one retailer that is leading the small-format charge this year. In February 2024, Macy’s announced its “Bold New Chapter” – a turnaround plan including the downsizing of its traditional eponymous department store fleet and a pivot towards smaller-format Macy’s locations. Macy’s has also continued to expand its highly-curated, small-format Bloomie’s concept, which features a mix of established and trendy pop-up brands tailored to local preferences.
And the data shows that this shift towards small format may be helping Macy’s drive visits with more accessible and targeted offerings that consumers can enjoy as they go about their daily routines: In Q3 2024, Macy’s small-format stores drew a higher share of weekday visitors and of local customers (i.e. those coming from less than seven miles away) than Macy’s traditional stores.
Harbor Freight Tools and Ace Hardware Serve Smaller Growth Markets With Less Square Footage
Small-format stores are also making inroads in the home improvement category. The past few years have seen consumers across the U.S. migrating to smaller suburban and rural markets – and retailers like Harbor Freight Tools and Ace Hardware are harnessing their small-format advantage to accommodate these customers while keeping costs low.
Harbor Freight tools and Ace Hardware’s trade areas have a high degree of overlap with some of the highest growth markets in the U.S., many of which have populations under 200K. And while it can be difficult to justify opening a Home Depot or Lowe’s in these hubs – both chains average more than 100,000 square feet per store – Harbor Freight Tools and Ace Hardware’s smaller boxes, generally under 20,000 square feet, are a perfect fit.
This has allowed both chains to tap into the smaller markets which are attracting growing shares of the population. And so while Home Depot and Lowe’s have seen moderate visits declines on a YoY basis, Harbor Freight and Ace Hardware have seen consistent YoY visit boosts since Q1 2024 – outperforming the wider category since early 2023.
Hy-Vee Bucks the Trend by Going Big
Are smaller stores a better bet across the board? At the end of the day, the success of smaller-format stores depends largely on the category. For retail segments that have seen visit trends slow since the pandemic – home furnishings and consumer electronics, for example – smaller-format stores offer brands a more economical way to serve their customers. Retailers have also used smaller-format stores to better curate their merchandise assortments for their most loyal customers, helping to drive improved visit frequency.
That said, a handful of retailers, such as Hy-Vee, have recently bucked the trend of smaller-format stores. These large-format stores are often designed as destination locations – Hy-Vee’s larger-format locations usually offer a full suite of amenities beyond groceries, such as a food hall, eyewear kiosk, beauty department, and candy shop. Rather than focusing on smaller markets, these stores aim to attract visitors from surrounding areas.
Visit data for Hy-Vee’s large-format store in Gretna, Nebraska indicates that this location sees a higher percentage of weekend visits than other area locations – 37.7% compared to 33.1% for the chain’s Omaha CBSA average – as well as more visits lasting over 30 minutes (32.9% compared to 21.9% for the metro area as a whole). For these shoppers, large-format, one-stop shops offer a convenient – and perhaps more exciting – alternative to traditionally sized grocery stores. The success of the large-format stores is another sign that though convenience isn’t everything in 2024, it certainly resonates – especially when paired with added-value offerings.
A Resurgence of Legacy Brands
Many retail brands have entrenched themselves in American culture and become an extension of consumers' identities. And while some of these previously ubiquitous brands have disappeared over the years as the retail industry evolved, others have transformed to keep pace with changing consumer needs – and some have even come back from the brink of extinction. And the quest for value notwithstanding, 2024 has also seen the resurgence of many of these (decidedly non-off-price) legacy brands.
In apparel specifically, Gap and Abercrombie & Fitch – two brands that dominated the cultural zeitgeist of the 1990s and early 2000s before seeing their popularity decline somewhat in the late aughts and 2010s – may be staging a comeback. Bed Bath & Beyond, a leader in the home goods category, is also making a play at returning to physical retail through partnerships.
Anthropologie, another legacy player in women’s fashion and home goods, is also on the rise. Anthropologie’s distinctive aesthetic resonates deeply with consumers – especially women millennials aged 30 to 45. And by capturing the hearts of its customers, the retailer stands as a beacon for retailers that can hedge against promotional activity and still drive foot traffic growth.
And visits to the chain have been rising steadily. In Q4 2023, the chain experienced a bigger holiday season foot traffic spike than pre-pandemic, drawing more overall visits than in Q4 2019. And in Q3 2024, visits were higher than in Q3 2023.
Meeting the Evolving Needs of Millennials
And speaking of the 35 to 40 set – the generation that all retailers are courting? Millennials. Does that sound familiar? Yes, because this is the same generational cohort that retailers tried to target a decade ago. As millennials have aged into the family-formation stage of life, their retail needs have evolved, and the industry is now primed to meet them.
Sam’s Club Draws Value-Conscious Singles and Starters
From the revival of nostalgic brands like the Limited Too launch at Kohl’s to warehouse clubs expanding memberships to younger consumers as they move to suburban and rural communities, there are myriad examples of retailers reaching out to this cohort. And Sam’s Club offers a prime example of this trend.
Over the past few years, millennials and Gen-Zers have emerged as major drivers of membership growth at Sam’s Club, drawn to the retailer’s value offerings and digital upgrades – like the club’s Scan & Go technology. Over the same period, Sam’s Club has grown the share of “Singles and Starters” households in its captured market from 6% above the national benchmark in Q3 2019 to 15% in Q3 2024. And with plans to involve customers in co-creating products for its private-label brand, Sam’s Club may continue to grow its market share among this value-conscious – but also discerning and optimistic – demographic.
Taco Bell Brings in Crowds With Value Nostalgia Menu
Millennials are also now old enough to wax nostalgic about their youth – and brands are paying attention. This summer, Taco Bell leaned into nostalgia with a promotion bringing back iconic menu items from the 60s, 70s, 80s, and 90s – all priced under $3. The promotion, which soft-launched at three Southern California locations in August, was so successful that the company is now offering the specials nationwide. The three locations that trialed the “Decades Menu” saw significant boosts in visits during the promotional period compared to their daily averages for August. And people came from far and wide to sample the offerings – with a higher proportion of visitors traveling over seven miles to reach the stores while the items were available.
What Lies Ahead?
Hot on the heels of a tumultuous 2023, 2024’s retail environment has certainly kept retailers on their toes. While embracing innovative value has helped some chains thrive, other previously ascendant value segments, including discount & dollar stores, may have reached their growth ceilings. Consumers clearly care about convenience – but are willing to make multiple grocery stops to find what they need. At the same time, legacy brands are plotting their comeback, while others are harnessing the power of nostalgia to drive millennials – and other consumers – through their doors.

