


.svg)


It’s no secret that the restaurant category is starting to get more promotional. As consumers–especially lower income consumers–have shifted toward substitute food retail channels like value grocers, warehouse clubs, and convenience stores due to the compounded effect of food-away-from home inflation, restaurant chains across all tiers are resorting to increased promotional activity to drive visit trends.
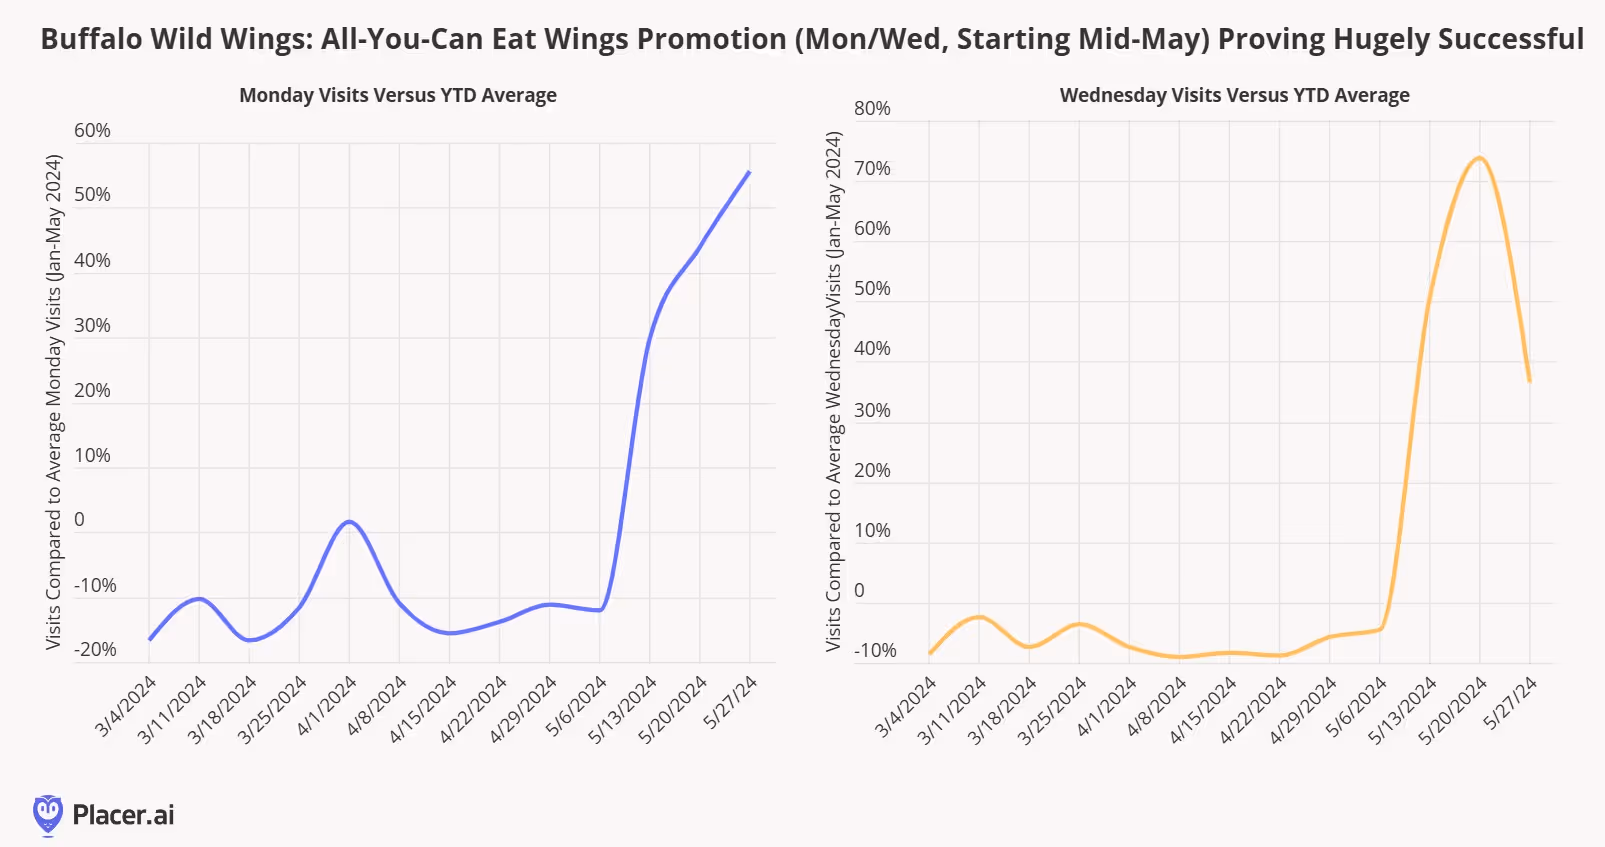
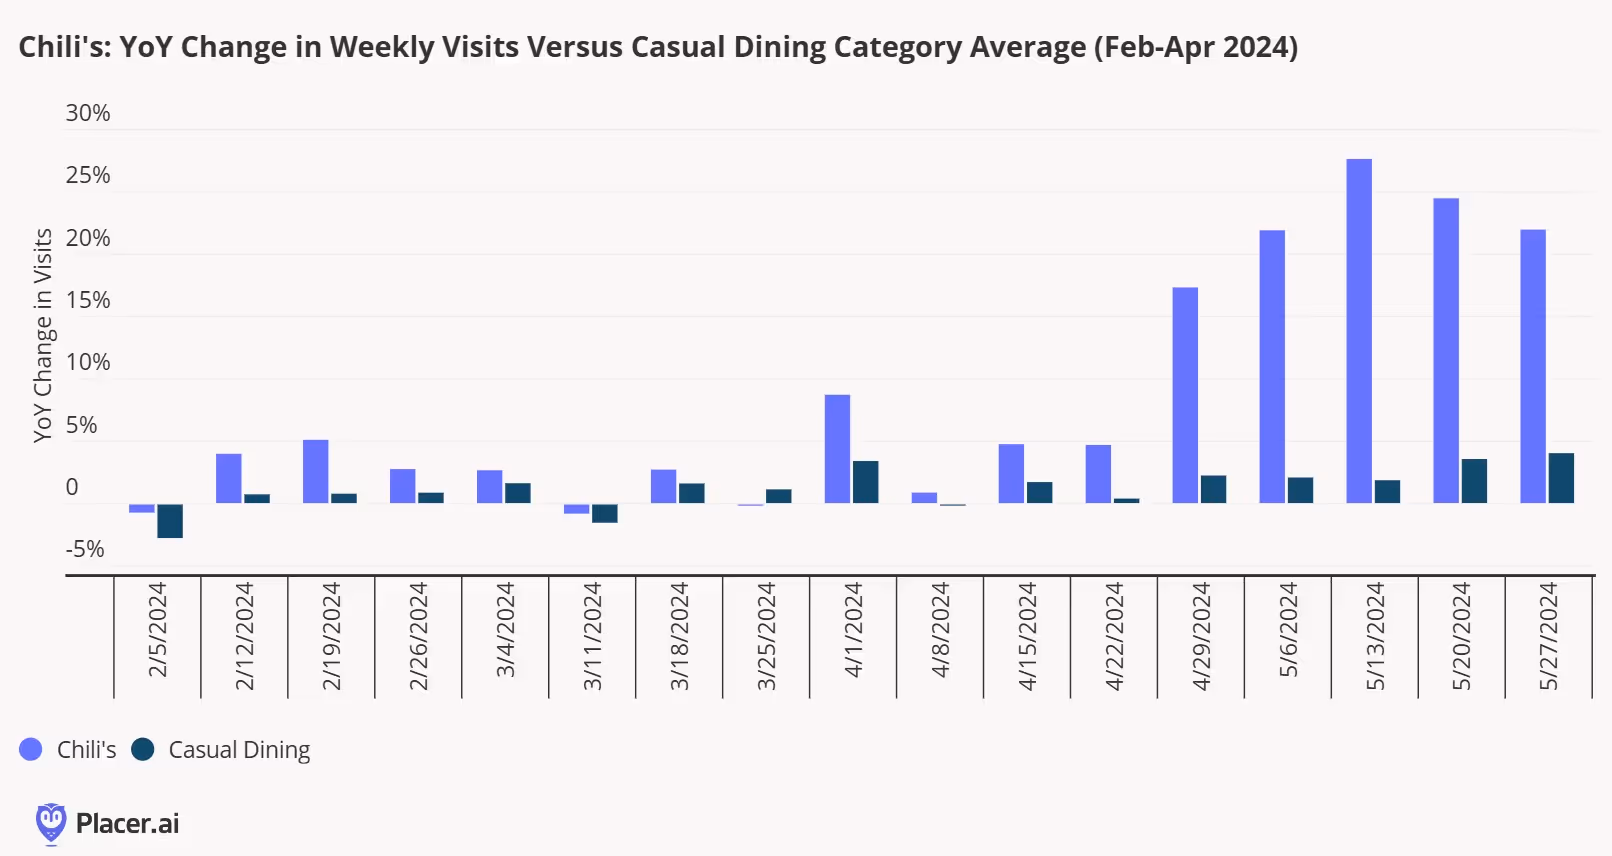
Over the past few weeks, we’ve discussed that several casual dining chains had seen success through all-you-can eat and other deep discount promotions. Last week, we noted that Chili’s had been outperforming broader casual-dining category averages through its value messaging. We also noted the success of Buffalo Wild Wings All-You-Can Eat wings promotions on Monday and Wednesdays starting in mid-May. Below, we show visit trends to Buffalo Wild Wings on Mondays and Wednesdays compared to their year-to-date averages since the beginning of March. The promotion has helped to drive incremental visits on two traditionally slower days. During May, the chain was seeing visits greater than 30% its normal daily visit count for Mondays and Wednesdays during the earlier part of the promotion and exceeding 50% during the latter part of the month. While it's unlikely that this promotion will be permanent–restaurants have to work with their suppliers ahead of time to make sure they have sufficient food for promotions like this–but given the success, the chain may consider running during other months (and potentially other days of the week) later this year.
However, as we noted in our recap of this year’s National Restaurant Association show, QSR chains have started to get more promotional ahead as they look to recapture visit share lost to value grocers, dollar stores, and c-stores (especially within lower-income trade areas). McDonald’s will launch a national $5 value menu promotion on June 25, but it’s clear that other QSR chains are already seeing success with their competing $5 promotions. Below, we show year-over-year weekly visit trends from March through early June for the major QSR burger chains. Burger King launched its own $5 Your Way Meal value menu this past week, and has seen visit trends accelerate since then. Starbucks–which has historically stayed away from discounts as a way to protect its premium brand position–also surprised the industry by announcing a $5-$7 “pairings menu” this week.

Easing commodity costs have allowed restaurants to get more promotional, although when paired with rising labor costs (especially in California, which we covered last week), it does set up an environment where restaurant profits will likely be squeezed over the next several months. Also, substitute food retail channels are likely to introduce their own price reductions in the months to come (as we’ve already seen from Walmart).
Over the past few months, we’ve noted how consumers–particularly from lower-income trade areas–have started to migrate from QSR to value-grocers, dollar stores, and convenience stores. Against that backdrop, we wanted to examine visitation trends for QSR chains in the state of California, where a $20 per hour minimum wage law was put in place on April 1 for employees of fast-food chains with more than 60 locations nationwide (with some exemptions for smaller stores at grocery stores, airports, and entertainment venues). This represented a 25% increase from the previous minimum wage for fast-food employees of $16 per hour (which remains the state’s minimum wage for other categories except for workers in healthcare facilities, which also saw minimum wage increased to $20 per hour).
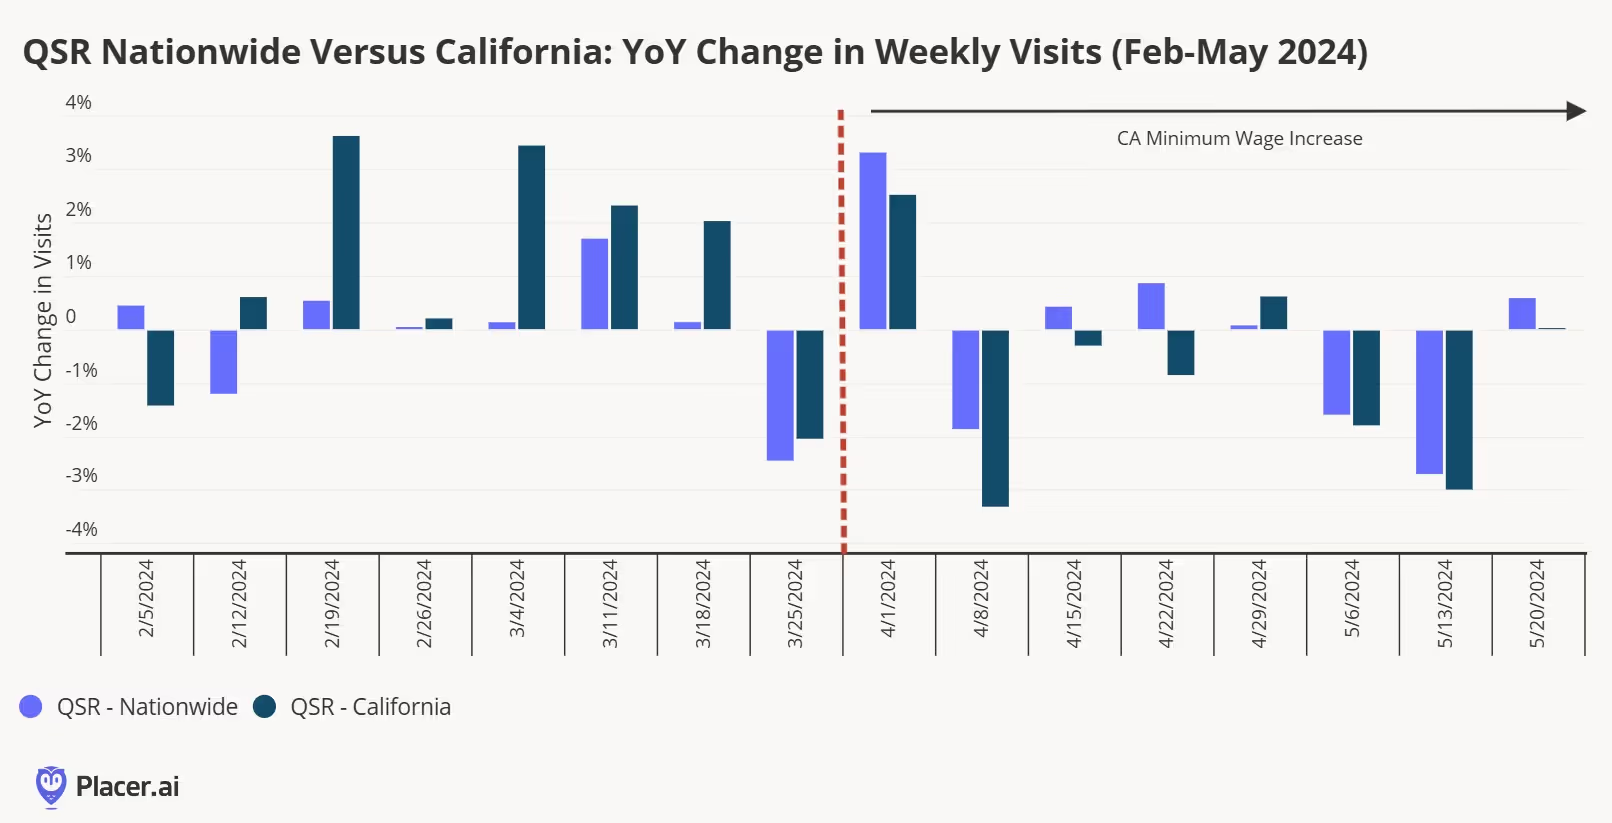
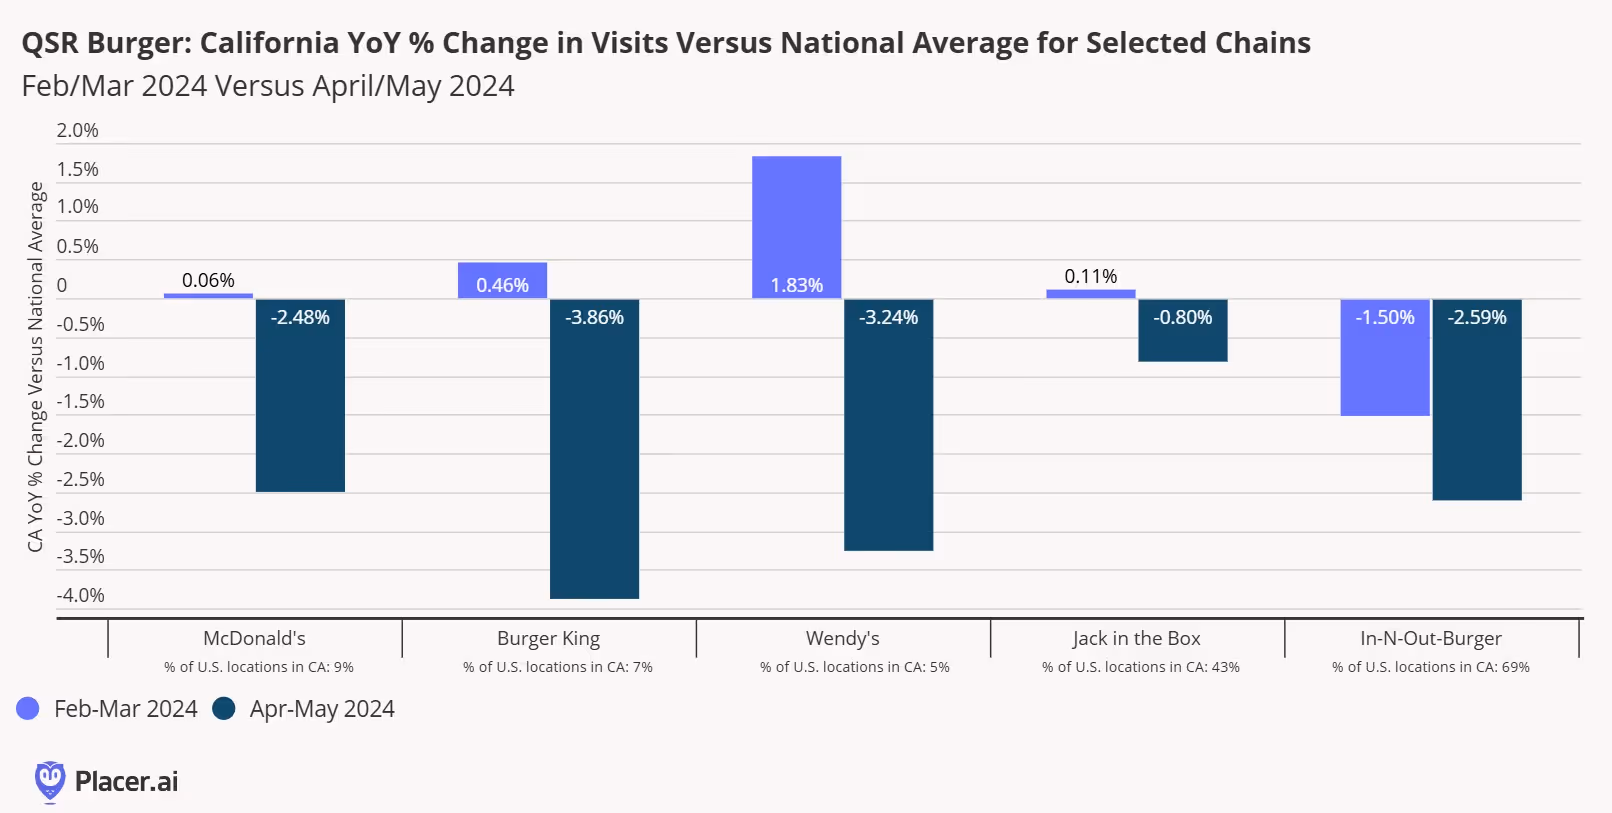
As a result of the minimum wage increase, most chains have raised prices in the region anywhere from the mid-single digits to the midteens. We compared year-over-year visit trends for QSR chains nationwide and California, and it’s clear that the menu price increase is having an impact. During February-March 2024 (we’ve excluded January due to inclement weather across much of the country), year-over-year QSR visit trends in the state of California had been running slightly ahead of national averages (below). However, this abruptly shifted when the minimum wage increase went into effect, with the nationwide visit trend year-over-year exceeding the state average seven of the eight weeks during the April-May 2024 timeframe.
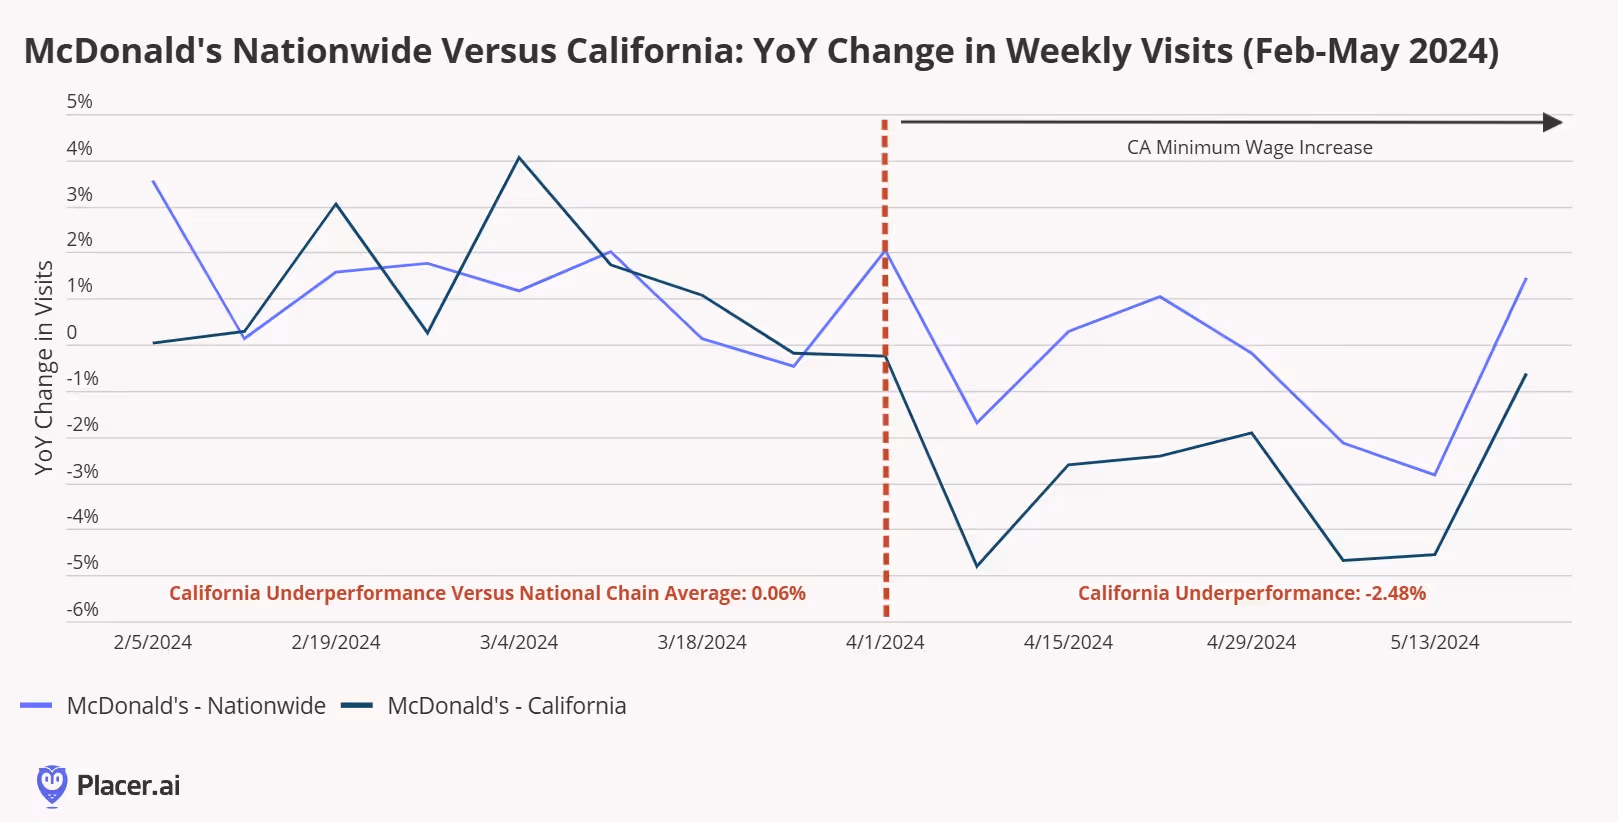
We also see the impact at the chain level. Below, we’ve looked at year-over-year visitation trends for McDonald’s nationwide and in California (where about 9% of its restaurants are located) from February through May. Again, we see a situation where McDonald’s California was seeing roughly the same year-over-year visit trends as its national average during February-March but underperformed by almost 250 basis points after the minimum wage increase went into effect.
Our data indicates that QSR burger chains have generally been the hardest hit by the California increase in minimum wage and subsequent increase in menu prices. In addition to McDonald’s, we see that other large QSR burger chains in the state also underperformed their national average following the minimum wage increase. Chipotle–which raised menu prices by 6%-7% in California to help offset the minimum wage increase–also saw year-over-year visit trends in California underperform its national average in April and May.
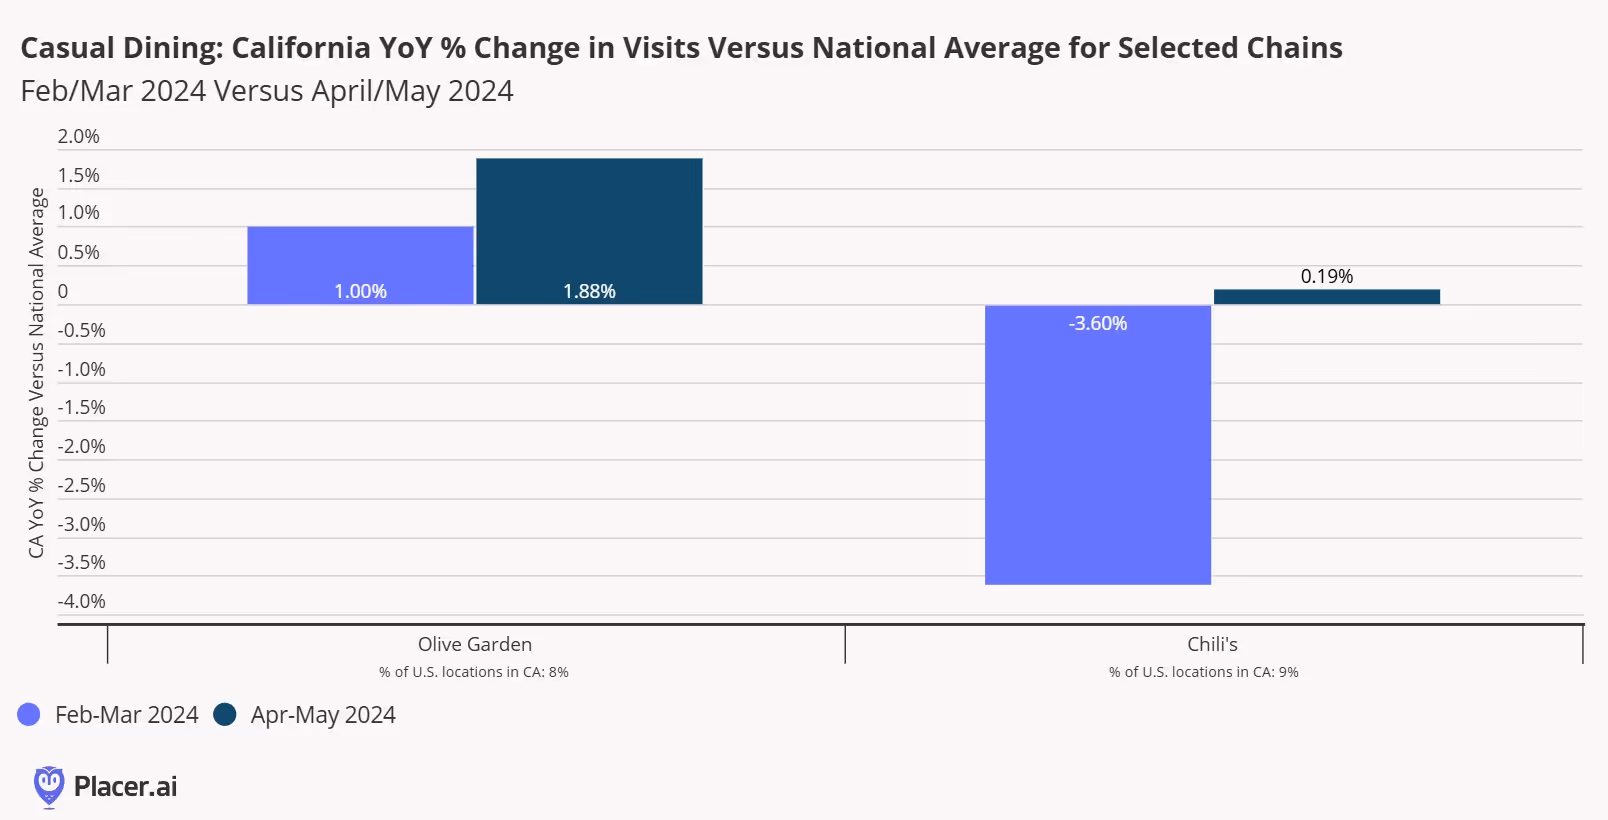
It’s early, but we’re starting to see the ripple effect of the minimum wage increase across the broader restaurant industry. First, we’ve started to see some operators close locations in the state, especially chains that were already facing financial difficulties. Earlier this week, Rubio’s Coastal Grill shut down almost 50 locations in California and filed for Chapter 11 bankruptcy protection, citing “significant increases to the minimum wage in California” as a reason for closing the restaurants. Second, the minimum wage hike and subsequent increase in QSR menu prices may be benefitting casual dining chains (many of which were already paying above the new minimum wages for many employees). Below, we see that Darden’s Olive Garden concept and Brinker International’s Chili’s concept in California have outperformed their national averages with respect to year-over-year visit trends starting in April (below). Finally, the minimum wage increase could make it more costly to do business across other retail and restaurant categories, something we called out in our recap of 99 Cents Only going out of business.
As we discussed following this year’s National Restaurant Association show, casual dining has been making a comeback the past several months, with many chains accentuating value proposition through promotions. Chili’s has seen visitation trends outperform casual-dining category averages by a significant amount the past several weeks (below) through its value messaging, while Buffalo Wild Wings All-You-Can Eat wings promotions on Monday and Wednesdays starting in mid-May has been one of the more successful promotions that we’ve seen in the full-service restaurant category in some time. However, with several QSR chains starting to get more promotional ahead of McDonald’s planned $5 value menu promotion at the end of the month, it’s clear that QSR chains are looking to also emphasize value in the coming months, even while facing higher labor costs.

Earlier this week, we attended the National Restaurant Association show in Chicago and had the chance to speak with a wide range of restaurant owner/operators (large chains, small chains, independents, and franchisees) as well as their vendors, distributors, and other technology solutions. We’ve already seen some great recaps of the event (including one from Nation’s Restaurant News), but we thought we’d offer some of our own observations from the event.
Fierce Fight for Visits Amid New Sources of Competition
We discussed this during our trade show preview last week, but concerns about slowing foot traffic trends and increased competition with alternative food retail channels like grocery, dollar stores, and convenience stores was easily the number one topic of discussion at the event. Most operators we spoke with acknowledged flat or year-over-year declines in comparable visits, which is consistent with the year-to-date on most of the restaurant subcategories we monitor (below)
Most of the restaurant executives we spoke to at the event also noted the improvements of prepared food offerings in the grocery and c-store channels as a competitive headwind. One executive even told us that “C-stores have gone from copying QSR category innovations to setting the bar higher in many ways.” We’ve seen this in the channel shift taking place across the food retail category, which we touched upon last week.
As it pertains to competition in the months ahead, operators across all categories admitted that they were curious about the ripple effect of McDonald’s plans to launch a $5 value menu on June 25 (which will run for a month). We’re already starting to see competitors try to front-run McDonald’s $5 value menu, and there will likely be others who introduce similar promotions in the coming weeks. While these offers are likely to help QSR chains recapture some of the visits lost to other channels, these chains will likely need to continue with their value messaging in the back half of the year (especially with the rollbacks taking place at Walmart, Target, and other superstore chains) while also committing to more menu innovation than we’ve seen year-to-date.
Coffee’s Momentum Continues–With A Notable Outlier
One of the two subcategories that is seeing year-over-year increases is coffee. Some of this growth has been fueled by expansion plans of Dutch Bros, 7 Brew Coffee, 151 Coffee, Scooter’s Coffee, Philz Coffee, particularly in the South and Southeast U.S. (something we touched on late last year). Below, we’ve put together a custom chain of drive-thru focused chains versus the category average to put some context behind where the growth in the category is coming from (although the category itself as a whole continues to see healthy growth).
Starbucks–which reported a 7% decline in comparable transactions during its January-March 2024 quarter–is one of the key outliers from this category. Starbucks CEO Laxman Narasimhan called the company’s performance “disappointing” on its most recent update call. There have been no shortage of opinions on why the chain has underperformed, but our data continues to indicate that occasional visitors are the root of the softer visitation trends, much like they were last quarter. To reverse these trends, the company has already launched flavored pearls for a series of summer seasonal drinks and an improved blueberry muffin. Additionally, the company plans to launch more sugar-free customization options (including syrups) as well as a zero-to-low-calorie energy beverage.
Casual Dining’s Quiet Comeback
The other restaurant category posting seeing year-over-year growth may come as a surprise: casual-dining chains. After a slow start to the year due to weather, the category has generally seen low-single-digit growth on a year-over-year basis (something Placer’s blog team pointed out a few weeks ago). Several executives in the casual dining space we spoke with noted that they had started to see improving trends, with a few citing a narrowing price gap with QSR/fast casual chains (in other words, if consumers are going to pay the same price per entree, they’ll gravitate toward casual dining) as well as a continued propensity to spend for events/holidays (a theme we touched on repeatedly in the past).
Where is the growth coming from? There are a couple of expected categories, including steakhouses, breakfast-first concepts, and eatertainment. Asian concepts have also performed well this year, helped by growth from experiential concepts like Kura Sushi and GEN Korean BBQ.
On the other end of the spectrum, we see weakness in Mexican and Seafood concepts. Seafood should not come as a surprise given that one of other notable development in the restaurant industry this week was Red Lobster’s bankruptcy announcement. The company's Endless Shrimp promotion has been widely blamed for the company's bankruptcy filing--and our visitation data does show a spike in visits coinciding with the promotion--but there were certainly other factors such as unfavorable lease terms that played a part.

Following a busy week of Q1 2024 updates several restaurant chains, the key question facing operators is whether menu price increases the past several years have forced consumers into alternative food retail channels. Several restaurant chains--most notably McDonald’s–highlighted a more “discriminating” consumer during their quarterly updates. According McDonald’s CEO Chris Kempczinski on the company’s Q1 2024 update this week: “U.S. consumers continued to be even more discriminating with every dollar that they spend as they faced elevated prices in their day-to-day spending which is putting pressure on the QSR industry.” In turn, this has resulted in flat-to-declining industry traffic in the U.S. during the quarter. Looking at year-to-date visitation trends across the different restaurant categories, we see a weak start to the year due to inclement weather, followed by a rebound to low-single-digit growth for the limited-service categories (QSR and fast casual) and low-single-digit declines for the full-service restaurant chains.
As we discuss throughout this week’s Anchor report, consumers will likely remain discriminating over the next several quarters. As such, we expect a continuation of the channel shifts we’ve been witnessing across the broader food retail sector. According to our data, the QSR category saw a +5% increase in visits from 2019-2023, while the full-service restaurant category saw a -8% decrease in visits (partly explained by the permanent closure of many smaller, regional full-service dining chains). Conversely, the grocery, superstore, convenience store, and dollar/discount stores have all seen meaningfully higher visit growth over the same period (as our friends at Restaurant Business have also called out), indicating these channels are taking share from the restaurant industry.
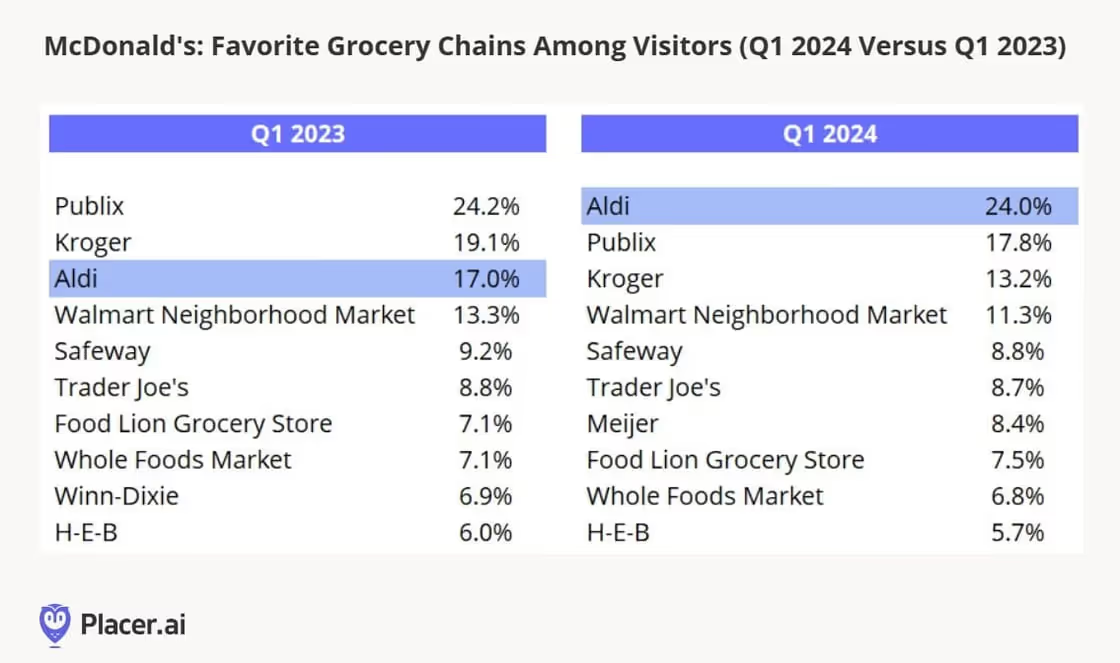
Looking at McDonald’s cross-visitation trends during the quarter, we see further evidence of this shift. We’ve compared the favorite grocery chains of McDonald’s visitors in Q1 2024 to Q1 2023 below. We see a material increase in the percentage of McDonald’s visitors that visited an Aldi location year-over-year–24% versus 17% in the year ago period. We also see a decrease in percentage of visits to most conventional grocery chains.
Not surprisingly, McDonald’s plans to accentuate its value offerings in the coming quarters. On its update call, management noted that 90% of its U.S. locations offer meal bundles for $4 or less and that it has been running several promotions through its digital app. The company also noted the need to align around a strong national value proposition so that the company can use its tremendous media scale to drive high consumer awareness. It will likely take time for McDonald’s to organize around its value platform, but once it does start to promote its value offerings on a nationwide basis, we would expect much of the rest of the QSR category to follow suit.
Last week, Chipotle’s Q1 2024 update featured a number of positives, including visitation trends that outperformed the broader restaurant category and strong contribution from new store openings. More than 5% of the company’s 7% comparable sales growth during the quarter was driven by transaction growth, and year-over-year visitation trends have accelerated thus far in April. (Recall that our year-over-year visitation data includes contribution from stores opened during the past year as well as improvements in visits per location).
Impressively, there were multiple sources driving Chipotle’s transaction growth during the quarter. The company’s strong track record for menu innovation under CEO Brian Niccol continued during the most recent quarter, with the company spotlighting Barbacoa and the return of Chicken Al Pastor as a limited time offer. Management will continue to explore new menu additions, and is currently developing a new product pipeline for the next 18-24 months.
While menu innovation is important, it’s clear that throughput (the amount of customers that can be served with Chipotle’s assembly line process) is becoming a major factor in visitation traffic outperformance. We believe this has been driven by lower employee turnover rates—the company noted that it is experiencing the lowest turnover rates since Niccol joined the company in March 2018. According to management, throughput reached the highest levels in four years because of more consistent staffing, which aligns with our visit per location data for the past five years (below).
Chipotle noted that its throughput improved by nearly 2 entrees in its peak 15 minutes compared to last year with each month showing an acceleration. According to the company, “the restaurants run more smoothly as our teams are properly trained and deployed, which allows them to keep up with demand without stress. This leads to more stability and therefore more experienced teams that execute better every day, and this can be seen in our latest turnover data which is at historically low levels.” Our data also shows that visitation trends are improving during its peak hours, but that its peak hours are also changing. Historically, the hours between 12:00 PM-2:00 PM have represented Chipotle’s most frequently visited hours, but post-pandemic, we’ve seen visits shift to the 6:00 PM-8:00 PM timeframe (below). Return-to-office trends partly explain these trends, as do Chipotle’s push into smaller, more suburban/rural markets.
When we look at visit per location trends by hour, we see that most of the improvement during the Q1 2024 compared to Q1 2023 took place during the later afternoon and evening dayparts.
Looking ahead, Chipotle sees an opportunity to improve peak hour throughput, including adjusting the cadence of digital orders to better balance the deployment of labor (thus eliminating the need to pull a crew member from the front makeline to help the digital makeline during peak periods). The company also plans to bring back a coaching tool for its associates that it had in place prior to the pandemic. With more and more retailers embracing generative AI to help educate and train their employees-–a trend we heard consistently at this week’s Analytics Unite conference–we would expect Chipotle to also adopt generative AI with its updated coaching tool, potentially unlocking greater throughput improvements in the process.
We recently looked at where the home improvement retail category stood after 1Q 2024, noting that industry had seen improved visit trends and that we could see continued momentum in the second half of 2024 as housing turnover picks up. As a follow up to that analysis, we thought we’d examine a wider range of retailers in the home improvement retail category. Below, we’ve presented year-over-year visitation trends for the top retailers in the home improvement category in terms of visits. While Home Depot and Lowe’s are down on a year-over-year basis, we see that a number of smaller box chains like Harbor Freight and Ace Hardware are seeing year-over-year visits (Large-box Menards has also been relatively strong).
The trend of smaller box home improvement retailers outperforming has actually been going on for a while. Below, we show share visit data from 2017-2023 for the largest home improvement retailers. Here we also see big gains from Ace Hardware and Harbor Freight
What explains these trends? We believe a lot of it boils down to store expansion and migration trends. Both chains have been growing. We discussed Ace Hardware’s unit growth plans back in November 2022, with the chain reaching 5,800 stores globally (and more than 4,700 in the U.S.) after opening 160 locations in 2022 and 170 in 2023. We’ve also called out Harbor Freight’s recent growth–it was one of the reasons we named it to our Top 10 Brands to watch list this year–and the chain now operates almost 1,500 locations across the U.S. Below, using Placer’s new Map Studio feature to plot Harbor Freight and Ace Hardware locations nationwide. We see a heavy concentration of stores in the Eastern U.S. for both chains.
We’ve also presented a map from Placer’s Migration Report below showing population percentage growth from January 2020 to January 2024 at the market level. Green dots represent markers that have seen permanent population growth, while red represents markets that have seen population declines.
Examining the two maps together sheds some light on the success of Harbor Freight and Ace Hardware–they have a high degree of overlap with some of the highest growth markets in the U.S. We’ve covered the migration of consumers to these markets in the past, including markets have populations smaller than 500,000 people and often under 200,000 individuals. Here, having a smaller format box is an advantage for chains like Harbor Freight and Ace Hardware. Home Depot and Lowe’s both average more than 100,000 square feet per store, which can be difficult to justify in a smaller population market. However, the average Harbor Freight store is 15,000-16,500 square feet and the average Ace Hardware is 10,000 square feet (although ranging between 3,000 and 30,000 square feet). This has allowed both chains to tap smaller markets where much of the population (and household income) has transferred to.
Not surprising, we’ve seen a flood of announcements about retail chains planning to adopt smaller store formats over the past few months. We’ve previously discussed examples across a number of retail categories, including home furnishing (Arhaus and Ethan Allen) and department stores (Bloomie’s), but there has been a notable uptick in announcements from retailers unveiling smaller format stores, including Best Buy, Macy’s, and Whole Foods. Lowe’s has recognized this trend, announcing plans to more aggressively open stores in rural markets.
At a time when it’s more expensive for retailers to operate physical stores due to higher interest rates, higher rent costs (especially among A malls properties), minimum wage increases and labor scarcity, retailers are looking for any way they can to maximize the returns on their store properties, including retail media networks, store-in-store partnerships, and co-branded stores. However, in addition to generating more revenue from ancillary services like advertising or store-in-store partnerships, it’s clear that utilizing a smaller box to address population migration trends has become an increasingly attractive option

Introduction
2024 has been another challenging year for retailers. Still-high prices and an uncertain economic climate led many shoppers to trade down and cut back on unnecessary indulgences. Value took center stage, as cautious consumers sought to stretch their dollars as far as possible.
But price wasn’t the only factor driving consumer behavior in 2024. This past year saw the rise of a variety of retail and dining trends, some seemingly at odds with one another. Shoppers curbed discretionary spending, but made room in their budgets for “essential non-essentials” like gym memberships and other wellness offerings. Consumers placed a high premium on speed and convenience, while at the same time demonstrating a willingness to go out of their way for quality or value finds. And even amidst concern about the economy, shoppers were ready to pony up for specialty items, legacy brands, and fun experiences – as long as they didn’t break the bank.
How did these currents – likely to continue shaping the retail landscape into 2025 – impact leading brands and categories? We dove into the data to find out.
Conventional Value Reaching Its Ceiling
Bifurcation has emerged as a foundational principle in retail over the past few years: Consumers are increasingly gravitating toward either luxury or value offerings and away from the ‘middle.’ Add extended economic uncertainty along with rapid expansions and product diversification from top value-oriented retailers, and you have an explosion of visits in the value lane.
But we are seeing a ceiling to that growth – especially in the discount & dollar store space. Throughout 2023 and the first part of 2024, visits to discount & dollar stores increased steadily. But no category can sustain uninterrupted visit growth forever. Since April 2024, year–over-year (YoY) foot traffic to the segment has begun to slow, with September 2024 showing just a modest 0.8% YoY visit increase.
Discount & dollar stores, which attract lower-income shoppers compared to both grocery stores and superstores, have also begun lagging behind these segments in visit-per-location growth. In Q3, the average number of visits to each discount and dollar store location remained essentially flat compared to 2023 (+0.2%), while visits per location to superstores and grocery stores grew by 2.8% and 1.0%, respectively. As 2024 draws to a close, it is the latter segments, which appeal to shoppers with incomes closer to the nationwide median of $76.1K, which are seeing better YoY performance.
The deceleration doesn’t mean that discount retailers are facing existential risk – discount & dollar stores are still extremely strong and well-positioned with focused offerings that resonate with consumers. The visitation data does suggest, however, that future growth may need to focus on initiatives other large-scale fleet expansions. Some of these efforts will involve moving upmarket (see pOpShelf), some will focus on fleet optimization, and others may include new offerings and channels.
Return of the middle anyone?
Innovative and Disruptive Value Shake Up Retail and Dining
Still, in an environment where consumers have been facing the compounded effects of rising prices, value remains paramount for many shoppers. And brands that have found ways to let customers have their cake and eat it too – enjoy specialty offerings and elevated experiences without breaking the bank – have emerged as major visit winners this year.
Trader Joe’s Drives Visits With Private Label Innovation
Trader Joe’s, in particular, has stood out as one of the leading retail brands for innovative value in 2024, a trend that is expected to continue into 2025.
Trader Joe’s dedicated fan base is positively addicted to the chain’s broad range of high-quality specialty items. But by maintaining a much higher private label mix than most grocers – approximately 80%, compared to an industry average of 25% to 30% – the retailer is also able to keep its pricing competitive. Trader Joe’s cultivates consumer excitement by constantly innovating its product line – there are even websites dedicated to showcasing the chain’s new offerings each season. In turn, Trader Joe’s enjoys much higher visits per square foot than the rest of the grocery category: Over the past twelve months, Trader Joe’s drew a median 56 visits per square foot – compared to 23 for H-E-B, the second-strongest performer.
Chili’s Beats QSR at its Own Game
Casual dining chain Chili’s has also been a standout on the disruptive value front this past year – offering consumers a full-service dining experience at a quick-service price point.
Chili’s launched its Big Smasher Burger on April 29th, 2024, adding the item to its popular ‘3 for Me’ offering, which includes an appetizer, entrée, and drink for just $10.99 – lower than than the average ticket at many quick-service restaurant chains. The innovative promotion, which has been further expanded since, continues to drive impressive visitation trends. With food-away-from-home inflation continuing to decelerate, this strategy of offering deep discounts is likely to continue to be a key story in 2025.
The Convenience Myth
Convenience is king, right?
Well, probably not. If convenience truly were king, visitors would orient themselves to making fewer, longer visits to retailers – to minimize the inconvenience of frequent grocery trips and spend less time on the road. But analyzing the data suggests that, while consumers may want to save time, it is not always their chief concern.
Looking at the superstore and grocery segments (among others) reveals that the proportion of visitors spending under 30 minutes at the grocery store is actually increasing – from 73.3% in Q3 2019 to 76.6% in Q3 2024. This indicates that shoppers are increasingly willing to make shorter trips to the store to pick up just a few items.
At the same time, more consumers than ever are willing to travel farther to visit specialty grocery chains in the search of specific products that make the visit worthwhile.
Cross visitation between chains is also increasing – suggesting that shoppers are willing to make multiple trips to find the products they want – at the right price point. Between Q3 2023 and Q3 2024, the share of traditional grocery store visitors who also visited a Costco at least three times during the quarter grew across chains.
Does this mean convenience doesn’t matter? Of course not. Does it indicate that value, quality and a love of specific products are becoming just as, if not more, important to shoppers? Yes.
The implications here are very significant. If consumers are willing to go out of their way for the right products at the right price points – even at the expense of convenience – then the retailers able to leverage these ‘visit drivers’ will be best positioned to grow their reach considerably. The willingness of consumers to forego convenience considerations when the incentives are right also reinforces the ever-growing importance of the in-store experience.
So while convenience may still be within the royal family, the role of king is up for grabs.
Serving Diners Quicker With Automatization
Chipotle Draws Crowds With Autocado
Convenience may not be everything, but the drive for quicker service has emerged as more important than ever in the restaurant space. Diners want their fast food… well, as fast as possible. And to meet this demand, quick-service restaurants (QSRs) and fast-casual chains have been integrating more technology into their operations. Chipotle has been a leader in this regard, unveiling the “Autocado” robot at a Huntington Beach, California location last month. The robot can peel, pit, and chop avocados in record time, a major benefit for the Tex-Mex chain.
And the Autocado seems to be paying off. The Huntington Beach location drew 10.0% more visits compared to the average Chipotle location in the Los Angeles-Long Beach-Anaheim metro area in Q3 2024. Visitors are visiting more frequently and getting their food more quickly – 43.9% of visits at this location lasted 10 minutes or less, compared to 37.5% at other stores in the CBSA.
Are diners flocking to this Chipotle location to watch the future of avocado chopping in action, or are they enticed by shorter wait times? Time will tell. But with workers able to focus on other aspects of food preparation and customer service, the innovation appears to be resonating with diners.
McDonald’s Leans into Automation in Texas
McDonald’s, too, has leaned into new technologies to streamline its service. The chain debuted its first (almost) fully automated, takeaway-only restaurant in White Settlement, TX in 2022 – where orders are placed at kiosks or on app, and then delivered to customers by robots. (The food is still prepared by humans.) Unsurprisingly, the restaurant drives faster visits than other local McDonald’s locations – in Q3 2023, 79.7% of visits to the chain lasted less than 10 minutes, compared to 68.5% for other McDonald’s in the Dallas-Fort Worth-Arlington, TX CBSA. But crucially, the automated location is also busier than other area McDonald’s, garnering 16.8% more visits in Q3 than the chain’s CBSA-wide average. And the location draws a higher share of late-night visits than other area McDonald’s – customers on the hunt for a late-night snack might be drawn to a restaurant that offers quick, interaction-free service.
Evolving Retail Formats - Finding the Right Fit
Changing store formats is another key trend shaping retail in 2024. Whether by reducing box sizes to cut costs, make stores more accessible, or serve smaller growth markets – or by going big with one-stop shops, retailers are reimagining store design. And the moves are resonating with consumers, driving visits while at the same improving efficiency.
Macy’s Draws Local Weekday Visitors With Small-Format Stores
Macy’s, Inc. is one retailer that is leading the small-format charge this year. In February 2024, Macy’s announced its “Bold New Chapter” – a turnaround plan including the downsizing of its traditional eponymous department store fleet and a pivot towards smaller-format Macy’s locations. Macy’s has also continued to expand its highly-curated, small-format Bloomie’s concept, which features a mix of established and trendy pop-up brands tailored to local preferences.
And the data shows that this shift towards small format may be helping Macy’s drive visits with more accessible and targeted offerings that consumers can enjoy as they go about their daily routines: In Q3 2024, Macy’s small-format stores drew a higher share of weekday visitors and of local customers (i.e. those coming from less than seven miles away) than Macy’s traditional stores.
Harbor Freight Tools and Ace Hardware Serve Smaller Growth Markets With Less Square Footage
Small-format stores are also making inroads in the home improvement category. The past few years have seen consumers across the U.S. migrating to smaller suburban and rural markets – and retailers like Harbor Freight Tools and Ace Hardware are harnessing their small-format advantage to accommodate these customers while keeping costs low.
Harbor Freight tools and Ace Hardware’s trade areas have a high degree of overlap with some of the highest growth markets in the U.S., many of which have populations under 200K. And while it can be difficult to justify opening a Home Depot or Lowe’s in these hubs – both chains average more than 100,000 square feet per store – Harbor Freight Tools and Ace Hardware’s smaller boxes, generally under 20,000 square feet, are a perfect fit.
This has allowed both chains to tap into the smaller markets which are attracting growing shares of the population. And so while Home Depot and Lowe’s have seen moderate visits declines on a YoY basis, Harbor Freight and Ace Hardware have seen consistent YoY visit boosts since Q1 2024 – outperforming the wider category since early 2023.
Hy-Vee Bucks the Trend by Going Big
Are smaller stores a better bet across the board? At the end of the day, the success of smaller-format stores depends largely on the category. For retail segments that have seen visit trends slow since the pandemic – home furnishings and consumer electronics, for example – smaller-format stores offer brands a more economical way to serve their customers. Retailers have also used smaller-format stores to better curate their merchandise assortments for their most loyal customers, helping to drive improved visit frequency.
That said, a handful of retailers, such as Hy-Vee, have recently bucked the trend of smaller-format stores. These large-format stores are often designed as destination locations – Hy-Vee’s larger-format locations usually offer a full suite of amenities beyond groceries, such as a food hall, eyewear kiosk, beauty department, and candy shop. Rather than focusing on smaller markets, these stores aim to attract visitors from surrounding areas.
Visit data for Hy-Vee’s large-format store in Gretna, Nebraska indicates that this location sees a higher percentage of weekend visits than other area locations – 37.7% compared to 33.1% for the chain’s Omaha CBSA average – as well as more visits lasting over 30 minutes (32.9% compared to 21.9% for the metro area as a whole). For these shoppers, large-format, one-stop shops offer a convenient – and perhaps more exciting – alternative to traditionally sized grocery stores. The success of the large-format stores is another sign that though convenience isn’t everything in 2024, it certainly resonates – especially when paired with added-value offerings.
A Resurgence of Legacy Brands
Many retail brands have entrenched themselves in American culture and become an extension of consumers' identities. And while some of these previously ubiquitous brands have disappeared over the years as the retail industry evolved, others have transformed to keep pace with changing consumer needs – and some have even come back from the brink of extinction. And the quest for value notwithstanding, 2024 has also seen the resurgence of many of these (decidedly non-off-price) legacy brands.
In apparel specifically, Gap and Abercrombie & Fitch – two brands that dominated the cultural zeitgeist of the 1990s and early 2000s before seeing their popularity decline somewhat in the late aughts and 2010s – may be staging a comeback. Bed Bath & Beyond, a leader in the home goods category, is also making a play at returning to physical retail through partnerships.
Anthropologie, another legacy player in women’s fashion and home goods, is also on the rise. Anthropologie’s distinctive aesthetic resonates deeply with consumers – especially women millennials aged 30 to 45. And by capturing the hearts of its customers, the retailer stands as a beacon for retailers that can hedge against promotional activity and still drive foot traffic growth.
And visits to the chain have been rising steadily. In Q4 2023, the chain experienced a bigger holiday season foot traffic spike than pre-pandemic, drawing more overall visits than in Q4 2019. And in Q3 2024, visits were higher than in Q3 2023.
Meeting the Evolving Needs of Millennials
And speaking of the 35 to 40 set – the generation that all retailers are courting? Millennials. Does that sound familiar? Yes, because this is the same generational cohort that retailers tried to target a decade ago. As millennials have aged into the family-formation stage of life, their retail needs have evolved, and the industry is now primed to meet them.
Sam’s Club Draws Value-Conscious Singles and Starters
From the revival of nostalgic brands like the Limited Too launch at Kohl’s to warehouse clubs expanding memberships to younger consumers as they move to suburban and rural communities, there are myriad examples of retailers reaching out to this cohort. And Sam’s Club offers a prime example of this trend.
Over the past few years, millennials and Gen-Zers have emerged as major drivers of membership growth at Sam’s Club, drawn to the retailer’s value offerings and digital upgrades – like the club’s Scan & Go technology. Over the same period, Sam’s Club has grown the share of “Singles and Starters” households in its captured market from 6% above the national benchmark in Q3 2019 to 15% in Q3 2024. And with plans to involve customers in co-creating products for its private-label brand, Sam’s Club may continue to grow its market share among this value-conscious – but also discerning and optimistic – demographic.
Taco Bell Brings in Crowds With Value Nostalgia Menu
Millennials are also now old enough to wax nostalgic about their youth – and brands are paying attention. This summer, Taco Bell leaned into nostalgia with a promotion bringing back iconic menu items from the 60s, 70s, 80s, and 90s – all priced under $3. The promotion, which soft-launched at three Southern California locations in August, was so successful that the company is now offering the specials nationwide. The three locations that trialed the “Decades Menu” saw significant boosts in visits during the promotional period compared to their daily averages for August. And people came from far and wide to sample the offerings – with a higher proportion of visitors traveling over seven miles to reach the stores while the items were available.
What Lies Ahead?
Hot on the heels of a tumultuous 2023, 2024’s retail environment has certainly kept retailers on their toes. While embracing innovative value has helped some chains thrive, other previously ascendant value segments, including discount & dollar stores, may have reached their growth ceilings. Consumers clearly care about convenience – but are willing to make multiple grocery stops to find what they need. At the same time, legacy brands are plotting their comeback, while others are harnessing the power of nostalgia to drive millennials – and other consumers – through their doors.

