


.svg)






Navigating a More Selective Consumer
We recently attended the 2026 National Restaurant Association Show in Chicago, and the mood on the floor reflected an industry navigating a more complicated demand environment than it faced a year ago. With gas and grocery prices ticking higher over the past few months, consumers are once again tightening their belts and scrutinizing every dining decision, leaving operators to fight harder for share of stomach against a wider range of food retailers. Yet despite the headwinds, the show also surfaced plenty of bright spots: some chains are still driving traffic gains through new products, sharper value messaging, and operational improvements – from menu innovation to loyalty and tech-enabled efficiency – that are resonating with cautious diners. The takeaways below unpack where the pressure is greatest, who's breaking through anyway, and what it all signals for the back half of 2026.
Economic Headwinds Are Driving Diverging Restaurant Performance
Placer’s visitation trends reinforce this uncertain consumer environment. Below, we show weekly year-over-year visit trends for the QSR, fast casual, casual dining, and fine dining categories. After a strong start to February – partly the result of lapping the macroeconomic uncertainty a year ago amid the initial tariff announcements – visitation trends for the QSR, fast casual, and casual dining segments have generally fallen year-over-year (YoY) the past few months. Meanwhile, visits to fine dining restaurants have generally increased YoY, with affluent consumers feeling more confident about the macroeconomic environment given recent stock market highs.
Q1's Standout Restaurant Performers
Even as caution returned to the consumer, several chains showcased at and around the show stood out as clear traffic winners through Q1. In fast casual, CAVA continued to look like the category's runaway story, posting 9.7% same-restaurant sales growth driven by a striking 6.8% jump in guest traffic – outpacing peers including Chipotle, which has been working through a "Recipe for Growth" turnaround after stretches of negative comps.
In the burger and Mexican QSR space, Burger King delivered a 5.8% U.S. comp gain in Q1 – its biggest lift in years – fueled by family-friendly SpongeBob and Mandalorian tie-ins, while Taco Bell once again served as Yum! Brands' growth engine, leveraging sharp value pricing, steady menu innovation, and a deep digital loyalty program to broaden its appeal across income cohorts.
Regional Favorites and Coffee Challengers Gain Ground
Coffee was also a frequent topic of conversation at the 2026 NRA Show. Dutch Bros has now strung together five-plus quarters of traffic-led same-store sales gains and is rolling out hot breakfast nationwide. Meanwhile, 7 Brew has emerged as the segment's hottest growth story – posting eye-popping traffic gains and on pace to add more than 400 units in 2026 alone – even as Starbucks continues to navigate a turnaround under CEO Brian Niccol.
Regional QSR burger favorites are pressing their advantage as well. In-N-Out is pushing into Tennessee, Washington, and other new markets, Whataburger continues to extend its footprint outside the Southeast, and Culver's is rolling out a series of menu, technology, and experience updates aimed at sustaining the cult-like loyalty that has long set these regional players apart. In fact, Culver’s might be the story of the QSR category right now, posting same-store visits that ranked among the upper echelon of QSR chains during the first quarter.
Growing Competition for Share of Stomach
One of the most persistent themes at this year's show was that restaurants are no longer just competing with each other for share of stomach. Grocery stores, convenience chains, and warehouse clubs are rapidly upgrading their prepared food offerings, and in many cases capturing everyday meal occasions that restaurants once owned.
Grocery retailers are expanding prepared foods and meals-on-the-go and positioning them as a more affordable alternative to both home cooking and a drive-thru run, while c-stores like 7-Eleven, QuikTrip, and Wawa have invested heavily in made-to-order menus, full kitchens, and even branded QSR partnerships that increasingly rival traditional fast food. Warehouse clubs are pushing in the same direction – Sam's Club, for example, is rolling out fresh, ready-to-serve meals – leaving restaurant operators to defend their turf against a much broader, and noticeably hungrier, retail food ecosystem. YoY visit trends for the QSR category have underperformed other food-at-home categories like grocery stores and superstores over the past twelve months, underscoring this meaningful channel shift.
An Industry at an Inflection Point
Taken together, the 2026 show painted a picture of an industry at an inflection point. The tailwinds of pent-up post-pandemic demand have given way to a more discerning consumer, a wider competitive set, and thinner margins for error. The chains that are winning share are doing so with a clear playbook: relevant menu innovation, disciplined value, sticky loyalty, and operational investments that make the experience faster and easier.
As we head into the back half of 2026, the gap between the operators executing on those fundamentals and those still searching for an answer is likely to widen further. The pressure on the industry is real, but so is the opportunity – and the brands willing to keep adapting to where the consumer is actually headed should remain well-positioned to come out ahead.
For more data-driven insights, visit placer.ai/anchor
Placer.ai leverages a panel of tens of millions of devices and utilizes machine learning to make estimations for visits to locations across the US. The data is trusted by thousands of industry leaders who leverage Placer.ai for insights into foot traffic, demographic breakdowns, retail sale predictions, migration trends, site selection, and more.
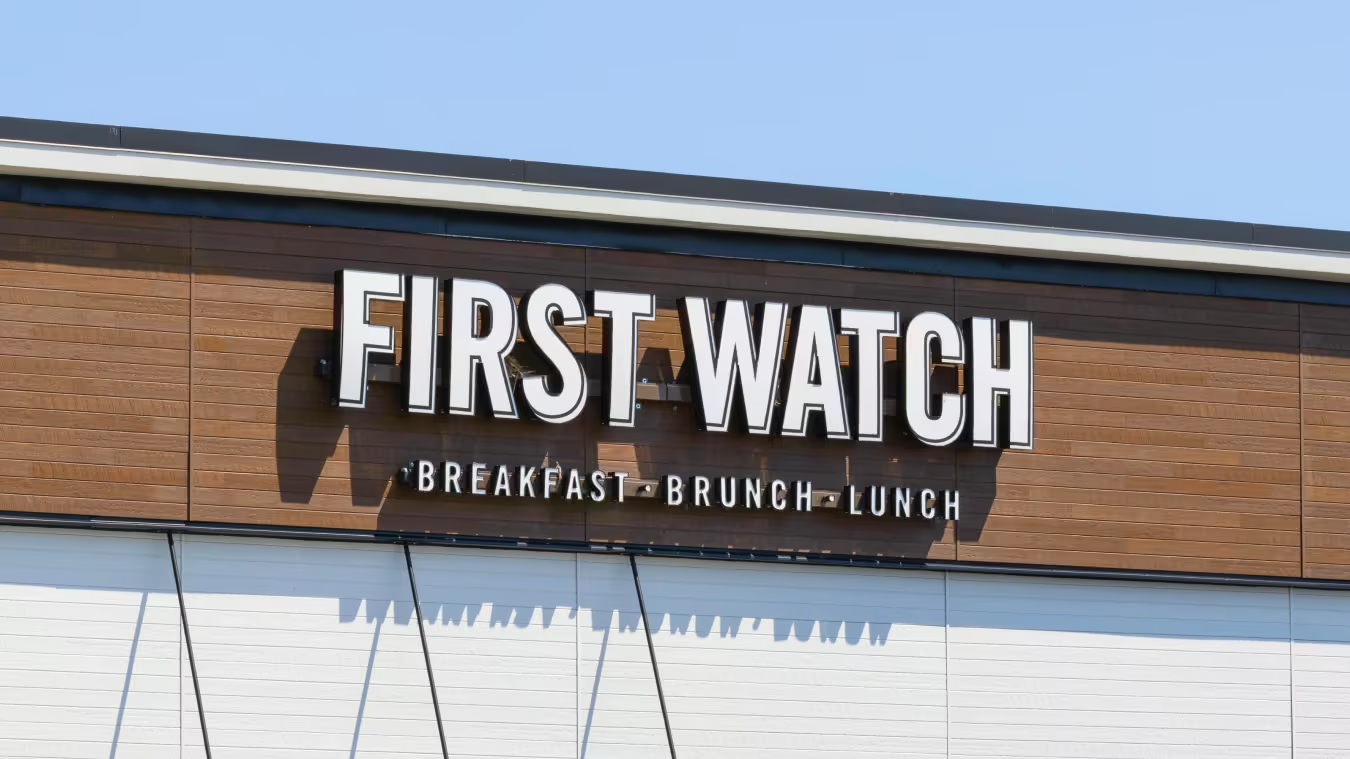
The U.S. restaurant industry navigated a challenging first quarter in 2026, marked by macroeconomic headwinds, unfavorable weather, and cautious consumer spending. Yet, within the breakfast-first sector, a clear narrative is emerging: The era of the traditional legacy diner is fading, making way for premium, experience-driven concepts. And at the forefront of this shift is First Watch. Armed with a differentiated culinary menu, rapid but disciplined expansion, and a highly resilient consumer base, the brand is not only defying broader casual dining trends but is fundamentally rewriting the playbook for daytime dining.
The Breakfast Divide: How Premium Concepts Are Outpacing Legacy Diners
Over the past few years, the breakfast-first restaurant category has bifurcated into two distinct camps: premium and experience-driven concepts capturing visit share, and legacy diner-style chains, many of which are struggling to keep up. While Q1 2026 proved to be a tighter traffic environment overall amid macroeconomic uncertainty and unfavorable weather conditions across the U.S., several experience-focused brands and resilient fan-favorites continued growing their footprints – and their audiences.
First Watch led the pack in overall visit growth as it continued expanding its store count, while average visits per location held steady – demonstrating its ability to scale without diluting demand at existing locations – while Snooze saw a 1.1% increase in visits per location.
Conversely, the steepest laggards in the segment were legacy diner chains IHOP, Denny’s, and Huddle House, all of which saw overall visits decline as they continued rightsizing their footprints, with visits per location also modestly down. These brands are increasingly tracking closer to casual dining peers like Applebee’s and Outback Steakhouse, which have faced significant headwinds in recent months.
Still, among legacy diners, Waffle House stood out as a clear outperformer in Q1 2026, likely due in part to its status as a regional institution across much of the South. And the chain’s operational resilience may have also played a role: While Winter Storm Fern pushed the so-called “Waffle House Index” into the red across much of the region in late January, the brand’s unique disaster-readiness appears to have enabled some locations to reopen quickly or avoid closure entirely.
Ultimately, despite a challenging macroeconomic environment, brands that leverage a differentiated culinary menu, high-touch customer service, or fierce brand loyalty are successfully navigating the highly fragmented daypart much better than their traditional diner counterparts.
Sustained Momentum: The Power of First Watch’s Unit Growth and Model Portability
While several premium concepts have successfully carved out a lucrative niche in breakfast-first dining, First Watch has redefined the category. By blending the elevated, chef-driven culinary experience of a localized brunch spot with the operational efficiency of a national powerhouse, First Watch has created a model that sees success across multiple regions of the U.S. This unique positioning provides the brand with a massive structural advantage, fueling a physical growth trajectory that far outpaces its competitors.
Importantly, visitation data also reinforces that First Watch’s restaurant classes from 2024 and 2025 have consistently kept pace with the maturity curve of recent openings. An analysis of visit-per-location trends for First Watch locations opened in 2024 and 2025 versus the chain’s nationwide fleet reveals that the class of 2024 outpaced nationwide trends, while the 2025 cohort – even when factoring in the high volume of openings that took place in Q3 2025 – has also kept pace. These are incredibly positive indicators for a brand rapidly scaling its national footprint.
First Watch has set a long-term goal of reaching more than 2,200 restaurants across the United States – an ambitious target that would more than triple its current size. Reaching this milestone is achievable, but it will require the brand to meaningfully deepen its penetration in large coastal and Sun Belt metros, where it remains under-penetrated relative to its proven suburban strongholds. Placer.ai foot traffic data across more than 100 Core Based Statistical Areas (CBSAs) reveals that First Watch's unit economics are remarkably consistent, confirming the model works across multiple geographies. While newer markets like New York, Chicago, Boston, and Las Vegas currently generate lower visits per capita than the chain's core Sun Belt and Midwest suburban markets, there are significant opportunities for expansion. First Watch's breakfast-first model, strong unit-level economics, and growing brand recognition give it a credible platform to aggressively capture market share in these new territories.
Looking Ahead: Redefining Leadership in Daytime Dining
Despite slowing early-spring trends, First Watch remains well-positioned to hit its 2026 same-store sales growth target of 1% to 3%. This confidence is rooted in a few key factors. First, the brand benefits from a resilient core consumer who is materially less sensitive to macroeconomic pressures than the traditional diner customer, providing a much higher floor for baseline traffic. Second, First Watch leverages reliable pricing power, as its premium positioning and highly anticipated seasonal menu rotations consistently drive check growth. Finally, the company's commitment to operational excellence through its company-owned model ensures that execution remains strong and the guest experience is uncompromised, even during slower traffic periods. By driving outsized performance from its newest units and maintaining a highly loyal customer base, the brand is not merely surviving the breakfast category's headwinds; it is actively redefining what leadership in daytime dining looks like.
For more data-driven dining insights, follow Placer.ai/anchor.
Placer.ai leverages a panel of tens of millions of devices and utilizes machine learning to make estimations for visits to locations across the US. The data is trusted by thousands of industry leaders who leverage Placer.ai for insights into foot traffic, demographic breakdowns, retail sale predictions, migration trends, site selection, and more.

CAVA Building Momentum in the Premium Fast-Casual Space
The fast-casual sector has long been defined by its sweet spot within the restaurant industry, combining the convenience of fast food and the quality of casual dining. For years, CAVA and sweetgreen have stood as the standard-bearers of the health-forward movement, expanding their store footprint while building fiercely loyal followings among affluent consumers. However, Q1 2026 foot traffic data suggests that these two brands are now on diverging trajectories. While overall visits to both chains grew – thanks in part to ongoing expansions – CAVA saw its average visits per venue grow as well, while sweetgreen's per-location traffic remained flat YoY.
Same-Store Visit Trends Diverge
The contrast between same-store visit trends is even more striking. Over the past six months, same-store visits to CAVA have been uniformly positive – and 2026 traffic was particularly strong. Meanwhile, sweetgreen has seen consistently negative same-store visit declines, with March 2026 same-store visits down 7.6% compared to CAVA's 6.8% increase. This represents a meaningful spread between two brands competing for the same premium consumer.
CAVA’s Menu Strategy Expands Appeal and Strengthens Value Perception
This divergence is the result of structural differences in menu mix and value perception. Over the past six months, CAVA has rolled out strategic menu enhancements designed to reengage with middle-income consumers who may have turned away from fast-casual options in recent months and elevate its overall value perception.
Leaning heavily into its warm, protein-forward architecture, the brand has introduced additions like premium glazed salmon as a protein option alongside new variations of its highly successful spicy chicken and steak offering. Alongside these protein upgrades, CAVA has refreshed its seasonal roasted vegetable lineups and also introduced smaller items like harissa pita chips, sides, and dips. This ensures that the menu remains dynamic enough to drive incremental visits and avoid customer fatigue while maintaining the highly customizable, assembly-line efficiency that protects its strong unit economics. The diversity of CAVA’s menu – both in terms of innovation and pricing – have helped to drive down the chain’s captured trade area median household income the past four quarters, according to data from STI: Popstats combined with Placer data.
Sweetgreen Expands into New Formats to Strengthen Value Perception
To close this widening gap, Sweetgreen has also planned several menu changes in 2026 focused on operational simplicity, value perception, and a major new category expansion. The brand kicked off the year by highlighting its health-forward roots through a limited-time menu collaboration with Dr. Mark Hyman that utilized existing ingredients, followed by the launch of the seasonal Winter Harvest Bowl and the highly requested return of shredded cheese to the core menu. However, the most significant news is Sweetgreen's planned mid-2026 rollout of wraps.
Currently undergoing rigorous stage-gate testing in Los Angeles, the Midwest, and Manhattan, the wrap platform – featuring accessible price points starting at $10.95 and capping below $15 for in-store pickup – is designed to aggressively target consumer value sensitivity. Management noted that wraps are intended to build upon their 2025 efforts (which included increased protein portions and $12 Daily Greens) to prove to budget-conscious, quality-driven diners that Sweetgreen can deliver a compelling, high-value meal without compromising its premium brand identity.
An Inflection Point in the Premium Fast-Casual Landscape
Ultimately, the Q1 2026 data serves as a critical inflection point. CAVA is actively gaining share in a contracting category by mastering geographic diversification, daypart breadth, and perceived value. Sweetgreen has the brand identity, the affluent customer base, and the regional runway to recover, but the strategic decisions made over the next 12 to 18 months will dictate whether this current slump is a temporary setback or a permanent competitive reality.
For more data-driven dining insight, visit placer.ai/anchor
Placer.ai leverages a panel of tens of millions of devices and utilizes machine learning to make estimations for visits to locations across the US. The data is trusted by thousands of industry leaders who leverage Placer.ai for insights into foot traffic, demographic breakdowns, retail sale predictions, migration trends, site selection, and more.

Calendar Shift Contributed to Flat Retail Foot Traffic
Traffic to brick and mortar retail chains remained essentially flat in March 2026 following a period of steady year-over-year (YoY) gains – although calendar shifts may account for some of the apparent slowdown.
Saturday is typically the busiest day for in-store shopping, and March 2026 had one fewer Saturday than March 2025, which likely weighed on overall foot traffic, as average daily visits on each weekday in March 2026 were all higher than the monthly average. At the same time, the increase in average visits per weekday on most days was smaller than the YoY monthly growth in January and February – suggesting that consumer caution may have also played a role in the March traffic trends. April data should bring more clarity as to how much of the slowdown was driven by a calendar shift versus emerging consumer caution.
Earlier Easter May Have Boosted March E-Commerce Visits
Meanwhile, traffic to e-commerce distribution centers skyrocketed in March – with visits rising 16.2% compared to March 2025 – perhaps helped by a different calendar shift. The shift in Easter – from April 20 in 2025 to April 5 in 2026 – likely pulled some holiday shopping into late March, boosting activity.
Manufacturing Activity Holds Steady Despite Labor Contraction
On the manufacturing side, foot traffic to plants remained relatively flat in March 2026, rising just 0.7% YoY nationwide.
The March ISM Manufacturing PMI showed growth in new orders and production compared to February, while employment declined – pulling foot traffic trends in opposite directions. The muted visit growth suggests facilities are maintaining operational intensity even as headcounts shrink, pointing to manufacturing activity becoming less labor-dependent, with output continuing to drive facility usage despite subdued hiring.
Looking Ahead
March’s data suggests that underlying consumer and industrial activity remains resilient, with calendar dynamics distorting headline trends rather than signaling a true slowdown. Looking ahead, as calendar effects normalize, retail and logistics activity may better reflect this underlying strength, while manufacturing continues its shift toward higher output with leaner workforces.
For more data-driven consumer insights, visit placer.ai/anchor.
Placer.ai leverages a panel of tens of millions of devices and utilizes machine learning to make estimations for visits to locations across the US. The data is trusted by thousands of industry leaders who leverage Placer.ai for insights into foot traffic, demographic breakdowns, retail sale predictions, migration trends, site selection, and more.
While artificial intelligence was the undeniable protagonist of Shoptalk Spring 2026, the discussions illuminated a landscape far more nuanced than simple automation. Retailers are currently navigating a perfect storm of behavioral shifts, ranging from the physiological impact of GLP-1 medications to the cultural resurgence of the mall driven by Gen Alpha. In response, the industry is moving away from rigid demand planning toward a model defined by extreme operational agility, where the lines between digital agents and physical storefronts are increasingly blurred – an evolution reflected in the four key takeaways from this year’s event.
1. The Rise of Agentic Commerce
The most significant evolution in the digital space is the transition from traditional e-commerce to Agentic Commerce, or "A-Commerce" (hat tip Shoptalk’s Joe Laszlo). As AI agents begin to autonomously manage discovery, price comparison, and purchasing for consumers, the retail industry must pivot to serve these non-human decision-makers. This shift has the potential to disrupt the long-standing trend of retail concentration. By lowering the cost of customer acquisition and brand formation, AI is effectively leveling the playing field, allowing niche brands to challenge established giants and potentially reversing a decade of market consolidation.
2. Shifting Consumer Archetypes
Consumer behavior is currently evolving faster than at any point in recent history. The widespread adoption of GLP-1 medications has created a "lifestyle domino effect" that stretches far beyond the pharmacy. Data shows these medications are not only shifting primary grocery destinations but are also triggering a chain reaction in discretionary spending. A significant weight loss often prompts a total wardrobe refresh, which in turn leads to increased spending on housewares as consumers feel a renewed desire to host social gatherings and showcase their updated personal aesthetic.
Simultaneously, Gen Alpha is coming of age and bringing a surprising nostalgia for the physical "mall hangout" culture. Brands are responding by leaning heavily into "recommerce" and resale markets to build long-term community engagement. In this environment, lifetime value is no longer just about the initial transaction but about fostering a continuous cycle of brand interaction through niche marketplaces and circular economies.
3. The Technological Rebirth of the Store
The physical store is not dying; it is being re-engineered to function like a high-end service environment. The industry is moving toward a "hotel check-in" model where computer vision and loyalty integrations allow retailers to identify customers the moment they cross the threshold. This level of tracking is part of a new value exchange: consumers grant access to their data in return for hyper-personalized in-store media and a frictionless shopping experience. This evolution notably aims to eliminate "security friction," such as locked display cabinets, by replacing them with seamless, background-monitoring technologies.
4. From Planning to Sensing: The New Supply Chain
Behind these front-end changes lies a total re-engineering of the supply chain. The traditional discipline of demand planning, which relies on historical data, is being replaced by "demand sensing." This model uses real-time AI to create highly reactive inventory flows that can pivot instantly based on current market signals. Furthermore, the economics of fulfillment have reached a tipping point; micro-fulfillment centers are now financially viable at a threshold of just 500 orders per day. This democratization of automation allows a broader range of retailers to offer localized, rapid delivery that was once the exclusive domain of the industry's largest players.
Rewriting the Retail Playbook for 2026
The retail playbook is being aggressively rewritten in 2026 as the industry moves past the era of mere experimentation and into one of total operational integration. The convergence of autonomous "A-Commerce" agents, the physiological lifestyle shifts triggered by GLP-1 medications, and the unexpected cultural resurgence of the physical mall among Gen Alpha has rendered legacy forecasting models obsolete. Success in this new landscape now depends on a retailer’s ability to bridge the gap between high-tech digital convenience and hyper-personalized, frictionless physical experiences. Ultimately, the winners of this cycle will be those who replace static planning with real-time demand sensing, ensuring they remain as agile as the rapidly evolving consumers they serve.
Placer.ai leverages a panel of tens of millions of devices and utilizes machine learning to make estimations for visits to locations across the US. The data is trusted by thousands of industry leaders who leverage Placer.ai for insights into foot traffic, demographic breakdowns, retail sale predictions, migration trends, site selection, and more.

Self-Storage Defies a Cooling Housing Market
Over the past several months since our last self-storage update, the industry has remained surprisingly resilient even as its primary fuel source – housing turnover – dried up. With Public Storage's recent acquisition of National Storage Affiliates, we dove into the data to understand what's driving the category's ongoing growth.
Traffic to Self-Storage Facilities Continues to Grow
Coming out of the pandemic, demand for self-storage facilities surged due to increased migration trends and living space downsizing trends. According to Extra Space’s December 2025 Company Presentation, 12.6% of U.S. Households utilized self-storage facilities in 2023, up from below 10% before the pandemic. Our location intelligence reinforces this data, as monthly visitation trends to self-storage chains continued to grow in 2025, albeit at a slower pace than previous years (below).
Looking ahead to 2026, can this momentum continue? Home sales have improved modestly as interest rates inched downward, but the industry has had to pivot to generate growth the past few years. With that backdrop, we’ve identified four trends that will define the category in 2026.
1. Pricing
With fewer people moving, operators had to cut prices to attract new tenants, with "street rates" declining in recent years. According to [many operators], "street rates" for a 10x10 unit dropped 10%–15% year-over-year in 2025. To compensate, major REITs (like Public Storage and Extra Space) raised rates on current tenants. Because these tenants were also locked into their housing situations, they proved incredibly "sticky" – accepting the price hikes rather than going through the hassle of moving their goods. Our data also shows an increase in the share of frequent visitors (2+ times a month) to self-storage units, reinforcing the idea that storage has become a more embedded, utility-like part of their daily lives – and further reducing their likelihood to churn even as rents rise.
2. The "Remodel" Effect
If you can't move, you improve. As migration trends and housing turnover trends have slowed, there appears to be a shift in the rationale behind why customers were renting self-storage units. Instead of "moving storage," demand has shifted toward "lifestyle storage." As homeowners renovated to accommodate hybrid work setups or cleared out spare rooms for new family members, they needed temporary space. We see this with the percentage of remote workers visiting the largest self-storage chains, which has steadily increased the past several years. In turn, this helped put a floor under occupancy rates, which have stabilized in the low-90% range for REIT-managed storage properties and in the low-80% range across all operators.
3. Sunbelt Saturation vs. Institutional Opportunity
The self-storage industry is seeing regional divergence. Sunbelt markets (Phoenix, Tampa, Atlanta), which saw massive migration and development booms during the pandemic, faced a supply hangover in 2025. With too many new facilities opening just as migration slowed, these markets saw the steepest drops in pricing compared to high-barrier markets in the Northeast.
However, this “saturation" could offer opportunities within this category. Recently, CubeSmart and CBRE Investment Management announced a $250 million joint venture to acquire assets in these very high-growth markets. Their first acquisition? A property in Phoenix – the poster child for recent oversupply. This move signals a critical shift for 2026: while development is slowing, institutional capital is waking up. Major players are using this period of soft pricing to acquire high-quality assets in the Sunbelt, betting that the long-term population growth will eventually absorb the current supply glut.
4. The "Temperature-Controlled" Premium
While standard drive-up units remain the bread and butter of the consumer self-storage industry, 2025 saw a continued shift toward climate-controlled solutions as a key revenue driver. New development throughout 2025 and into 2026 has skewed heavily toward 100% climate-controlled facilities. As consumers store higher-value items – such as electronics, wine, and collectibles – rather than just "garage overflow," they have proven willing to pay a higher premium for strict humidity and temperature regulation.
Simultaneously, investors tracking the self-storage sector have historically looked to industrial cold storage (refrigerated warehousing for food and pharma) as a parallel play, given both asset classes benefit from similar "last-mile" logistics tailwinds. However, the 2026 outlook for the industrial side has shifted significantly.
While the rise of online grocery and pharmaceutical delivery initially made refrigerated warehousing a defensive darling, the sector is now digesting a massive pandemic-era development boom. The U.S. industrial cold storage market is currently facing a notable supply glut. As industry leader Americold recently highlighted, "[O]ver the last few years, it's in excess of 15% of incremental capacity that's been added mainly by a lot of new market entrants whose business model is to get a little bit of scale and then try to transact."
This creates a split narrative for 2026: while consumer climate-controlled self-storage continues to capture premium yields, the industrial cold storage sector is entering a period of recalibration, forcing operators to focus on absorbing excess capacity and improving efficiency rather than breaking ground on new builds. We see this in visitation trends to cold-storage leaders Americold and Lineage, where visits continue to trend downward versus 2022 as these chains see an increase in new competitors.
Looking Ahead to 2026
As we head deeper into 2026, the industry is watching for the "thaw." If interest rates moderate and housing turnover picks up, street rates could rally quickly. But until then, the name of the game is consolidation and efficiency. Expect more REITs to follow CubeSmart’s lead, partnering with institutional capital to scoop up modern, climate-controlled assets while smaller operators struggle to compete in a low-volume environment.
For more data-driven CRE insights, visit placer.ai/anchor.
1. Executive Summary
Five years ago, the neighborhood and lifestyle center playbook was built around apparel anchors, department stores, and soft goods. Today, that model is giving way to a service-first tenant mix centered on health and wellness, food and beverage, fitness, grocery, and off-price retail.
The shift reflects a lasting change in how consumers use physical retail space. The pandemic accelerated demand for health, wellness, and dining; e-commerce continued to erode traditional apparel traffic; and value-oriented and service-based concepts proved more resilient. The result is a new ecosystem in which different tenants take on the roles once filled by the traditional anchor.
Fitness, grocery, and coffee drive frequent visits. Dining extends dwell time and encourages cross-shopping. Wellness captures fast-growing demand that is largely insulated from e-commerce. And off-price retail continues to generate resilient discretionary traffic.
Six years of foot-traffic and tenant-mix data across neighborhood and lifestyle centers point to seven key takeaways for landlords and advisors repositioning their portfolios:
- Apparel has lost its traditional anchor role. Apparel visits fell nearly 25% between 2019 and 2025, while fitness, wellness, coffee, grocery, and off-price / value retail gained traffic.
- The next generation of anchors requires a new approach to tenant evaluation. Landlords should look beyond square footage and traditional anchor status and evaluate tenants based on metrics like visit frequency, traffic growth growth, e-commerce risk, and dwell time – with the strongest mixes combining categories that bring different strengths to the center.
- Neighborhood and lifestyle centers require different ecosystems. Neighborhood centers remain grocery-led and should layer in high-frequency and service-oriented uses. Lifestyle centers are increasingly dining- and experience-led and should optimize for dwell time and destination appeal.
- Fitness, wellness, and food & beverage have emerged as new primary anchors that strengthen centers in different ways. Fitness creates exceptionally frequent, long visits, while wellness brings fast-growing, e-commerce-resistant demand. Dining adds another dimension by extending dwell time and creating destination appeal, particularly at lifestyle centers.
- Off-price is the exception within apparel – and a meaningful opportunity. Ross, Burlington, and the TJX banners continue to grow traffic and store counts even as much of traditional apparel contracts.
- Local trade area considerations should shape the tenant mix. The category framework may hold across markets, but landlords should match specific concepts and banners to the income profile and customer base of the trade area.
2. What Drove the Shift: Three Accelerants
The transformation of the American retail center was driven by three compounding forces that permanently altered consumer behavior and retail economics.
The Pandemic Reset (2020–2021)
COVID-19 permanently altered consumer behavior. Fitness studios, med-spas, and the restaurants that survived captured demand as competitors closed and leaned into digital loyalty programs, while apparel chains lost customers to e-commerce.
The E-Commerce Reckoning (2021–2023)
Offline apparel sales slowed as consumers shifted to digital shopping for traditional fashion. Department stores ceded both sales and market share to off-price for more than a decade, and the pace accelerated after the pandemic. Crucially, many of the categories that held their ground share a common trait: They sell experiences and services that cannot be shipped to a doorstep.
The Wellness Economy Surge (2022–2026)
As the pandemic receded, health and wellness surged. The U.S. med-spa industry reached $17.5 billion by 2022, and was forecast to keep growing at roughly 10 percent a year through 2027. Wellness uses are also among the fastest-growing sources of retail leasing demand.
Strategic Takeaways
- Health, wellness, and food uses gained durable loyalty during the pandemic, while traditional apparel lost it to e-commerce.
- Off-price has been taking share from department stores for over a decade, and the pandemic only accelerated it.
3. The New Anchor Decision Framework
To meet this challenge, centers need to assemble tenant mixes in which different categories perform distinct but complementary roles. Rather than relying on a single dominant anchor, the strongest centers combine tenants that collectively drive frequency, dwell time, growth, and durable physical-world demand. Some generate frequent repeat visits; others contribute fast-growing, e-commerce-resistant demand or resilient discretionary retail traffic.
A. Visit Frequency
Visit frequency is one of the clearest measures of an anchor’s value to its neighbors. A tenant that brings the same customer back every week creates far more exposure for the rest of the center than one that generates occasional destination trips.
And the data reveals a clear hierarchy. Fitness leads by a wide margin, with the average gym visitor returning 4.2 times per month. Coffee follows at 2.5 visits per month and grocery at 2.4, reflecting the routine nature of those categories. Limited-service dining, at 1.9 visits per month, also functions as a meaningful frequency engine.
At the other end of the spectrum are apparel and full-service restaurants, at 1.2 monthly visits per visitor, and spa and wellness, at 1.1. These categories tend to be more purpose-driven than routine-driven.
B. Growth Trends and E-Commerce Risk
But low frequency is not disqualifying. Just as important are a category’s growth trajectory and the durability of its demand in an increasingly e-commerce-driven retail environment.
Spa and wellness chains, for example, rank last in visit frequency at 1.1 average visits per visitor per month. But the category leads all segments in post-pandemic visit growth, up 31.8% since 2019, with effectively no e-commerce exposure.
Off-price follows at 28.6% visit growth, followed by coffee (+26.7%) and fitness (+22.6%) – both of which pair strong growth with high visit frequency and limited digital risk.
C. Dwell Time
Dwell time adds a third dimension: how long customers remain on site. Longer visits, of course, do not automatically translate into cross-shopping, but they increase the opportunity for customers to interact with other tenants and amenities within a center.
Here too fitness stands out, with the largest share of visits lasting 30 minutes or more. Full-service restaurants, off-price retailers, and spa and wellness tenants also perform strongly on this measure, with more than half of visits lasting at least half an hour.
Strategic Takeaways
- Rather than square footage or traditional anchor status, landlords should prioritize a mix of factors that reflect how customers actually interact with tenants.
- Make visit frequency a major input into anchor and tenant-mix decisions.
- Prioritize categories that combine multiple strengths. Fitness, for example, pairs high frequency with strong growth and durable physical demand; grocery combines frequency, stability, and long-term lease commitments.
- Placemaking can help maximize frequency. Shared amenities, walkability, and events give customers a reason to linger and return, compounding the frequency advantage of service and food & beverage (F&B) tenants.
4. Center-Level Trends
Shopping centers have been reshaping their tenant mixes around the categories gaining traffic and leasing demand – but not uniformly. The role each category plays, and the priorities for landlords, differ by format.
A. Lifestyle Centers
Lifestyle centers compete primarily on experience and time-on-site rather than on convenience. And a tenant mix that gives shoppers multiple reasons to come – and to stay – can create a virtuous cycle: Longer visits encourage more cross-shopping, which in turn supports the higher rents commanded by specialty and premium tenants.
Traditionally, the lifestyle-center experience was anchored by dining and apparel, including the department stores that defined the format for decades. As recently as 2019, apparel was the second-largest draw, accounting for 16.2% of visits across the eight categories analyzed below.
But apparel’s pull has weakened. The category’s share of visits fell 3.2 percentage points between 2019 and 2025, dropping behind both limited-service restaurants and grocery. Dining, meanwhile, has become even more central – despite the national headwinds facing full-service restaurants, FSRs’ share of lifestyle-center visits declined by just 1.4 percentage points, leaving them firmly in place as the format’s largest traffic driver. That resilience suggests that the destination dining spots found in lifestyle centers are still doing much of the heavy lifting. Coffee, limited-service restaurants, and grocery all gained visit share over the same period.
Wellness and fitness also posted meaningful gains, as did off-price and value-oriented retailers. Banners such as Nordstrom Rack and Saks OFF 5TH now function as credible affluent-traffic anchors, pairing the appeal of the treasure hunt with access to desirable brands at more approachable prices.
Strategic Takeaways
- Treat the restaurant cluster as the primary anchor, not a secondary amenity.
- Backfill department-store and apparel boxes with wellness, experiential, and premium off-price tenants.
- Match tenant investment with placemaking investment – dwell time only pays off if the center converts it into cross-shopping.
- Investments in placemaking, from plazas and walkable layouts to outdoor dining and programmed community events, can further turn a collection of tenants into a destination, increasing both visit frequency and dwell time across the center.
B. Neighborhood Centers
Neighborhood centers, by contrast, compete on convenience and routine. The winning mix therefore centers on categories that bring the same customer back frequently and reliably.
Traditionally, that routine has been built around the grocery anchor. While grocery’s share of visits has declined modestly since 2019, it still accounted for a majority of visits across the analyzed categories in 2025. With shoppers visiting an average of 2.4 times per month, grocery remains one of the format’s most dependable sources of recurring traffic – and is relatively insulated from e-commerce disruption compared with categories such as apparel.
The more meaningful shift has been in neighborhood centers’ supporting tenant mix. Historically, soft goods, apparel, and bank branches occupied much of the inline space. Today, landlords are increasingly replacing those uses with categories – like fitness – that generate more frequent and durable visitation. Large-format gyms such as Planet Fitness and LA Fitness are increasingly serving as secondary anchors, while spa, wellness, and boutique-fitness concepts fit well into the 2,000–4,000-square-foot inline bays vacated by apparel stores and bank branches.
Restaurants and cafés also remain central. Although their combined share declined slightly, they still represent the second-largest visit driver, accounting for about a third of neighborhood-center visits, with coffee continuing to gain ground. Off-price and value retail, meanwhile, has strengthened its position as a dependable, high-traffic draw.
Strategic Takeaways
- Keep the grocery anchor; surround it with high-frequency, e-commerce-resistant uses that add weekday reasons to visit.
- Right-size vacated apparel and bank bays (2,000–4,000 SF) for spa, boutique fitness, and fast casual.
5. Tailoring the Mix to the Trade Area
The ideal tenant-mix framework is a starting point, but the right execution depends on the characteristics of the local trade area. And one of the clearest differentiators is household income: Brands within the same category often draw from meaningfully different income profiles, making the question not simply whether to add fitness, grocery, dining, or off-price, but which banner best fits the households a center serves.
The data shows a substantial spread. Life Time’s $115.9K trade-area median household income is roughly 51% higher than Planet Fitness’s $76.9K. In off-price, Nordstrom Rack’s $93.9K is about 22% higher than Ross’s $77.1K. And in grocery, Trader Joe’s $92.4K is roughly 20% higher than Kroger’s $77.2K. The category may be right for a center while the wrong banner can still overshoot – or undershoot – the local customer base.
For landlords, that makes trade-area income a useful guide to how premium the mix can go. In higher-income trade areas, the wellness, grocery, F&B, and off-price allocation can skew premium, with concepts such as Life Time, Trader Joe's, chef-driven and experiential dining (for example, True Food Kitchen), and premium off-price (Nordstrom Rack, Saks OFF 5TH). In middle-income and value trade areas, the same categories are better served by large-format value fitness (Planet Fitness, Crunch), mainstream grocery (Kroger), fast-casual and QSR dining, and value off-price (Ross, Burlington). The category framework holds across markets; the specific tenant should be chosen to fit the income profile of the trade area.
Strategic Takeaways
- Trade-area income segments sharply within categories: Premium banners sit in markedly higher-income areas than their value peers.
- Use the ideal-mix framework as a baseline, then tune the specific tenants to the trade area's median income.
6. Strategic Recommendations for Landlords
The neighborhood and lifestyle center model has been fundamentally reinvented. The winning centers of 2026 are built around a service-first ecosystem of health and wellness, food and beverage, grocery, fitness, and off-price retail. Centers that have not begun repositioning face structural risk, and the window for action is the next 36 months.
Immediate Actions (0–12 Months)
- Audit the tenant mix against current visit-mix benchmarks and identify where the center has opportunities to strengthen frequency, dwell time, and cross-shopping.
- Map upcoming lease events and vacancies to the strongest-fit categories and banners. Evaluate fitness, wellness, F&B, grocery, off-price, apparel, and other retail based on the center’s format, trade area, and existing mix.
- Build a fitness and wellness pipeline. Target large-format gyms for suitable anchor or junior-anchor opportunities and boutique fitness, med-spa, and wellness concepts for smaller inline spaces.
- Match F&B opportunities to the center type. Prioritize coffee and limited-service concepts for neighborhood centers and destination dining and upscale fast casual where lifestyle-center positioning supports them.
- Evaluate off-price separately from traditional apparel. Consider value-oriented banners for neighborhood centers and more affluent-oriented off-price concepts for lifestyle centers.
Medium-Term Strategy (1–3 Years)
- Build a wellness ecosystem. Cluster fitness, boutique fitness, and spa and wellness services so they function collectively as a destination rather than as isolated tenants.
- Develop an F&B cluster appropriate to the center. Build restaurant rows or dining districts at lifestyle centers, while strengthening everyday food and beverage at neighborhood centers.
- Layer placemaking onto the strongest clusters. Add outdoor seating, public-realm improvements, gathering spaces, and programming to amplify dwell time and repeat visitation.
- Use grocery as the platform for a broader neighborhood-center ecosystem. Curate adjacent uses that turn recurring grocery trips into longer, multi-purpose visits.
- Establish off-price as a deliberate component of the merchandise mix. Use the right banner for the center’s customer profile and positioning rather than treating all off-price concepts interchangeably.
- Curate categories around complementary trip missions. Over time, create a mix in which grocery drives routine trips, fitness and wellness add frequency and dwell, F&B expands dayparts, and apparel, off-price, and other retail create additional reasons to browse and shop.
For the broker's view on how these traffic patterns translate into leasing decisions, read Cushman & Wakefield's companion piece: The Retail Remix: The New Playbook for Tenant Curation.

Introduction
2024 has been another challenging year for retailers. Still-high prices and an uncertain economic climate led many shoppers to trade down and cut back on unnecessary indulgences. Value took center stage, as cautious consumers sought to stretch their dollars as far as possible.
But price wasn’t the only factor driving consumer behavior in 2024. This past year saw the rise of a variety of retail and dining trends, some seemingly at odds with one another. Shoppers curbed discretionary spending, but made room in their budgets for “essential non-essentials” like gym memberships and other wellness offerings. Consumers placed a high premium on speed and convenience, while at the same time demonstrating a willingness to go out of their way for quality or value finds. And even amidst concern about the economy, shoppers were ready to pony up for specialty items, legacy brands, and fun experiences – as long as they didn’t break the bank.
How did these currents – likely to continue shaping the retail landscape into 2025 – impact leading brands and categories? We dove into the data to find out.
Conventional Value Reaching Its Ceiling
Bifurcation has emerged as a foundational principle in retail over the past few years: Consumers are increasingly gravitating toward either luxury or value offerings and away from the ‘middle.’ Add extended economic uncertainty along with rapid expansions and product diversification from top value-oriented retailers, and you have an explosion of visits in the value lane.
But we are seeing a ceiling to that growth – especially in the discount & dollar store space. Throughout 2023 and the first part of 2024, visits to discount & dollar stores increased steadily. But no category can sustain uninterrupted visit growth forever. Since April 2024, year–over-year (YoY) foot traffic to the segment has begun to slow, with September 2024 showing just a modest 0.8% YoY visit increase.
Discount & dollar stores, which attract lower-income shoppers compared to both grocery stores and superstores, have also begun lagging behind these segments in visit-per-location growth. In Q3, the average number of visits to each discount and dollar store location remained essentially flat compared to 2023 (+0.2%), while visits per location to superstores and grocery stores grew by 2.8% and 1.0%, respectively. As 2024 draws to a close, it is the latter segments, which appeal to shoppers with incomes closer to the nationwide median of $76.1K, which are seeing better YoY performance.
The deceleration doesn’t mean that discount retailers are facing existential risk – discount & dollar stores are still extremely strong and well-positioned with focused offerings that resonate with consumers. The visitation data does suggest, however, that future growth may need to focus on initiatives other large-scale fleet expansions. Some of these efforts will involve moving upmarket (see pOpShelf), some will focus on fleet optimization, and others may include new offerings and channels.
Return of the middle anyone?
Innovative and Disruptive Value Shake Up Retail and Dining
Still, in an environment where consumers have been facing the compounded effects of rising prices, value remains paramount for many shoppers. And brands that have found ways to let customers have their cake and eat it too – enjoy specialty offerings and elevated experiences without breaking the bank – have emerged as major visit winners this year.
Trader Joe’s Drives Visits With Private Label Innovation
Trader Joe’s, in particular, has stood out as one of the leading retail brands for innovative value in 2024, a trend that is expected to continue into 2025.
Trader Joe’s dedicated fan base is positively addicted to the chain’s broad range of high-quality specialty items. But by maintaining a much higher private label mix than most grocers – approximately 80%, compared to an industry average of 25% to 30% – the retailer is also able to keep its pricing competitive. Trader Joe’s cultivates consumer excitement by constantly innovating its product line – there are even websites dedicated to showcasing the chain’s new offerings each season. In turn, Trader Joe’s enjoys much higher visits per square foot than the rest of the grocery category: Over the past twelve months, Trader Joe’s drew a median 56 visits per square foot – compared to 23 for H-E-B, the second-strongest performer.
Chili’s Beats QSR at its Own Game
Casual dining chain Chili’s has also been a standout on the disruptive value front this past year – offering consumers a full-service dining experience at a quick-service price point.
Chili’s launched its Big Smasher Burger on April 29th, 2024, adding the item to its popular ‘3 for Me’ offering, which includes an appetizer, entrée, and drink for just $10.99 – lower than than the average ticket at many quick-service restaurant chains. The innovative promotion, which has been further expanded since, continues to drive impressive visitation trends. With food-away-from-home inflation continuing to decelerate, this strategy of offering deep discounts is likely to continue to be a key story in 2025.
The Convenience Myth
Convenience is king, right?
Well, probably not. If convenience truly were king, visitors would orient themselves to making fewer, longer visits to retailers – to minimize the inconvenience of frequent grocery trips and spend less time on the road. But analyzing the data suggests that, while consumers may want to save time, it is not always their chief concern.
Looking at the superstore and grocery segments (among others) reveals that the proportion of visitors spending under 30 minutes at the grocery store is actually increasing – from 73.3% in Q3 2019 to 76.6% in Q3 2024. This indicates that shoppers are increasingly willing to make shorter trips to the store to pick up just a few items.
At the same time, more consumers than ever are willing to travel farther to visit specialty grocery chains in the search of specific products that make the visit worthwhile.
Cross visitation between chains is also increasing – suggesting that shoppers are willing to make multiple trips to find the products they want – at the right price point. Between Q3 2023 and Q3 2024, the share of traditional grocery store visitors who also visited a Costco at least three times during the quarter grew across chains.
Does this mean convenience doesn’t matter? Of course not. Does it indicate that value, quality and a love of specific products are becoming just as, if not more, important to shoppers? Yes.
The implications here are very significant. If consumers are willing to go out of their way for the right products at the right price points – even at the expense of convenience – then the retailers able to leverage these ‘visit drivers’ will be best positioned to grow their reach considerably. The willingness of consumers to forego convenience considerations when the incentives are right also reinforces the ever-growing importance of the in-store experience.
So while convenience may still be within the royal family, the role of king is up for grabs.
Serving Diners Quicker With Automatization
Chipotle Draws Crowds With Autocado
Convenience may not be everything, but the drive for quicker service has emerged as more important than ever in the restaurant space. Diners want their fast food… well, as fast as possible. And to meet this demand, quick-service restaurants (QSRs) and fast-casual chains have been integrating more technology into their operations. Chipotle has been a leader in this regard, unveiling the “Autocado” robot at a Huntington Beach, California location last month. The robot can peel, pit, and chop avocados in record time, a major benefit for the Tex-Mex chain.
And the Autocado seems to be paying off. The Huntington Beach location drew 10.0% more visits compared to the average Chipotle location in the Los Angeles-Long Beach-Anaheim metro area in Q3 2024. Visitors are visiting more frequently and getting their food more quickly – 43.9% of visits at this location lasted 10 minutes or less, compared to 37.5% at other stores in the CBSA.
Are diners flocking to this Chipotle location to watch the future of avocado chopping in action, or are they enticed by shorter wait times? Time will tell. But with workers able to focus on other aspects of food preparation and customer service, the innovation appears to be resonating with diners.
McDonald’s Leans into Automation in Texas
McDonald’s, too, has leaned into new technologies to streamline its service. The chain debuted its first (almost) fully automated, takeaway-only restaurant in White Settlement, TX in 2022 – where orders are placed at kiosks or on app, and then delivered to customers by robots. (The food is still prepared by humans.) Unsurprisingly, the restaurant drives faster visits than other local McDonald’s locations – in Q3 2023, 79.7% of visits to the chain lasted less than 10 minutes, compared to 68.5% for other McDonald’s in the Dallas-Fort Worth-Arlington, TX CBSA. But crucially, the automated location is also busier than other area McDonald’s, garnering 16.8% more visits in Q3 than the chain’s CBSA-wide average. And the location draws a higher share of late-night visits than other area McDonald’s – customers on the hunt for a late-night snack might be drawn to a restaurant that offers quick, interaction-free service.
Evolving Retail Formats - Finding the Right Fit
Changing store formats is another key trend shaping retail in 2024. Whether by reducing box sizes to cut costs, make stores more accessible, or serve smaller growth markets – or by going big with one-stop shops, retailers are reimagining store design. And the moves are resonating with consumers, driving visits while at the same improving efficiency.
Macy’s Draws Local Weekday Visitors With Small-Format Stores
Macy’s, Inc. is one retailer that is leading the small-format charge this year. In February 2024, Macy’s announced its “Bold New Chapter” – a turnaround plan including the downsizing of its traditional eponymous department store fleet and a pivot towards smaller-format Macy’s locations. Macy’s has also continued to expand its highly-curated, small-format Bloomie’s concept, which features a mix of established and trendy pop-up brands tailored to local preferences.
And the data shows that this shift towards small format may be helping Macy’s drive visits with more accessible and targeted offerings that consumers can enjoy as they go about their daily routines: In Q3 2024, Macy’s small-format stores drew a higher share of weekday visitors and of local customers (i.e. those coming from less than seven miles away) than Macy’s traditional stores.
Harbor Freight Tools and Ace Hardware Serve Smaller Growth Markets With Less Square Footage
Small-format stores are also making inroads in the home improvement category. The past few years have seen consumers across the U.S. migrating to smaller suburban and rural markets – and retailers like Harbor Freight Tools and Ace Hardware are harnessing their small-format advantage to accommodate these customers while keeping costs low.
Harbor Freight tools and Ace Hardware’s trade areas have a high degree of overlap with some of the highest growth markets in the U.S., many of which have populations under 200K. And while it can be difficult to justify opening a Home Depot or Lowe’s in these hubs – both chains average more than 100,000 square feet per store – Harbor Freight Tools and Ace Hardware’s smaller boxes, generally under 20,000 square feet, are a perfect fit.
This has allowed both chains to tap into the smaller markets which are attracting growing shares of the population. And so while Home Depot and Lowe’s have seen moderate visits declines on a YoY basis, Harbor Freight and Ace Hardware have seen consistent YoY visit boosts since Q1 2024 – outperforming the wider category since early 2023.
Hy-Vee Bucks the Trend by Going Big
Are smaller stores a better bet across the board? At the end of the day, the success of smaller-format stores depends largely on the category. For retail segments that have seen visit trends slow since the pandemic – home furnishings and consumer electronics, for example – smaller-format stores offer brands a more economical way to serve their customers. Retailers have also used smaller-format stores to better curate their merchandise assortments for their most loyal customers, helping to drive improved visit frequency.
That said, a handful of retailers, such as Hy-Vee, have recently bucked the trend of smaller-format stores. These large-format stores are often designed as destination locations – Hy-Vee’s larger-format locations usually offer a full suite of amenities beyond groceries, such as a food hall, eyewear kiosk, beauty department, and candy shop. Rather than focusing on smaller markets, these stores aim to attract visitors from surrounding areas.
Visit data for Hy-Vee’s large-format store in Gretna, Nebraska indicates that this location sees a higher percentage of weekend visits than other area locations – 37.7% compared to 33.1% for the chain’s Omaha CBSA average – as well as more visits lasting over 30 minutes (32.9% compared to 21.9% for the metro area as a whole). For these shoppers, large-format, one-stop shops offer a convenient – and perhaps more exciting – alternative to traditionally sized grocery stores. The success of the large-format stores is another sign that though convenience isn’t everything in 2024, it certainly resonates – especially when paired with added-value offerings.
A Resurgence of Legacy Brands
Many retail brands have entrenched themselves in American culture and become an extension of consumers' identities. And while some of these previously ubiquitous brands have disappeared over the years as the retail industry evolved, others have transformed to keep pace with changing consumer needs – and some have even come back from the brink of extinction. And the quest for value notwithstanding, 2024 has also seen the resurgence of many of these (decidedly non-off-price) legacy brands.
In apparel specifically, Gap and Abercrombie & Fitch – two brands that dominated the cultural zeitgeist of the 1990s and early 2000s before seeing their popularity decline somewhat in the late aughts and 2010s – may be staging a comeback. Bed Bath & Beyond, a leader in the home goods category, is also making a play at returning to physical retail through partnerships.
Anthropologie, another legacy player in women’s fashion and home goods, is also on the rise. Anthropologie’s distinctive aesthetic resonates deeply with consumers – especially women millennials aged 30 to 45. And by capturing the hearts of its customers, the retailer stands as a beacon for retailers that can hedge against promotional activity and still drive foot traffic growth.
And visits to the chain have been rising steadily. In Q4 2023, the chain experienced a bigger holiday season foot traffic spike than pre-pandemic, drawing more overall visits than in Q4 2019. And in Q3 2024, visits were higher than in Q3 2023.
Meeting the Evolving Needs of Millennials
And speaking of the 35 to 40 set – the generation that all retailers are courting? Millennials. Does that sound familiar? Yes, because this is the same generational cohort that retailers tried to target a decade ago. As millennials have aged into the family-formation stage of life, their retail needs have evolved, and the industry is now primed to meet them.
Sam’s Club Draws Value-Conscious Singles and Starters
From the revival of nostalgic brands like the Limited Too launch at Kohl’s to warehouse clubs expanding memberships to younger consumers as they move to suburban and rural communities, there are myriad examples of retailers reaching out to this cohort. And Sam’s Club offers a prime example of this trend.
Over the past few years, millennials and Gen-Zers have emerged as major drivers of membership growth at Sam’s Club, drawn to the retailer’s value offerings and digital upgrades – like the club’s Scan & Go technology. Over the same period, Sam’s Club has grown the share of “Singles and Starters” households in its captured market from 6% above the national benchmark in Q3 2019 to 15% in Q3 2024. And with plans to involve customers in co-creating products for its private-label brand, Sam’s Club may continue to grow its market share among this value-conscious – but also discerning and optimistic – demographic.
Taco Bell Brings in Crowds With Value Nostalgia Menu
Millennials are also now old enough to wax nostalgic about their youth – and brands are paying attention. This summer, Taco Bell leaned into nostalgia with a promotion bringing back iconic menu items from the 60s, 70s, 80s, and 90s – all priced under $3. The promotion, which soft-launched at three Southern California locations in August, was so successful that the company is now offering the specials nationwide. The three locations that trialed the “Decades Menu” saw significant boosts in visits during the promotional period compared to their daily averages for August. And people came from far and wide to sample the offerings – with a higher proportion of visitors traveling over seven miles to reach the stores while the items were available.
What Lies Ahead?
Hot on the heels of a tumultuous 2023, 2024’s retail environment has certainly kept retailers on their toes. While embracing innovative value has helped some chains thrive, other previously ascendant value segments, including discount & dollar stores, may have reached their growth ceilings. Consumers clearly care about convenience – but are willing to make multiple grocery stops to find what they need. At the same time, legacy brands are plotting their comeback, while others are harnessing the power of nostalgia to drive millennials – and other consumers – through their doors.

