


.svg)


.avif)
Last year’s holiday shopping season was an impactful one, with many categories seeing record-breaking sales and visits. And perhaps no category benefits from Q4 peaks quite like department stores, which see major foot traffic spikes on Black Friday and in the run-up to Christmas.
So with Q4 2024 seemingly primed to be another strong season, we took a look at department store visitation patterns this year and during previous holiday seasons to see what might lie ahead for the category in the coming weeks.
Predictable Seasonal Patterns
The holiday shopping calendar often begins as early as October, as consumers start preparing for Halloween before shifting their focus to Thanksgiving, Black Friday, and Christmas. This time of year tends to be one of the busiest for many retailers, as it encompasses a variety of shopping needs, including gifts and seasonal celebrations.
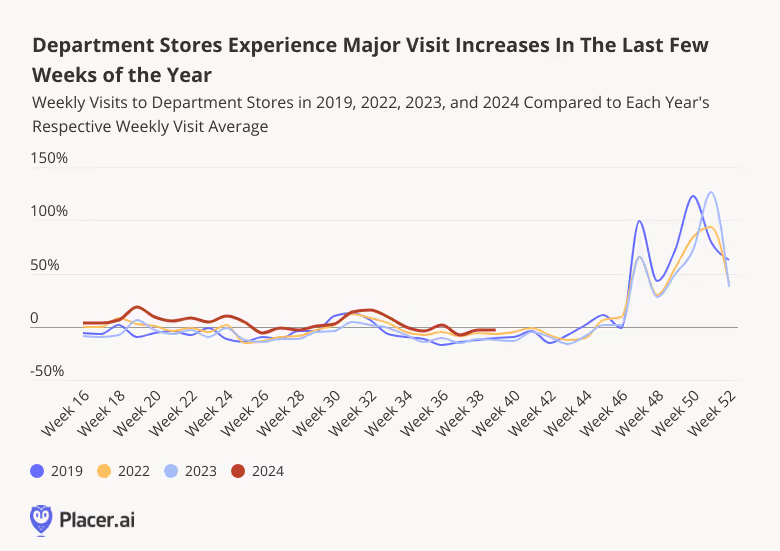
And one retail category that sees major visit increases every holiday season is department stores. Chains like Nordstrom, Macy’s, and Bloomingdale’s experience substantial spikes in visits throughout Q4 as shoppers flock to their locations to take advantage of sales and find gifts for their loved ones.
And though consumers’ holiday shopping behavior varies somewhat each year, analyzing weekly fluctuations in visits to department stores reveals some predictable patterns. Every year, visits to department stores see modest increases during major retail events like Valentine’s Day, Mother’s Day, and back-to-school shopping season – before surging during the week of Black Friday (week 47) and then again in the run-up to Christmas. During the week of last year’s Black Friday, for example, department store visits soared 65.2% above the 2023 weekly average – only to go even higher (122.8%) during the week before Christmas (week 51).
Nordstrom Picks Up The Pace
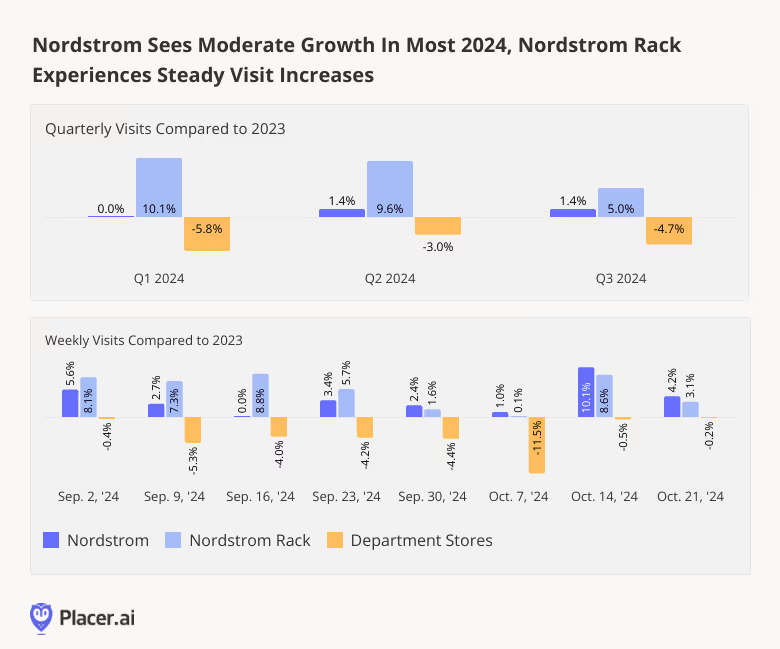
Nordstrom is one department store that seems poised to enjoy a particularly robust holiday shopping season this year. The chain, which operates more than 90 of its namesake stores, also has an off-price banner – Nordstrom Rack – with over 250 locations. And both brands have enjoyed stable visit growth since April 2024 – with quarterly YoY visits to Nordstrom and Nordstrom Rack elevated by 1.4% and 9.6%, respectively, in Q2 2024, and by 1.4% and 5.0%, respectively, in Q3 2024. By contrast, the wider department store category sustained consistent YoY visit gaps.
Drilling down deeper into weekly visit data shows that this positive trend continued into October. And while Nordstrom Rack – which is firmly in expansion mode – outperformed Nordstrom’s traditional stores through September, this trend reversed slightly in October, as the holiday season grew closer. With Black Friday just around the corner, both chains seem well positioned to continue driving visits to their respective stores.
Macy’s “Bold New Chapter” in Play?
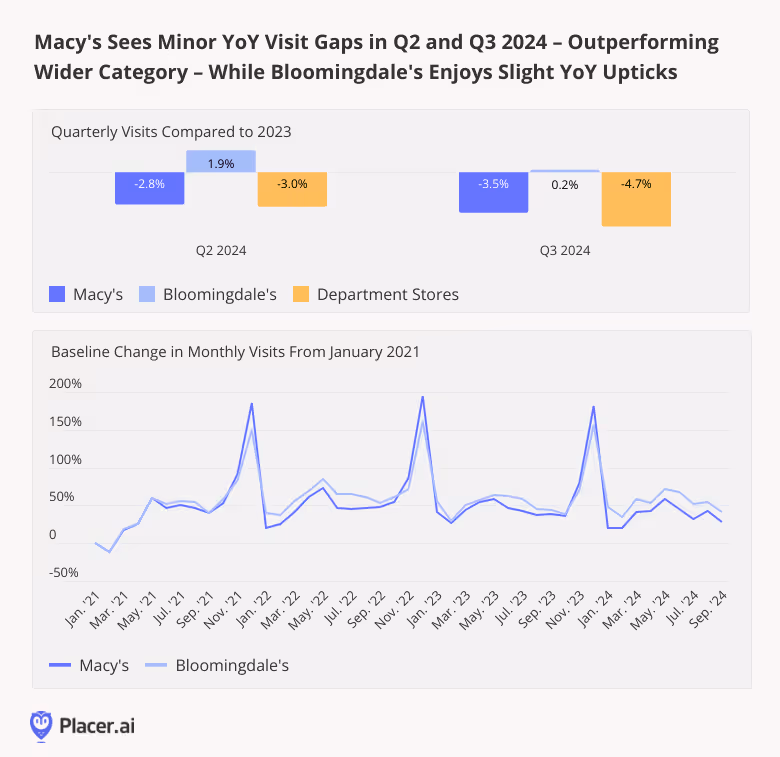
Macy’s Inc., for its part, is doubling down on its “Bold New Chapter” – a turnaround strategy involving a significant trimming of the company’s traditional Macy’s portfolio and the addition of several Bloomingdale’s and small-format stores. In August, Macy’s announced its intention to increase to 55 the number of Macy’s locations slated for closure by the end of 2024. And though the plan’s implementation is still in early stages, foot traffic data suggests that both Macy’s and Bloomingdale’s are holding their own.
In Q2 and Q3 2024, Macy’s sustained minor YoY visit gaps – 2.8% and 3.5%, respectively – slightly outperforming the broader category. Meanwhile, Macy’s high-end Bloomingdale’s brand saw a YoY visit uptick of 1.9% in Q2, while Q3 visits remained flat compared to 2023. And given the huge monthly visit spikes both chains experience each year in November and December, Macy’s and Bloomingdale’s appear well positioned to once again experience a surge in foot traffic as the holiday season begins.
Final Thoughts
If previous years are any indication, department stores should be getting ready for significant foot traffic increases as the holidays quickly approach. Will improving consumer sentiment and cooling inflation lead to visit increases at department stores, or will consumers decide to take it easy this year?
Visit Placer.ai to keep up with the latest data-driven retail insights.

The holiday season is right around the corner, bringing with it some of the most impactful shopping periods of the year. We took a closer look at visit performance across major wholesale clubs and superstores – Target, Walmart, Sam’s Club, BJ’s Wholesale, and Costco – to see what their 2024 performance and past holiday season visit patterns can tell us about what to expect this Q4.
Wholesalers Outperform Superstores in Q3 2024
Warehouse clubs have been thriving in 2024, buoyed by price-conscious consumers eager to load up on inexpensive essentials. In Q3, quarterly visits to retail giants Sam’s Club and BJ’s Wholesale rose 5.2% and 5.9%, respectively. And Costco, holding its place ahead of the pack, saw a foot traffic increase of 7.2%. For all three chains, the robust visit growth continued into October, with visits up 3.6% to 5.9% YoY.
Meanwhile, Target and Walmart saw respective quarterly YoY foot traffic upticks of 1.0% and 0.9% in Q3 2024. In August – the height of the back-to-school shopping season – visits to both chains increased just over 3.0% YoY. And though foot traffic to the superstore behemoths slowed in September as the summer rush abated, Target saw its visit gap narrow once again in October, while Walmart experienced a slight 0.2% increase.

Historic Holiday Season Visit Spikes
Warehouse retailers have been the clear foot traffic winners this year – but digging deeper into historical data suggests that it is Target that is primed to experience the busiest holiday season of the analyzed chains.
During the week of November 20th, 2023 – the week of Turkey Wednesday and Black Friday – visits to Target soared 18.9% compared to the chain’s 2023 weekly visit average, marking the biggest pre-Thanksgiving visit spike of any of the analyzed chains.
But Target’s real visit surge came during the week of December 18th – the week before Christmas, including the all-important Super Saturday – when visits to Target surged 87.3% above the chain’s 2023 weekly visit average. This was more than double the relative increase experienced by Walmart (39.6%), Sam’s Club (32.8%), BJ’s Wholesale (32.3%), or Costco (34.1%). And with recent visits to Target on par with – or slightly above – last year’s levels, the retail giant is likely poised to win the holidays once again.

Regional Holiday Shopping Patterns
Overall, Super Saturday was a bigger milestone for Target last year than Black Friday. (On the former, visits surged 166.1% compared to a 2023 daily average, while on the latter they rose 135.3%.) But digging deeper into the data reveals significant regional differences in Target’s performance on the two major shopping days.
In some parts of the country – including several midwestern, south central, and nearby states where Black Friday has special resonance – the day after Thanksgiving drew bigger visit spikes than Super Saturday. Some markets in particular saw outsized Black Friday visit surges, including West Virginia (348.6%), Kentucky (232.3%), and Indiana (227.4%). Other markets, such as California (74.6%) and Colorado (89.5%), experienced more moderate – though still substantial – Black Friday jumps.
In contrast, visits to Target on Super Saturday were more evenly distributed across the country, with several western and sunbelt states recording substantial visit increases – including New Mexico, which saw a 200.6% jump in visits to Target on December 23, 2023 compared to the 2023 daily visit average.

Ready, Set, Shop!
With solid Q3s under their belts, Target, Walmart, Costco, Sam’s Club, and BJ’s Wholesale Club are all well-positioned to enjoy a robust holiday season this year. Will the retail giants deliver?
Follow Placer.ai’s data-driven retail analyses to find out.

A cool housing market, still-high interest rates, and other economic headwinds have weighed on the home improvement industry this year. But how did category leaders The Home Depot and Lowe’s fare in Q3 2024 – and what lies ahead for them this holiday season?
We dove into the data to find out.
Nationwide and Regional Powerhouses
Looking first at the relative positioning of Home Depot and Lowe’s within the wider home improvement sector shows that the two leaders have maintained their dominance, despite the growing popularity of smaller chains like Harbor Freight Tools and Tractor Supply Co.
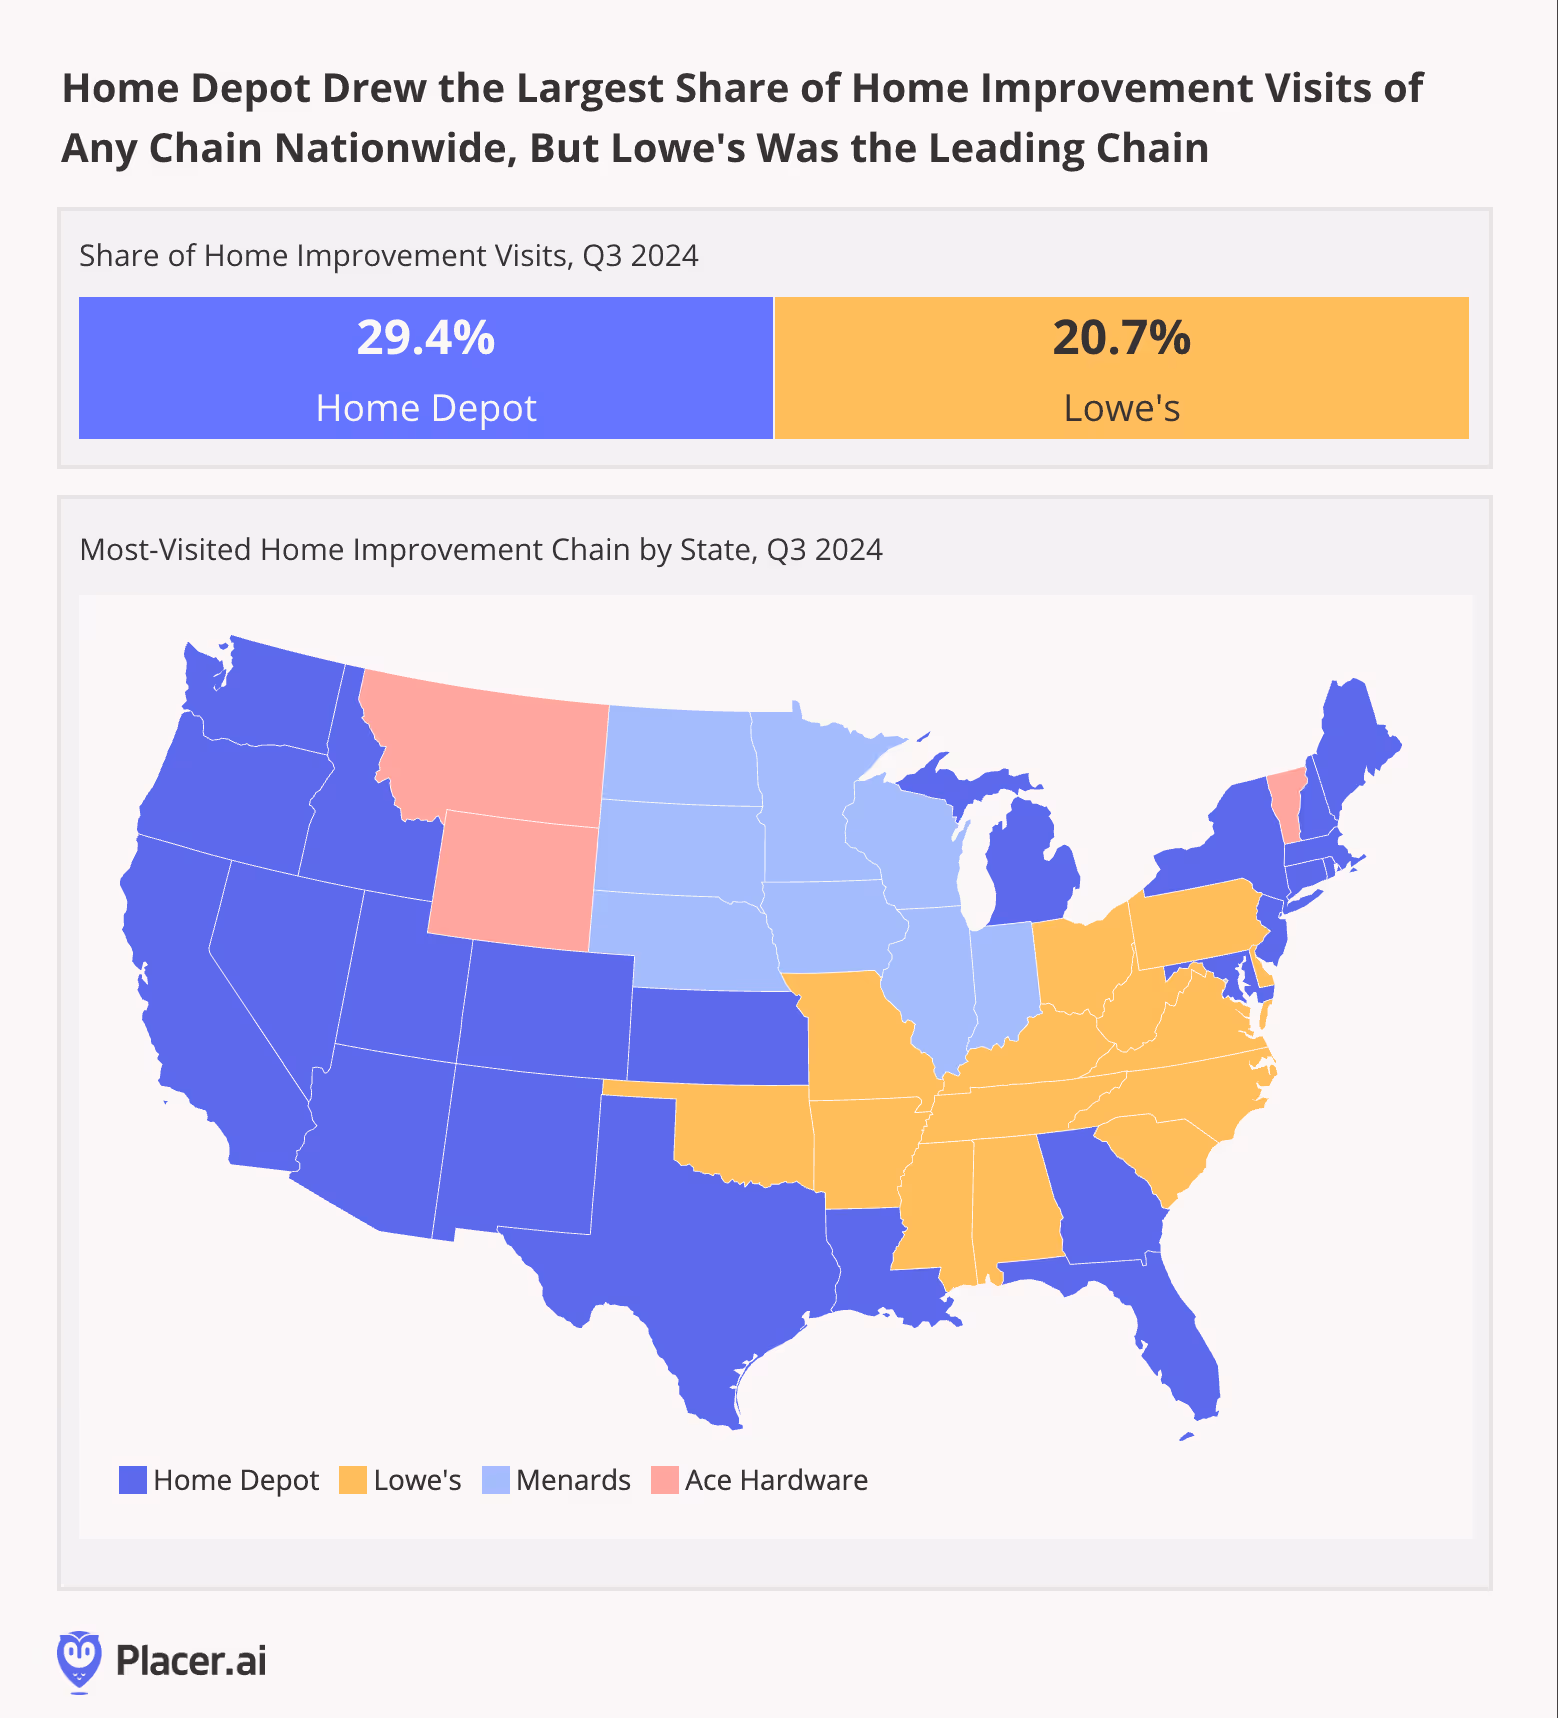
In Q3 2024, Home Depot accounted for 29.4% of visits to home improvement and furnishing chains nationwide – while Lowe’s accounted for 20.7%. And diving into the data on a statewide level shows that each of the giants holds sway in a different area of the country. Home Depot drew the most visits in much of the Western United States as well as in most of New England. Lowe’s, on the other hand, led parts of the South and Midwest. And in some states, smaller chains like Menards and Ace Hardware dominated the landscape.
Holiday Momentum
Given the challenges faced by the home improvement industry this year, it may come as no surprise that both Home Depot and Lowe’s sustained year-over-year (YoY) visit gaps in Q3 2024 – 3.1% and 4.1%, respectively. But digging deeper into the data suggests that the two chains may still be poised to enjoy a robust holiday season.
Unlike many other categories, visits to home improvement chains tend to peak in spring rather than during the holiday season. Still, Home Depot and Lowe’s do see visit spikes on Q4 retail milestones like Black Friday and Super Saturday. Last year, for example, Home Depot and Lowe’s drew 77.8% and 78.6% more visits, respectively, on Black Friday (Nov. 24th) than on an average day in 2023. Indeed, the big day was Home Depot’s busiest day of 2023 and Lowe’s second-busiest.
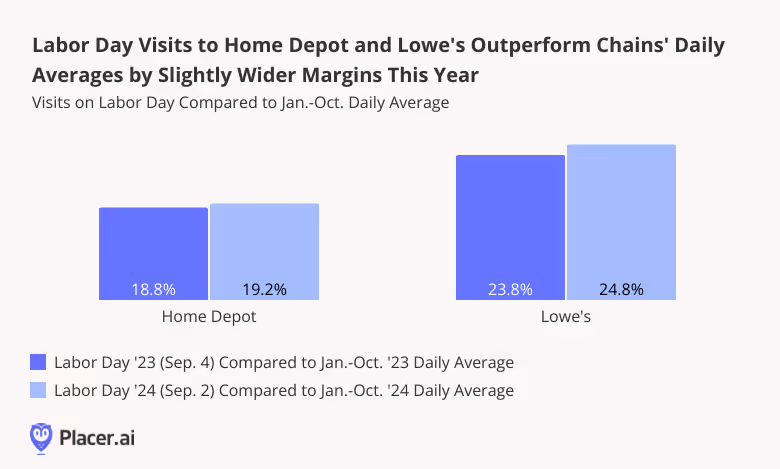
And a look at Home Depot and Lowe’s visit performance during Labor Day – another, more recent retail milestone – shows that the two chains continue to excel at attracting visits on key calendar days. On September 4th, 2023 (Labor Day last year), visits to Lowe’s were 23.8% higher than the January to October 2023 daily visit average. And this year, Lowe’s relative Labor Day spike was even more significant – 24.8%. Home Depot, too, saw a slightly more pronounced Labor Day boost this year than last. So even if overall foot traffic to the home improvement leaders remained somewhat below last year’s levels, they may be in for a busy Q4.
Looking Ahead
The home improvement industry has yet to regain its pandemic-era glory. But analyzing visit trends to category leaders shows that holiday visit spikes may help fuel a successful holiday season this year. How will Lowe’s and Home Depot perform on Black Friday?
Follow Placer.ai’s data-driven retail analyses to find out.

Starbucks, the largest coffee chain in the world, and Dutch Bros, one of the fastest growing in the country, are major players in the hot and cold beverage space. With Q3 2024 in the rearview mirror, we took a closer look at the visitation patterns to both chains to see how they are faring – and what might lie ahead for both brands.
Starbucks Sees Stronger Short Stays
Starbucks is one of the most dominant names in coffee across the world, with thousands of stores in the United States alone. Between July 2023 and July 2024, the chain added more than 500 stores to its domestic fleet, bringing its U.S. store count to 16,730. And though Starbucks has faced its share of challenges, these store additions helped keep overall traffic to the coffee leader on par with 2023 levels throughout the summer – though visits dipped somewhat in September as consumers went back to their routines.
But digging deeper into the visit data shows that even as Starbucks saw overall foot traffic growth stall in Q3, the number of short visits to the chain – i.e. those lasting less than 10 minutes – increased. In August and September 2024, the chain drew 8.5% and 4.7% more short visits, respectively, than in the same periods of 2023 – revealing how important these quick stops are for the chain.
In-app ordering, which together with drive-thru orders made up about 70% of sales at the chain as of January 2024, may be contributing to the short visit trend. Still, new CEO Brian Niccol is looking for ways to return the chain to its roots as the third place, and the chain may yet implement shifts to encourage longer visits in the coming months.

Dutch Bros Brings The Visits
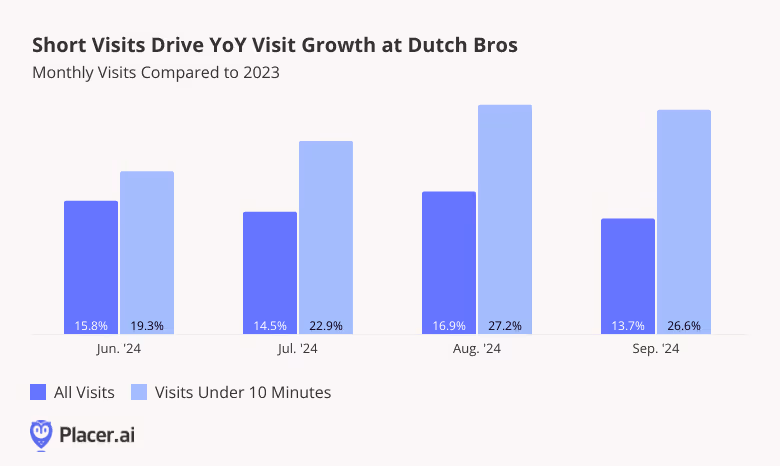
Dutch Bros has been one of the most impressive coffee chains to watch over the past few years. The Oregon-based chain has been on an expansion tear – opening more than 150 stores between Q2 2023 and Q2 2024 – and has seen the elevated monthly visits to match. Between June and September 2024, visits to Dutch Bros increased between 13.7% and 16.9%, highlighting the chain’s success at growing its audience.
But like at Starbucks, short visits outperformed longer ones at Dutch Bros – and by a lot. In September 2024, for example, overall visits to the chain grew by 13.7% – but visits lasting less than 10 minutes shot up by 26.6%.
The strength of these short visits, for both Starbucks and Dutch Bros, suggests a shift towards convenience, with both chains utilizing drive-thru services and in-app ordering to accommodate busy consumers.
Weekends Lead To Lingering Visitors
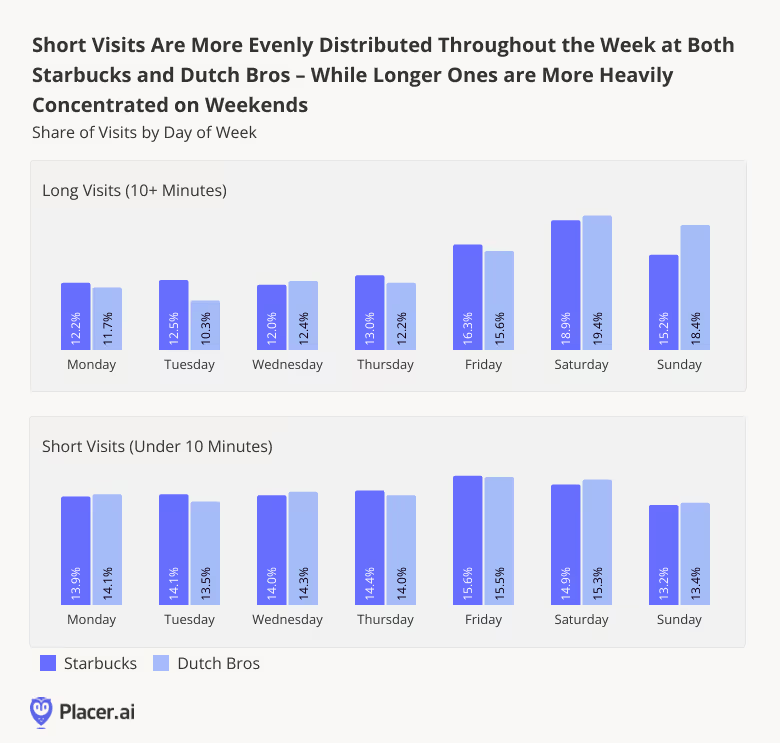
Digging down deeper into the data shows that for both Starbucks and Dutch Bros, these all-important short visits follow a distinct weekly pattern.
While longer visits (≥10 minutes) to both chains peaked in Q3 2024 on Saturdays, shorter visits were more evenly distributed throughout the week, peaking on Fridays. Overall, 34.1% of long visits to Starbucks, and 37.8% of long visits to Dutch Bros, took place on the weekends in Q3 2024 – compared to 28.1% and and 28.7%, respectively, for shorter visits.
Unsurprisingly, customers may be more likely to grab a quick coffee to go during the work week. And with the return to office still underway, quick visits may be enjoying a boost fueled by commuters in need of a quick cubicle pick-me-up.
Final Sips
As Starbucks works to adapt to shifting consumer preferences, understanding when customers spend more time in-store can help the brand reconnect with its roots as a community hub. And Dutch Bros can continue to enhance the quick-service experience that has fueled its growth. How will the two chains continue to perform in what remains a competitive coffee environment?
Follow Placer.ai for the latest data-driven dining insights.

In recent years, Americans have gotten serious about fitness. Even as consumers tightened their purse strings, they found room in their budgets for the ultimate affordable indulgence: A (relatively) low-cost gym membership that, once paid, offers customers unlimited access to club facilities.
How did Planet Fitness, the nation’s largest value gym perform in Q3 2024? We dove into the data to find out.
Still Sprinting Ahead
Planet Fitness has been on a roll. In Q2 2024, the chain reported a 4.2% system-wide increase in same store sales and the addition of 18 new gyms to its fleet. (Though Planet Fitness operates clubs outside the U.S., the vast majority of its some 2600 locations are domestic).
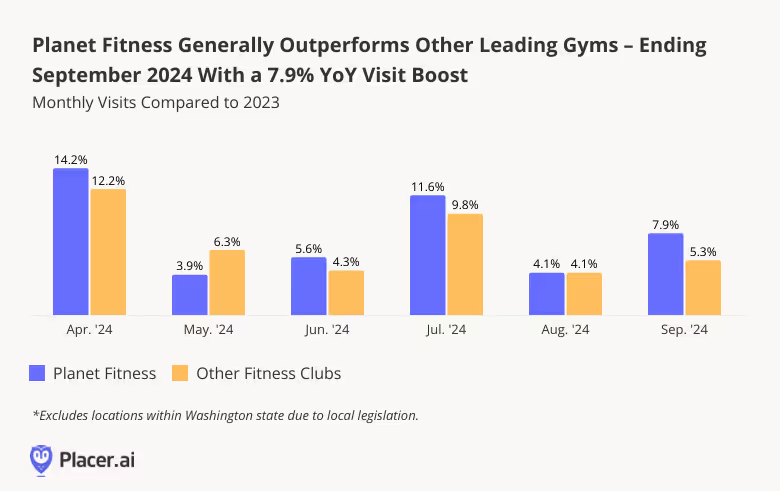
Foot traffic data shows that the chain continued to thrive through Q3, with year-over-year (YoY) monthly visit upticks ranging from 4.1% to 11.6% – outperforming the wider industry. And while the value gym giant finally raised the price of its basic membership this summer for the first time in more than thirty years, the move does not seem to have dented Planet Fitness’ growth trajectory – though it’s still early days.
Hardcore Gym Enthusiasts Do the Heavy Lifting
Planet Fitness takes pains to emphasize its commitment to being a “Judgement Free Zone” – and casual gym-goers make up a significant portion of its visitor base. In Q3 2024, 44.3% of visitors hit the club, on average, less than twice a month.
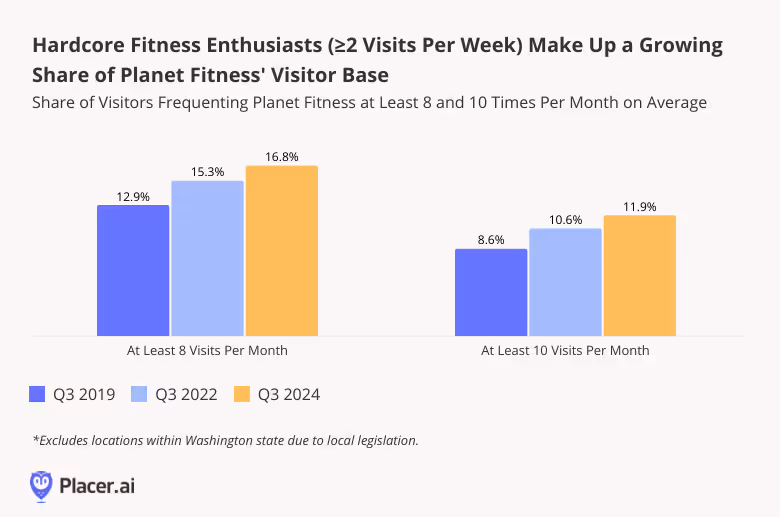
But Planet Fitness also has a significant – and growing – share of die-hard gym buffs who visit the club at least eight or ten times a month - i.e. at least twice a week. In Q3 2024, a full 16.8% of visitors to Planet Fitness came to the gym at least eight times a month on average – up from just 12.9% in 2019 and 15.3% in 2022. And 11.9% visited the chain ten or more times a month – up from 8.6% in 2019 and 10.6% in 2022.
Though casual visitors are also important for any fitness club’s bottom line, a strong and thriving community of highly committed members is an important foundation for future growth.
Regional Frequency Roundup
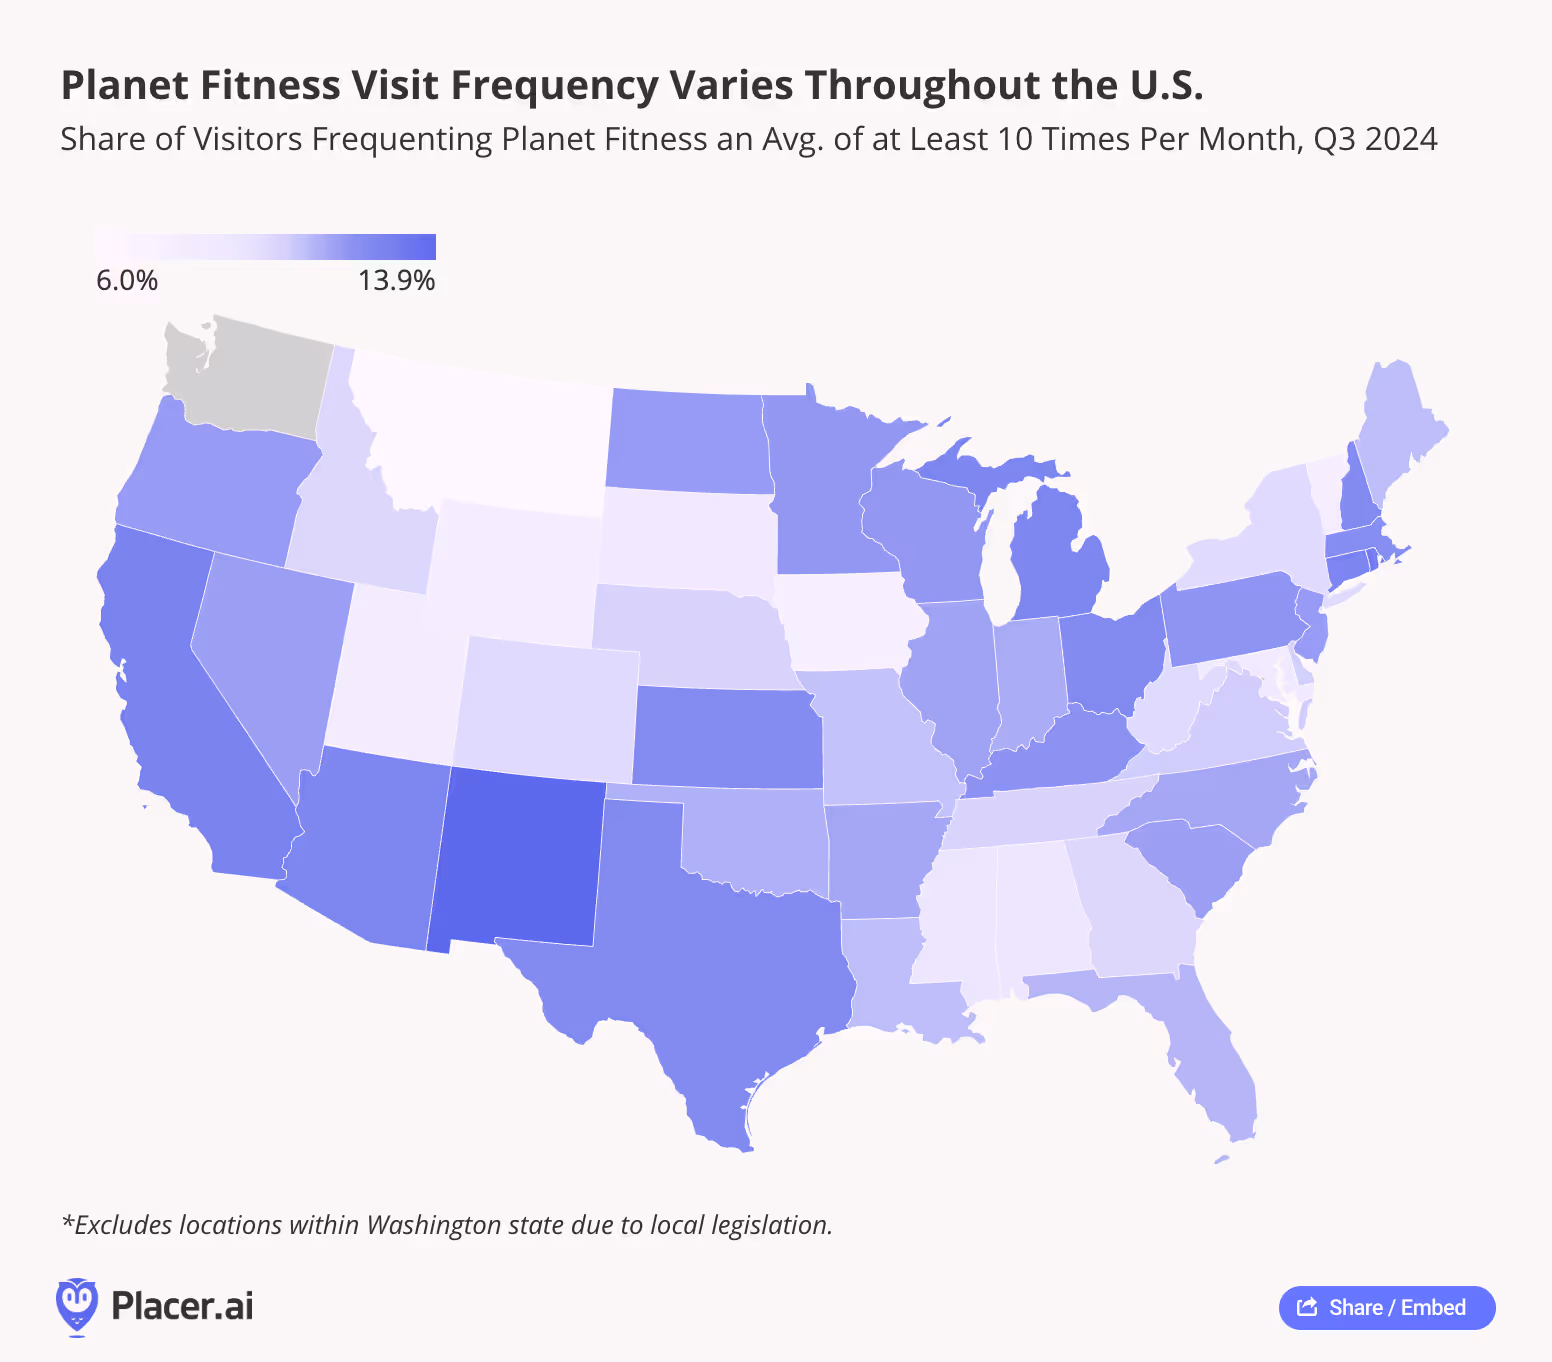
Gym visit frequency, however, varies throughout the United States. Analyzing the share of highly committed visitors to Planet Fitness reveals significant differences between states.
New Mexico led the pack in Q3 with 13.9% of visitors frequenting the gym, on average, at least ten times a month – followed by Rhode Island (13.1%) and California (12.7%). On the other end of the spectrum lay Montana, where just 6.0% of club goers were highly committed visitors in Q3, followed by Iowa (7.7%) and Vermont (8.0%).
This data highlights how gym engagement can be influenced by regional factors such as lifestyle, climate, and access to alternative fitness options – suggesting that Planet Fitness and similar chains may benefit from tailoring their marketing and membership strategies to local trends and preferences.
Rep and Repeat
The holiday season isn’t a particularly busy one for gyms – which usually see traffic begin to slow down in September before picking up again in the new year. But if Planet Fitness’ solid September 2024 performance is any indication, the chain may be in for a busier fourth quarter this year than last. Will Planet Fitness continue to deliver as the year draws to a close?
Follow Placer.ai’s data-driven analyses to find out.
This blog includes data from Placer.ai Data Version 2.1, which introduces a new dynamic model that stabilizes daily fluctuations in the panel, improving accuracy and alignment with external ground truth sources.

In a market ruled by value and convenience, traditional full-service restaurants (FSRs) have faced an uphill slog. But even in 2024, some FSRs are flourishing. We dove into the data to explore factors driving success at three very different full-service chains: First Watch, Chili’s Grill & Bar, and Outback Steakhouse.
First Watch: Expansion, Unabated
First Watch first burst onto the scene in 1983 with a single restaurant in California – and now boasts some 544 locations across 29 states. With offerings ranging from Superfood Kale Salads to more traditional pancakes and bacon and eggs, First Watch has emerged as a prime destination for diners seeking to enjoy a leisurely breakfast with family and friends.
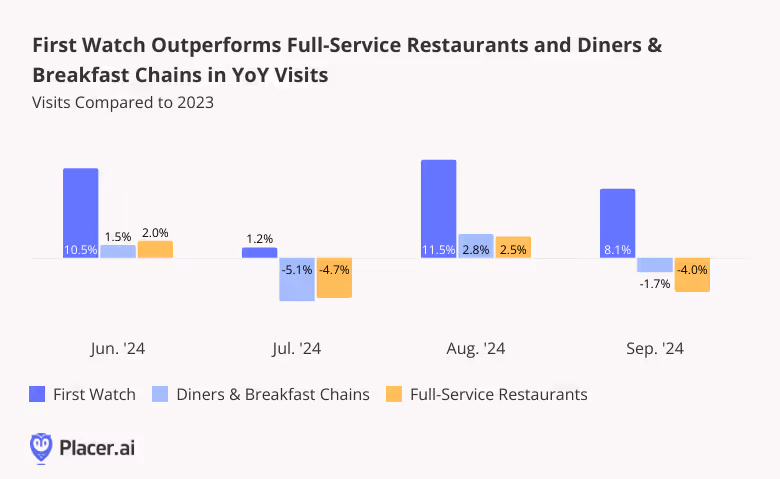
And foot traffic data shows that First Watch, still firmly in expansion mode, is continuing to grow its audience. Between June and September 2024, First Watch saw consistent year-over-year (YoY) visit growth, outperforming both the full-service restaurant category and other diners & breakfast spots.
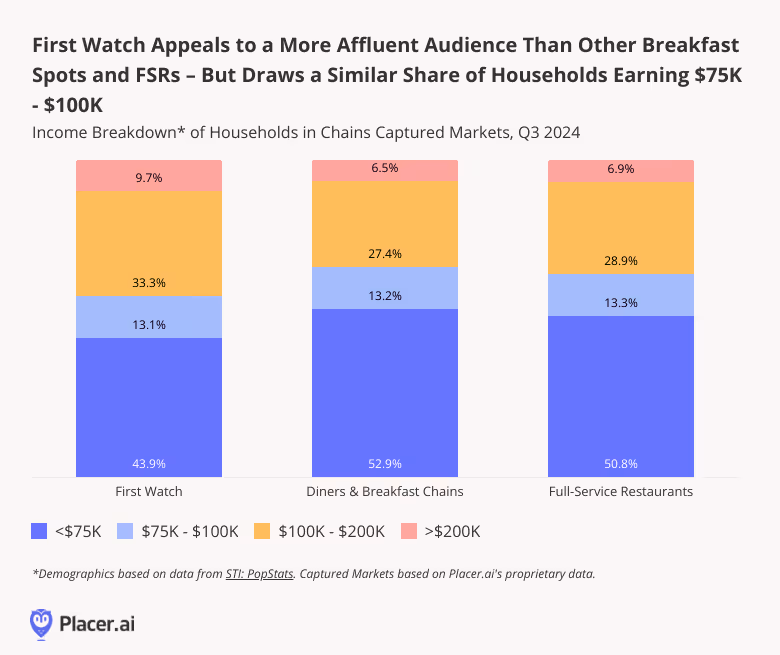
One factor that may be helping to propel First Watch’s success is the relative affluence of its customer base. Analyzing the income breakdown of First Watch’s trade area shows that in Q3 2024, nearly ten percent (9.7%) of households in the chain’s captured market earned $200K+ per year, compared with 6.5% for diners & breakfast chains and 6.9% for the wider FSR space. On the flip side, only 43.9% of households in First Watch’s captured market had annual incomes below $75K, compared to just over 50.0% for both analyzed segments.
Amidst concerns surrounding food inflation, rising labor costs, and discretionary spending cutbacks, First Watch’s wealthier customer base may be helping to shield it from some of the value pressures that have weighed on other restaurants – contributing to its resilience.
Chili’s Grill & Bar Rides the Big Smasher Wave
Another FSR that has been experiencing outsized visit growth this year – at least since April – is Chili’s Grill & Bar. Following a tepid start to the year, Chili’s launched its much-vaunted Big Smasher Burger on April 29th, 2024, and hasn’t looked back since.
The new offering, added to Chili’s 3 For Me value menu, presented a full-service value challenge to QSR favorites like the Big Mac. And in Q2 2023, the item helped drive a 14.8% increase in same-store sales.
Since the big launch, weekly YoY visits to Chili’s have been consistently elevated – kept aloft with the help of viral hype around Chili’s long standing Triple Dipper offering, as well as the new secret Nashville Hot Mozz offering that became so popular it spawned a halloween costume.
Unlike First Watch, Chili’s has found success by embracing its role as a value chain. The median household income (HHI) of Chili’s captured market in Q3 2024 was $73.1K – below the nationwide median of $76.1K, and on par with that of the wider FSR space ($73.7K – By way of comparison, the median HHI of First Watch’s captured market was $85.6K in Q3).
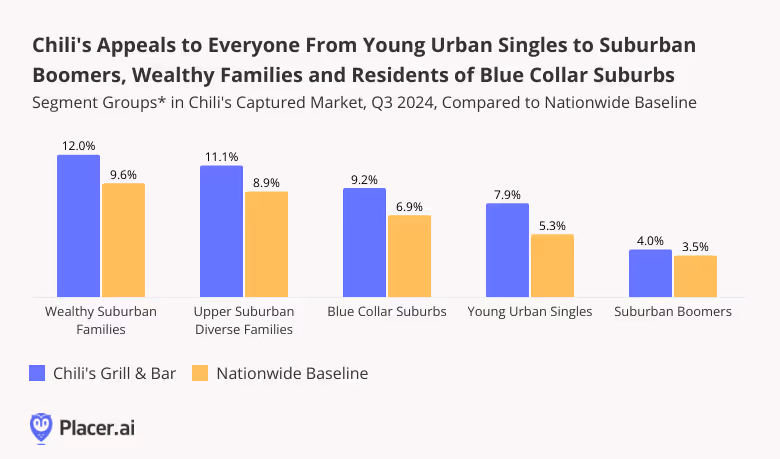
And a closer look at the demographic make-up of Chili’s captured market shows just how broad the appeal of the chain is. In Q3 2024, Chili’s visitor base was over-represented for a wide range of segments across age and income groups – from “Wealthy Suburban Families” to “Young Urban Singles”, “Suburban Boomers’, and residents of “Blue Collar Suburbs”. By delivering high-quality meals at affordable prices, Chili’s has solidified its place as an everyman’s chain, offering value comparable to that of quick-service restaurants.
Bloomin Brands’ Outback Steakhouse Rocks the Pacific West
Aussie-themed Outback Steakhouse – Bloomin’ Brands’ biggest chain – is another full-service restaurant that is successfully weathering the storm. Like other FSRs, Outback has faced its fair share of challenges over the past few years, with rising costs and spending cutbacks taking a toll on the chain’s performance. But in Q3 2024, the average number of visits to each Outback Steakhouse location increased 0.5% YoY, even as overall traffic to the chain fell 1.7% in the wake of strategic rightsizing moves that included the shuttering of a number of underperforming locations. By contrast, the average number of visits per location in the wider FSR space dropped 1.2%, while overall foot traffic to the segment fell 2.1%. Outback Steakhouse’s ability to sustain a YoY visit-per-location uptick in Q3, even if a minor one, shows that its rightsizing efforts are paying off.
And drilling down deeper into regional data for the chain shows that in some areas of the country, Outback Steakhouse is positively thriving. In California, Outback’s third-largest market in terms of store count, the chain saw a YoY visit increase of 5.3% – significantly higher than the statewide FSR average of 1.1%. In Washington and Oregon, Outback Steakhouse experienced even more substantial visit increases – 9.0% and 9.6%, respectively – even as full-service restaurants generally languished. And in all three states, the number of Outback Steakhouse locations has remained basically unchanged over the past year, meaning that these increases reflect the growing draw of the chain’s existing venues.

FSR Chains Ahead of the Pack
First Watch, Chili’s Grill & Bar, and Outback Steakhouse are very different full-service chains – but each of them is thriving in its own way. How will the three brands fare as the holiday season picks up steam?
Follow Placer.ai’s data-driven dining analyses to find out.
This blog includes data from Placer.ai Data Version 2.1, which introduces a new dynamic model that stabilizes daily fluctuations in the panel, improving accuracy and alignment with external ground truth sources.

