


.svg)


Turkey Wednesday – the day before Thanksgiving – is the grocery industry’s Black Friday. As shoppers flock to stores for turkeys, cranberry sauce, and other holiday essentials, the day delivers impressive visit spikes for grocery, superstore, and dollar stores alike. But how did this year’s Turkey Wednesday measure up – and which brands capitalized most successfully on this critical shopping event?
We dove into the data to find out.
Gobble Till You Wobble
People love to shop – but they also love to procrastinate, descending on stores just before major holidays to grab last-minute supplies. So far in 2024, March 30th (Easter Eve), May 11th (the day before Mother's Day), and November 27th (Turkey Wednesday) have been the busiest days of the year for grocery stores, superstores, and discount & dollar stores. But while the first two milestones drew bigger crowds to superstores and discount & dollar stores – both natural destinations for gift buyers and food shoppers alike – Turkey Wednesday was the grocery sector’s time to shine.
On November 27th, 2024, grocery stores saw visits surge by 81.0% compared to a year-to-date (YTD) daily average, capturing over half (51.2%) of visits across grocery, superstore, and discount chains. (During the rest of the year, grocery stores account for just 46.6% of the three industries’ overall visit pie.) Still, superstores and discount & dollar stores also attracted plenty of pre-Thanksgiving shoppers with enticing holiday promotions of their own. And despite reports of consumer cut-backs ahead of the holiday, this year’s Turkey Wednesday performance was on par with last year’s, with grocery visits on November 27th 2024 up 0.7% relative to November 22nd 2023 (last year’s Turkey Wednesday).

See You in Mississippi – and Minnesota
Diving into statewide grocery store data shows that like Black Friday, Turkey Wednesday’s appeal isn’t evenly distributed across the United States. Though grocery visits spiked nationwide on November 27th, 2024, some regions saw bigger foot traffic peaks than others.
In the Pacific Northwest, parts of New England, and some Mountain states, for example, grocery visits increased by less than 70.0% compared to a YTD daily average. But in parts of the Midwest and South, visits spiked by over 90.0%. Mississippi and Minnesota in particular stood out as major Turkey Wednesday winners, with visits up 96.8% and 96.5%, respectively. These regional differences highlight Turkey Wednesday’s special resonance in areas where holiday shopping traditions like Black Friday also dominate.

Traditional Grocery Chains Claim the Spotlight
Which grocery chains benefit the most from Turkey Wednesday? A look at individual brands shows that traditional grocery stores – think Kroger, Albertsons, and Safeway – generally see bigger pre-Thanksgiving visit boosts than limited-assortment value chains like Aldi and Trader Joe’s. And in keeping with the regional trends noted above, some of the best-performing chains are midwestern favorites like Schnucks and Albertsons’ Jewel-Osco, which saw Turkey Wednesday foot traffic surges this year of 103.9% and 92.6%, respectively.
But numerous other chains also saw major Turkey-fueled visit increases on November 27th – including Food 4 Less, the Kroger-owned regional value chain with locations in both the Midwest and California, and East Coast brands ShopRite and Wegmans. When it comes to last-minute holiday shopping, it seems, there is plenty of room for multiple brands to thrive.

Budget Brands Get in the Game
Though value-oriented grocery chains typically see smaller visit spikes on Turkey Wednesday, many budget brands are steadily growing their pre-holiday audiences.
Grocery Outlet Bargain Market and Aldi saw foot traffic rise by 13.5% and 11.2%, respectively, on November 27th, 2024 compared to last year’s Turkey Wednesday. (Both chains also saw substantial increases in the average number of visits to each of their individual locations – 9.7% and 8.4%, respectively – proving that the increase isn’t solely a result of fleet expansion.) Meanwhile, traditional grocery leaders like H-E-B, Kroger’s Ralphs, Ahold Delhaize’s Hannaford, and Albertsons’ Jewel Osco, also recorded year-over-year (YoY) foot traffic gains, highlighting robust performance across much of the sector.

No Time to Go Cold Turkey
Groceries are a crucial part of the Thanksgiving holiday – but liquor, it seems, may be even more indispensable. On November 27th, 2024, visits to liquor stores surged even higher than visits to grocery stores – generating a remarkable 186.4% visit spike, as consumers stocked up on spirits to ease the mood at stressful family gatherings or to show gratitude to hard-working hosts. Like for grocery stores, Turkey Wednesday was liquor stores’ busiest day of the year so far – though if last year is any indication, the run-up to Christmas will likely generate even more impressive traffic bumps.

Plenty of Gratitude to Go Around
Turkey Wednesday 2024 reaffirmed the key role played by traditional grocery stores in the run-up to Thanksgiving. And though supermarkets and liquor stores stole the spotlight, superstores and discount & dollar stores also experienced significant visit upticks – and value chains are steadily growing their pre-holiday audiences. How will these categories continue to fare throughout the rest of the holiday season?
Follow Placer.ai’s data-driven retail analysis to find out.

How did leading eatertainment chains Dave & Buster’s and Chuck E. Cheese perform in Q3 2024? We dove into the data to find out.
Dave & Buster’s Sees Lower But More Extended Summer Visit Peak
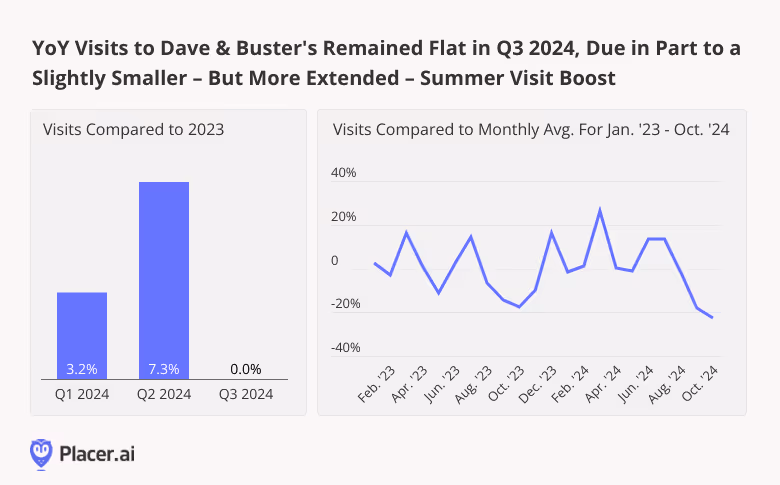
Since January 2024, Dave & Buster’s has enjoyed mainly positive YoY visit growth, fueled in part by the eatertainment leader’s continued expansion. In Q2 and Q3 2024, visits to the chain were up 3.2% and 7.3%, respectively. And though YoY foot traffic to the chain slowed down in Q3 2024, a look at Dave & Buster’s monthly visit patterns shows that this may have been due in part to a summer visit peak that was slightly lower – but more extended – than that seen last year.
In 2023, Dave & Buster’s experienced three distinct visit spikes – in March, July, and December – with the restaurant’s 14.6% July visit boost (compared to a monthly average for Jan. ‘23 - Oct. ‘24) preceded by a relatively quiet June (+2.0%). But this year, summer foot traffic began to trend upwards earlier, with both June and July seeing substantial upticks – 13.6% and 13.4%, respectively. (June is in Q2 and so this part of the uptick would not have been included in Q3 foot traffic numbers). And though September, usually a down period for Dave & Buster’s, saw a modest drop in visitors compared to 2023, the chain’s March peak was higher than last year’s.
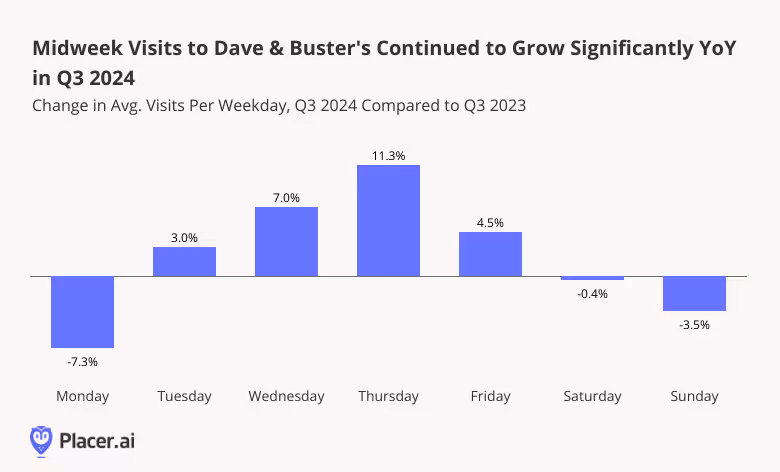
Weekday Visits on an Upswing
Digging even deeper into the data shows that even as YoY quarterly visits to Dave & Buster’s remained flat in Q3 2024, mid-week visits to the chain continued to climb. Dave & Buster’s has been investing heavily in mid-week promotions meant to drive traffic during quieter periods, and its efforts are clearly paying off. On Wednesdays, Dave & Buster’s offers a 50% discount on games – and the average number of Wednesday visits to the chain were up 7.0% YoY. Thursdays, too, saw an 11.3% YoY foot traffic increase, likely fueled by diners drawn to Thursday specials as the most intensive part of the work week wound down. (In Q3 2024, July 4th fell on a Thursday, which also generated a significant visit bump – but even when discounting the week of the holiday, Thursday visits were up 6.4% on average.)
Against the backdrop of solid seasonal peaks and impressive mid-week visitation trends, Dave & Buster’s appears poised to enjoy a robust December – another important seasonal milestone for the restaurant. And keep an eye out for the week after Christmas, traditionally Dave & Buster’s busiest week of the year: Last year, the week starting December 25th drove a 65.0% visit spike to the chain compared to a 2023 weekly average.
Summer Success at Chuck E. Cheese
Speaking of promotions – Chuck E. Cheese is another eatertainment leader that has been finding success by leaning into special deals, making it easier for price-conscious consumers to treat their kids to pizza and fun.
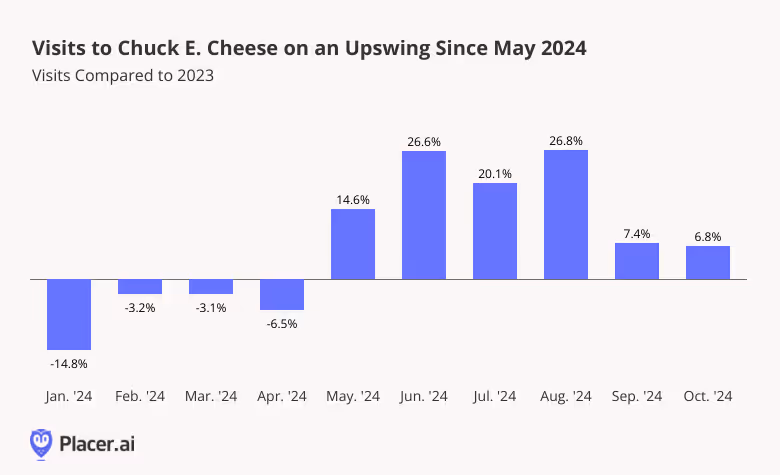
Following a lackluster start to the year, YoY visits to Chuck E. Cheese began trending upwards in May 2024 and have remained elevated ever since. Between June and August 2024, foot traffic to Chuck E. Cheese was up between 20.1% and 26.8% compared to the equivalent period of 2023. And though the pace of visit growth began to taper in September as kids went back to school, visits remained substantially higher than last year.
Chuck it Up to Loyalty
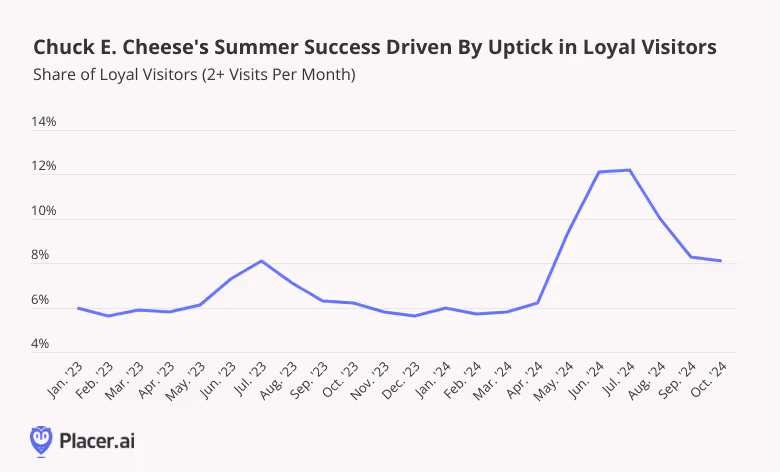
What’s behind Chuck E. Cheese’s summer flourishing? A look at shifts in loyalty trends at the chain suggests that the success of this year’s Summer Fun Pass may be a big part of the story.
On average, the share of loyal visitors to Chuck E. Cheese – i.e. those frequenting the restaurant at least twice in a month – tends to range between five and seven percent. Last summer, this percentage increased to 8.1%, as parents sought out indoor activities to keep kids occupied when school was out. But this year’s summer loyalty spike – just over 12.0% in both June and July – was significantly higher.
Though Chuck E. Cheese also offered a Summer Fun Pass last year, this year’s deal provided even greater value – including unlimited visits over a two-month period, steep discounts on food, and up to 250 games per day. And the promotion was such a smashing success that Chuck E. Cheese has launched a new unlimited-visit pass meant to make frequent trips to the chain more affordable for families all year round. As the kids’ eatertainment leader continues to revamp its offerings – remodeling locations and adding new activities like indoor trampolines – Chuck E. Cheese appears poised to keep drawing the crowds.
Winning With Fun
Today’s cautious consumers are always on the lookout for ways to save – and eatertainment chains are paying attention. Will Dave & Buster’s post-Christmas visit spike outperform last year’s? And will Chuck E. Cheese’s new unlimited play model continue to drive traffic throughout Q4?
Follow Placer.ai’s data driven analyses to find out.

The past several years have been a boom period for affordable indulgences – with consumers tightening their purse strings and finding inexpensive ways to treat themselves. Against this backdrop, discount specialty retailers Five Below and Ollie’s Bargain Outlet have been growing their footprints – and their audiences. But have the two chains reached their growth ceilings? How did they fare in Q3 2024 – and what can they expect this holiday season?
We dove into the data to find out.
Growing Audiences
Five Below opened a record 205 new stores last year, leaning into growing consumer demand for low-cost toys, decor, and other indulgences. And though the chain announced plans to moderate fleet growth following a below-target Q2 2024, visit data shows that overall, the chain remains well-positioned for continued success. In Q3 2024, Five Below’s growing footprint fueled a 13.8% chain-wide year-over-year (YoY) visit boost. Though the average number of visits to each individual Five Below location remained slightly below 2023 levels, the chain’s visit-per-location gap narrowed to 1.6% from 4.3% in Q2. And in some key growth markets, Five Below saw significant increases in both YoY visits and visits per location: California, one of Five Below’s biggest regional markets and the focus of a major expansion push this year, saw visits per location grow 4.4% amidst a 21.6% overall visit increase.
Ollie’s Bargain Outlet is another value-focused specialty retailer that has benefited from consumer trading down in recent years. And foot traffic data highlights the success of Ollie’s ongoing expansion: In Q3 2024, foot traffic to Ollie’s increased 7.5% YoY, while the average number of visits to each Ollie’s location also increased slightly by 0.9%. Though this represents a smaller visit-per-location increase than that seen in Q2, Ollie’s ability to maintain strong per-location visit levels while increasing its store count shows that the chain’s offerings are still meeting robust demand. And Ollie’s shows no sign of slowing down – snapping up former Big Lots store leases and plotting westward expansion.

What About the Holidays?
Five Below and Ollie’s are both popular holiday shopping destinations. But what can the two retailers expect this year?
Visit data shows that Five Below and Ollies experience holiday milestones somewhat differently. Ollie’s, with its broad selection of deeply discounted high-ticket items, sees a slightly bigger Black Friday spike than Five Below: On November 24th, 2023, visits to Ollie’s surged by 222.9% compared to a 2023 daily average, higher than Five Below’s none-too-shabby 204.1%.
Meanwhile, the run-up to Christmas is is Five Below’s time to shine – with visits slowly increasing throughout December before reaching a crescendo on Super Saturday. In 2023, Five Below’s busiest day of the year was December 23rd, as customers flocked to the chain to pick up stocking stuffers, festive decor, and other inexpensive holiday items. Ollie’s, on the other hand, saw a more moderate 171.7% Super Saturday visit increase. As Five Below continues to expand its pricier “Five Beyond” offerings, Black Friday may take on greater importance for the retailer in coming years.

But while Ollie’s visit peaks were more subdued than those of Five Below throughout most of the holiday season, the chain’s treasure hunt vibe consistently drew longer visitor dwell times. On Black Friday last year, 26.5% of visitors to Ollie’s remained in-store for more than 45 minutes, compared to just 18.3% at Five Below. And despite Ollie’s significantly smaller Super Saturday crowds, customers spent substantially more time browsing its aisles to snag the perfect bargain find.

Looking Ahead
Five Below and Ollie’s both appear poised to enjoy a busy holiday season. Will the retailers deliver?
Follow Placer.ai’s data-driven retail analyses to find out.
The Kroger Co. has come a long way from its humble beginnings as a single grocery store in downtown Cincinnati, Ohio, in 1883. Today, the brand operates over 2,700 stores under its numerous grocery store banners.
We analyzed the visitation patterns at some of Kroger’s largest chains to see how these brands have fared over the past few months, and looked at what last year’s visit data can tell us about the upcoming Thanksgiving holiday.
Visits To Kroger Banners Show Stability in Q3
The Kroger Co.’s various grocery banners vary in size and scale, with its eponymous banner Kroger – more than 1200 stores across much of the midwest and south – attracting the largest visit share relative to the company’s full grocery portfolio. Kroger’s other major regional chains, including Harris Teeter (mid and south atlantic states); Ralphs (California), King Soopers (primarily Colorado), Food 4 Less (California, Illinois, and Indiana), Smith’s (Mountain states), Fry’s (Arizona), and Fred Meyer (Pacific northwest), lend the company considerable presence nationwide.
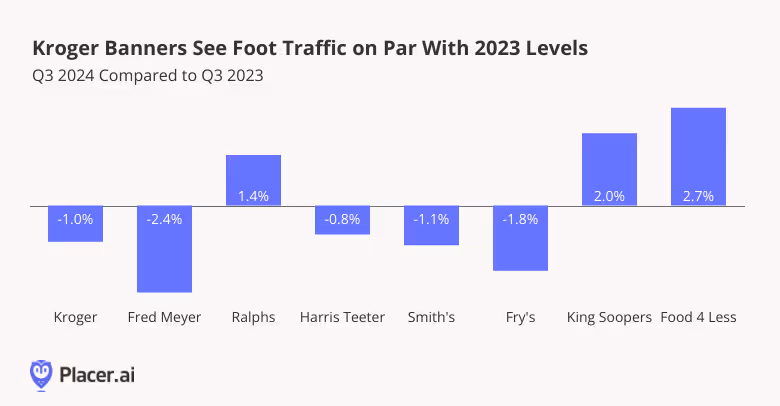
On the whole, visits to the analyzed Kroger chains remained fairly close to 2023’s levels, with visits to Kroger, Fred Meyer, Harris Teeter, Smith’s, and Fry’s sustaining minor YoY visit gaps. No-frills value chain Food 4 Less enjoyed 2.7% YoY visit growth in Q3, likely buoyed by the same trading down behaviors that have propelled growth at other low-cost supermarkets this year. Ralphs and King Soopers also saw YoY visit growth, perhaps aided by California and Colorado’s relatively high median household incomes (HHIs) – $94.1K and $89.1K, respectively, according to data from STI: PopStats, compared to the nationwide baseline of $76.1K.
Shoppers Lingering at Discount, Hypermarket Options
Kroger’s extensive reach allows it to appeal to a wide range of grocery shoppers. The company operates both discount grocery chains, such as Food 4 Less, more upscale ones like Harris Teeter, and everything in between.
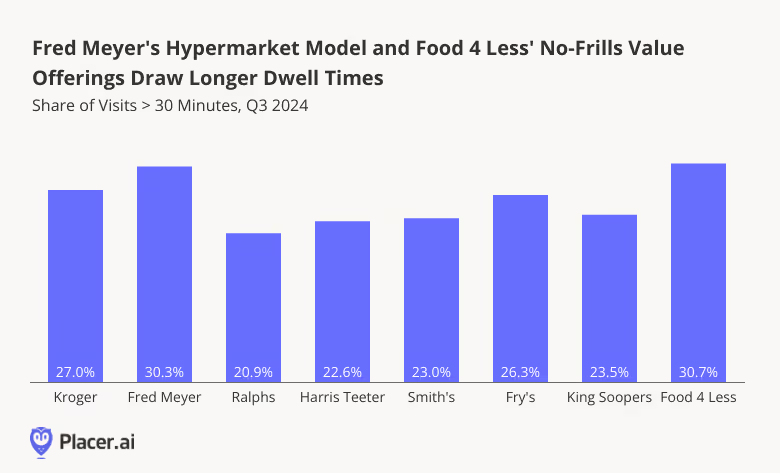
Diving into the share of visits lasting 30 minutes or longer at individual Kroger banners reveals substantial variation, with Fred Meyer and Food 4 Less receiving the highest shares of long visits among the analyzed chains. In Q3 2024, 30.3% of Fred Meyer visits and 30.7% of Food 4 Less visits lasted over 30 minutes – a stark contrast to Ralphs (20.9%), Harris Teeter (22.6%) and King Soopers (23.5%).
This variance in dwell times may reflect the differing offerings of each chain. Hypermarket Fred Meyer provides a wide range of services beyond groceries – including pharmacies, department stores, and jewelry offerings – which could encourage shoppers to spend more time exploring. And Food 4 Less falls squarely into the discount grocery segment, one that often sees customers spending more time in-store searching for the best deals.
Turkey Wednesday Poised to Bring the Crowds
While not (yet!) an official holiday, Turkey Wednesday – the day before Thanksgiving – is one of the most important days of the year for grocers as shoppers flock to stores to pick up last-minute items for their upcoming feasts.
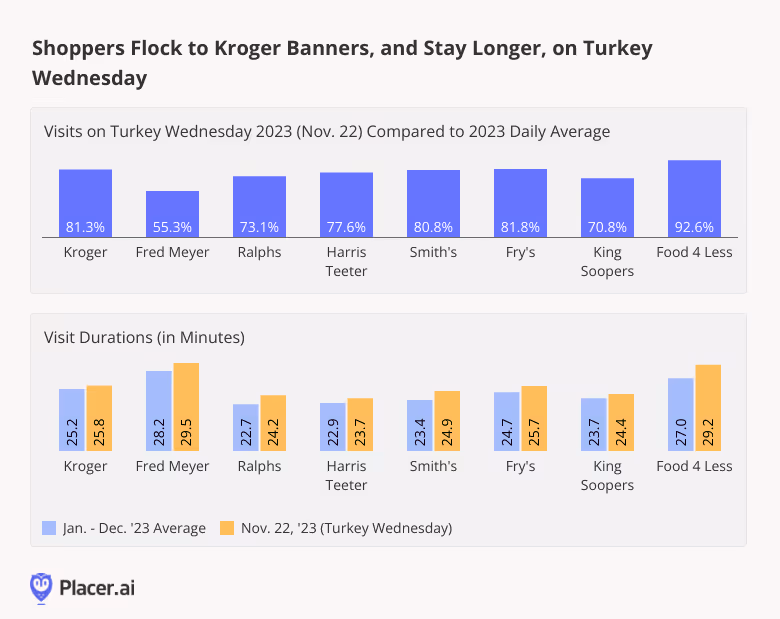
And while Thanksgiving is still over a week away, analyzing trends from previous years can help grocers prepare for the coming frenzy. On November 22nd, 2023 – the day before Thanksgiving – visits across all analyzed Kroger chains shot up between 55.3% and 92.6% compared to the daily visit average for 2023. And visitors at each of the chains stayed longer in-store than they typically did during the rest of the year.
With visits to Kroger’s major banners either nearly on par with or ahead of last year’s levels, the company appears well-positioned to enjoy another year of strong Turkey Wednesday visits.
Final Thoughts
If previous years are any indication, Kroger’s grocery banners should be preparing for a surge in Thanksgiving shopping. Will visits outpace those of last year?
Visit Placer.ai to keep up with the latest data-driven grocery insights.

The all-important fourth quarter of the year is underway, and leading beauty chains like Ulta Beauty and Sally Beauty Supply are gearing up for an exciting holiday shopping season. We dove into the data to see how the two chains have performed in recent months – and what they can expect in this year’s Q4 retail milestones.
Ramping Up Ahead of the Holidays
In Q3 2024 (July - September), quarterly visits to Ulta and Sally Beauty were essentially on par with last year’s levels. Ulta saw a minor year-over-year (YoY) uptick of 1.2%, while Sally Beauty maintained a slight visit gap.
Diving into monthly visit trends, ever-expanding Ulta experienced positive YoY foot traffic growth throughout the summer – especially in August, when an additional Saturday provided vacationers and back-to-school shoppers with extra weekend browsing time. And though visits to the chain dipped in September, they quickly bounced back again, with October seeing a 4.5% YoY visit boost likely bolstered by Halloween offerings and seasonal sales.
Sally Beauty, for its part, has been closing locations as part of a store optimization plan implemented largely in 2023. Viewed against this backdrop, the chain’s modest monthly visit gaps – which narrowed to just 0.2% in October 2024 – are particularly impressive. And Sally Beauty Holdings, Inc. has remained nimble on its feet, testing new concepts like Happy Beauty Co., a new store format with cosmetics and other self-care products priced under $10.
For both chains, their October showing signals that eager customers are gearing up for a busy Q4.

Looking Back to See Ahead
But how do Ulta and Sally Beauty experience the holiday season? Which retail milestones resonate most strongly with their customers – and where do they see the most impressive holiday visit boosts?
Ulta Beauty leans heavily into Black Friday each year with early deals that culminate in a shopping bonanza on the day after Thanksgiving – and in 2023, the milestone was the chain’s busiest day of the year. On November 24th, 2023, visits to Ulta were up 270.6% compared to a 2023 daily average. The second-busiest day of the year for Ulta was Super Saturday (December 23rd, 2023), which saw a 219.0% visit bump.
Still, looking at major Ulta markets throughout the country reveals significant regional variation in holiday milestone visitation patterns. Like many other retailers, Ulta experiences bigger Black Friday visit bumps in midwestern metro areas like Chicago, and much smaller ones in California hubs like Los Angeles. And though Black Friday is more important for the chain than Super Saturday on a national level, several CBSAs – including Dallas, New York, and Los Angeles – saw bigger boosts on Super Saturday than on Black Friday.
Sally Beauty – with its more specialized focus on hair care products – sees smaller holiday visit bumps than Ulta. But the chain’s holiday deals do draw crowds. December 23rd was Sally Beauty’s busiest day last year, with visits up 86.2% nationwide and significantly elevated throughout the chain’s major markets. And though Black Friday is much less significant for the retailer – in 2023, it was only Sally Beauty’s 11th busiest day of the year – the chain’s Black Friday deals drove a 55.4% visit bump.

Going the Distance for Holiday Finds
And visits aren’t the only thing that increase at Ulta and Sally Beauty during the holidays. Looking at driving distances to the two chains shows that on Q4 milestones – and especially Black Friday – people travel farther to shop the sales. On Black Friday 2023, and to a lesser extent Super Saturday, both retailers saw significant jumps in the share of visitors traveling more than 10 or 30 miles to visit their brick-and-mortar locations.
.avif)
Much to Anticipate
Affordable luxuries like cosmetics and hair care products make the perfect stocking stuffers for consumers still concerned about high prices. And if last year’s holiday trends are any indication, Ulta and Sally Beauty appear poised to enjoy a very festive holiday season indeed.
Visit Placer.ai for more data-driven retail insights.

Note: This post utilizes data from Placer.ai Data Version 2.1. and thus reflects minor adjustments in data from previous reports.
Amazon, Dell, Goldman Sachs, Walmart, UPS – these are just a few of the major employers that have been cracking down on remote work in recent months, some requiring their teams to be on-site full time.
So with summer behind us, we dove into the data to assess the impact these accumulating RTO mandates are having on the ground. Are offices continuing to fill up, or has the office recovery run its course?
Recovery, Unabated
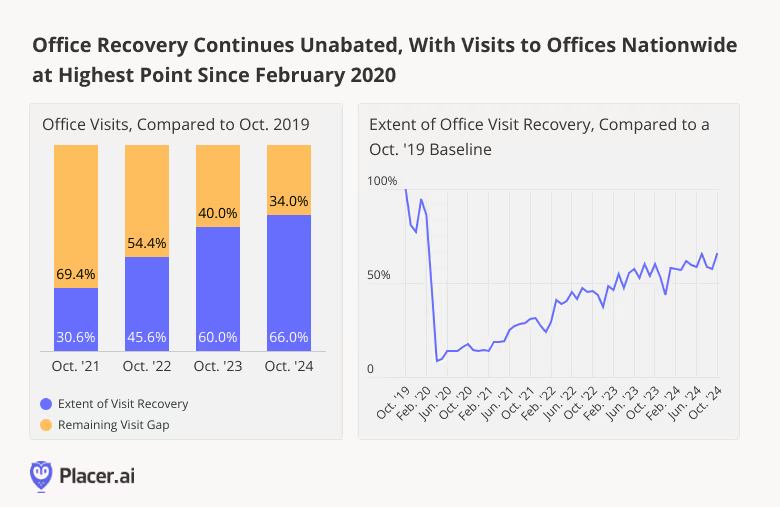
In October 2024, office visits nationwide were 34.0% below October 2019 levels. And looking at monthly fluctuations in office foot traffic over the past five years shows that the RTO remains in full swing – with last month’s visits reaching the highest point seen since February 2020.
New York and Miami Hold the Lead
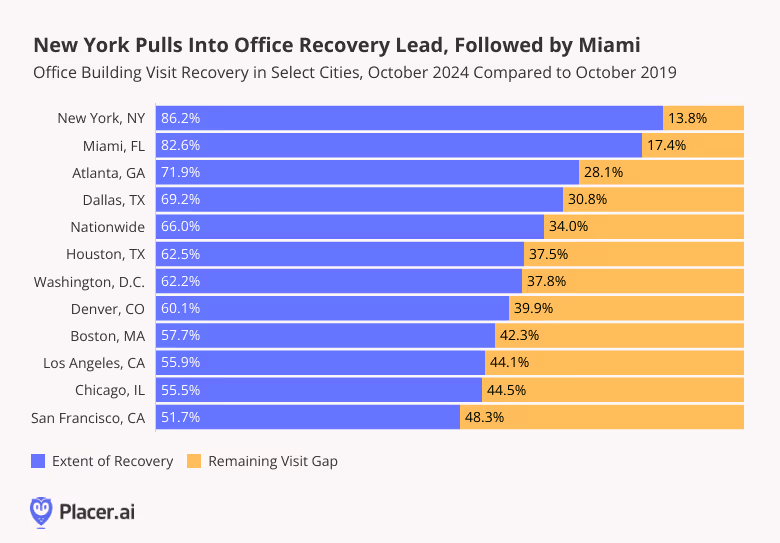
Digging down into regional data shows that in several major hubs – including Atlanta, Dallas, Houston, Denver, Washington, D.C., Chicago, and San Francisco – October 2024 was the single busiest in-office month since COVID. And in Boston, Los Angeles, Miami, and New York, October was the second-busiest month, outpaced only by July.
Still, New York and Miami continued to lead the regional office recovery pack, with October 2024 visits in the two cities up to 86.2% and 82.6%, respectively, of 2019 levels. The two hubs, joined by Atlanta and Dallas, continued to outperform the nationwide average. And Houston, which lagged behind other major business hubs during the summer in the wake of major storms, reclaimed its position just under the nationwide baseline.
Washington, D.C., Boston, and Atlanta Lead in YoY Growth
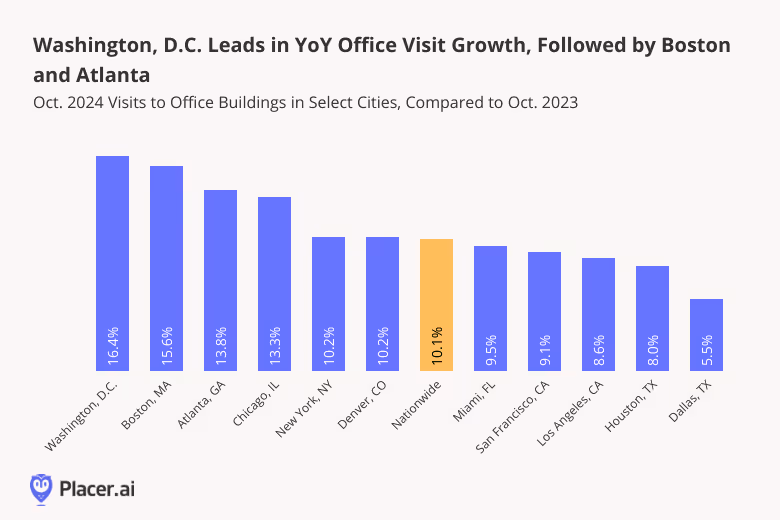
In October 2024, visits to office buildings in Washington D.C. increased 16.4% year over year (YoY), likely boosted by an RTO push meant to increase meaningful in-person work in federal agencies – though many government employees continue to telework. Boston, where office building occupancy is outperforming national levels, visits saw a 15.6% YoY uptick. And Atlanta, where major employers from UPS to NCR Voyix are requiring workers to show their faces five days a week, saw visits grow 13.8% YoY.
Nationwide, office foot traffic increased 10.1% YoY – showing that the return-to-office is still very much a work in progress.
More Recovery Ahead?
Office attendance fosters creativity, mutual learning, and a sense of community – and can be critical for early-career success. But working from home at least some of the time offers greater flexibility that can improve employees’ work-life balance and in some cases, even enhance productivity. How will companies and employees continue to navigate the ongoing RTO?
Follow Placer.ai’s data-driven office recovery analyses to find out.
This blog includes data from Placer.ai Data Version 2.1, which introduces a new dynamic model that stabilizes daily fluctuations in the panel, improving accuracy and alignment with external ground truth sources.

